07.0 - MANAGING PLANNING & SCHEDULING
07.1 - MODULE 07-1 - INTRODUCTION TO MANAGING PLANNING & SCHEDULING
07.1.1 - WHAT IS THE PURPOSE OF MANAGING PLANNING & SCHEDULING
The purpose of the Managing Planning
and Scheduling Module is to introduce the tools, techniques and methodologies that have been identified as being “best tested and proven” practices associated with planning and scheduling, which have been found to work on “most projects, most of the time”; provide a logical or rationale sequence showing when those tools or techniques would normally and customarily be used and in selected instances, show how to use those tools/techniques and/or where to find additional information on how to use or apply them.
Planning and Scheduling or Planner and Scheduler are terms that are often used together when in fact they are two very different and often misunderstood elements. Global nuances have helped continue the incorrect use of the two terms.
The Aims or Role of the Planner and / or Scheduler: Is to create, manage and utilize one of the projects most valuable tools; the Project Schedule (frequently referred to as the programme).
It is generally accepted that Planning is defined to be:
- A basic management function involving the identification and definition of what needs to be done to achieve organizational strategic or tactical objectives, followed by the formulation of one or more appropriately detailed plans to achieve optimum balance of needs or demands with the available resources.
The planning process:
(1) identifies the goals or objectives to be achieved,
(2) formulates strategies to achieve them,
(3) arranges or creates the means/methods required, and
(4) implements, directs, and monitors all steps in their proper sequence.
It is generally accepted that Scheduling is defined to be:
- Assigning an appropriate number of workers to the jobs during each day of work, determining when an activity should start or end, depending on its: duration, predecessor activity (or activities), predecessor relationships, resource availability, and target completion date of the project.
The schedule is a dynamic, logically linked series of activities or tasks that reflects the plan, the sequence, the resource requirements, the achievements, the forecasts, what’s critical, what's not critical as well as bar charts and other reporting tools and metrics for project participants to learn from, use and form opinions from and should include all existing constraints (i.e. time, logic, space, resources, supply, financing, etc.) and only then can it be considered “realistic” and able to help to forecast results and be used to answer any “what if” questions.
It is a mathematical tool that confirms if project targets are achievable or not and demonstrates the optimal way to execute project activities taking into account all existing limitations.
To summarize, planning is about WHAT needs to be done (scope of work) and WHY that scope of work is important to achieving the organization’s strategic or tactical objectives, while scheduling is about WHAT resources are required, HOW the work will be sequenced and WHEN each activity needs to start and end in order to produce the scope of work as defined within a finite time frame, constrained by resource limitations and potential risk events.
07.1.2 - WHAT ARE THE PROCESS MAPS FOR MANAGING PLANNING & SCHEDULING
This module is about the creation of the baseline, prior to the schedule being progressed or updated, and as such the primary deliverable at the completion of this process along with the process of Planning and Scheduling, is to create the “Performance Measurement Baseline” (PMB) which traditionally takes the shape of an S Curve, and is used to capture, measure and assess progress against the baseline plan and to forecast current performance based on past performance to date.
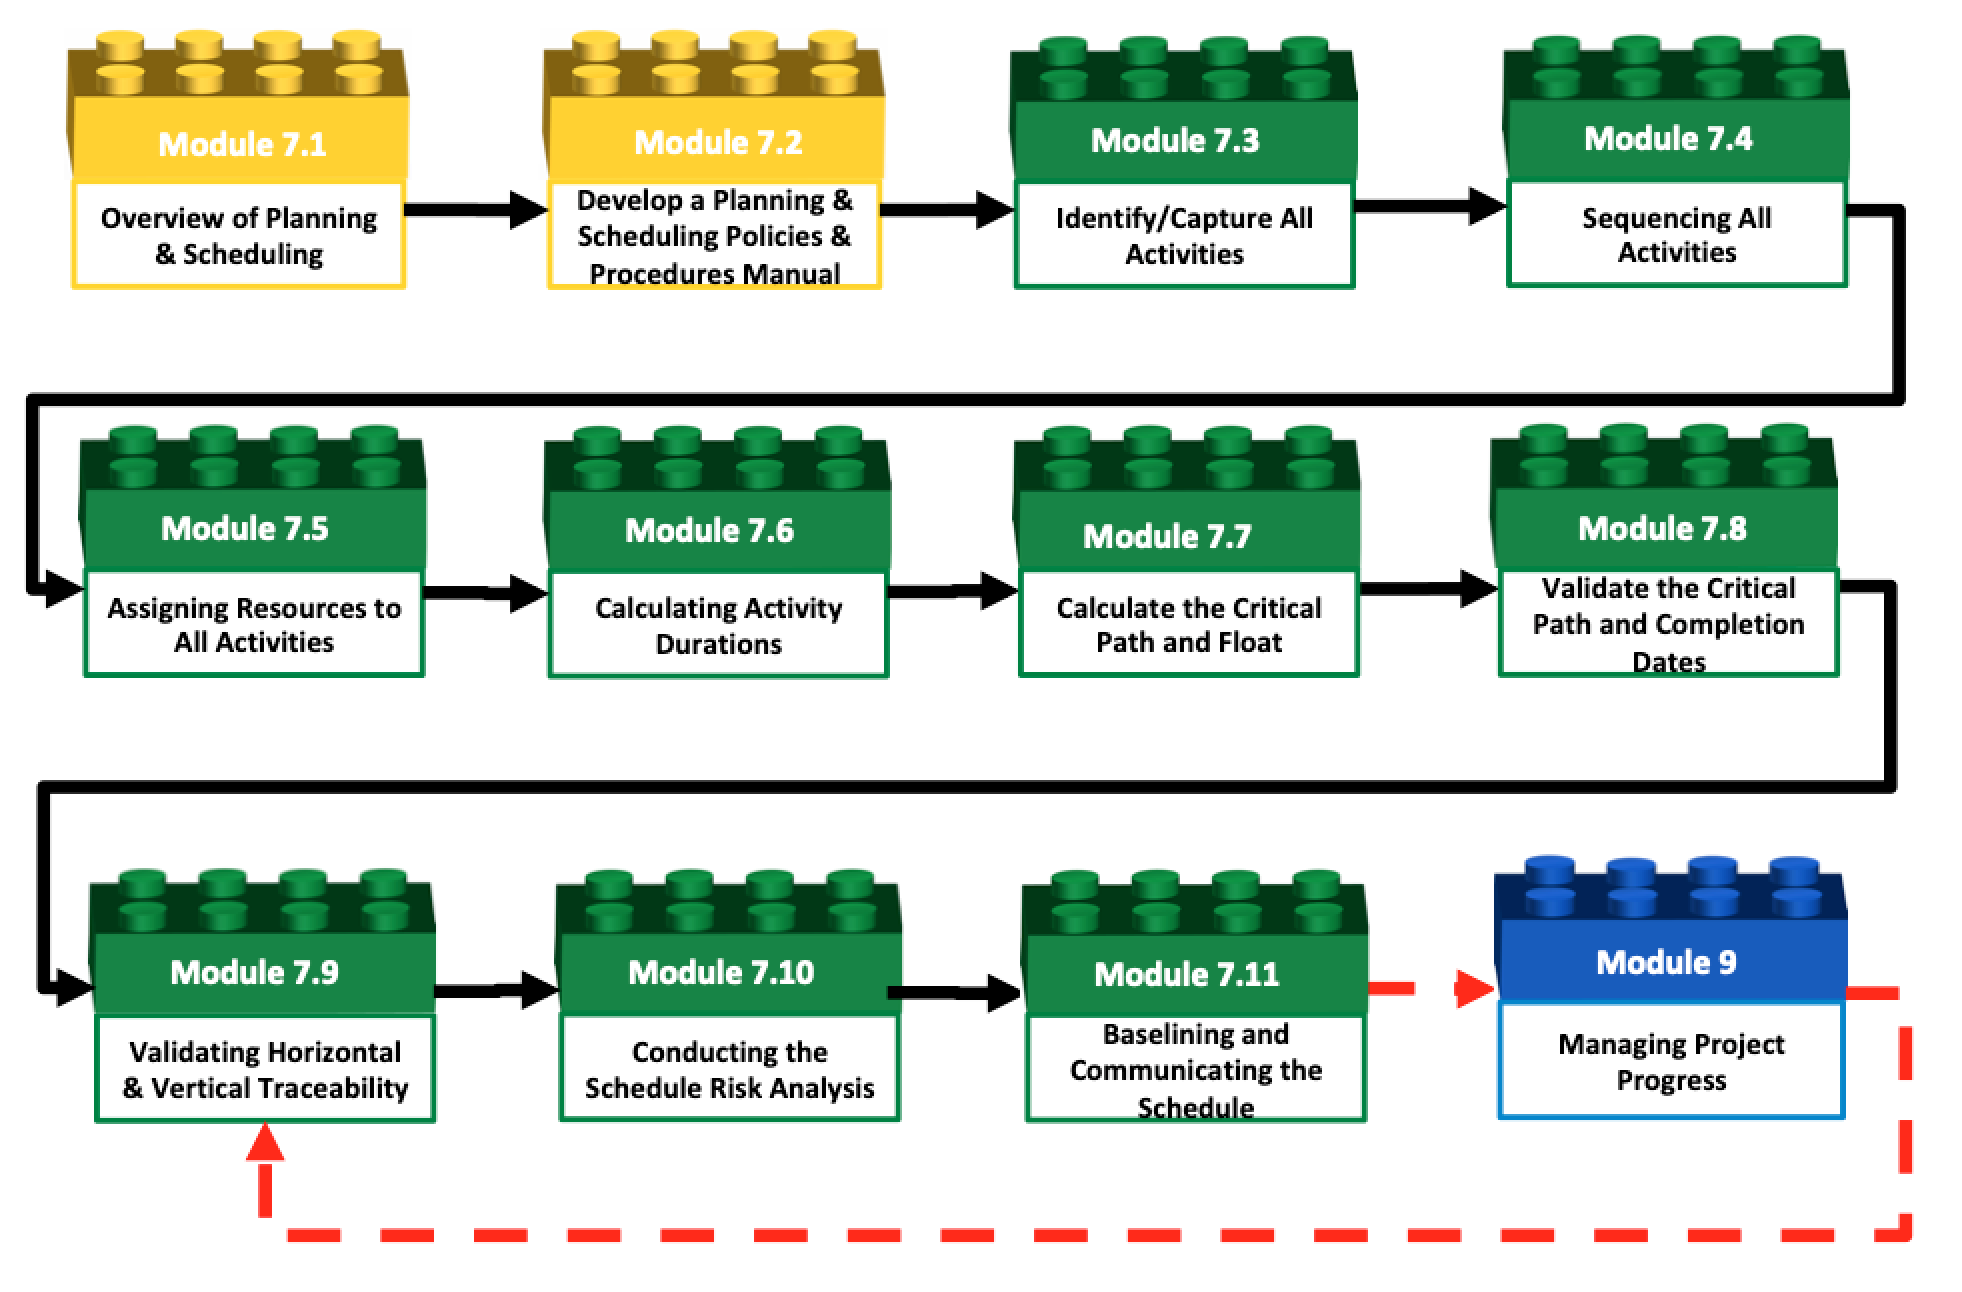
Figure 1 - 1,000 Meter Level Typical Process Flow Chart for Module 7- Managing Planning and Scheduling with links to Module 9- Managing Progress
Source: Guild of Project Controls
To turn the cost estimate into the cost budget, we need to INTEGRATE the Planning and Scheduling processes from Module 7 with those of Module 8. To see how the two processes are complimentary and synergistic, we need to understand the process shown in Figure 2 below.
Please note that in functionally structured organizations this means the management of each functional group needs to coordinate the efforts between the planning/scheduling functions and the cost estimating/cost budgeting functions, however, if the organization is structured cross functionally as a project management office, (PMO), Project Support Office (PSO) or Project Controls Office (PCO) this integration may well be done by the same people either separately or more commonly, simultaneously.
Also important to understand is the fully integrative relationship between Module 7- Managing Planning and Scheduling, Module 8- Managing Cost Estimating and Budgeting and Module 9- Managing Progress which is also shown below in Figure 2.
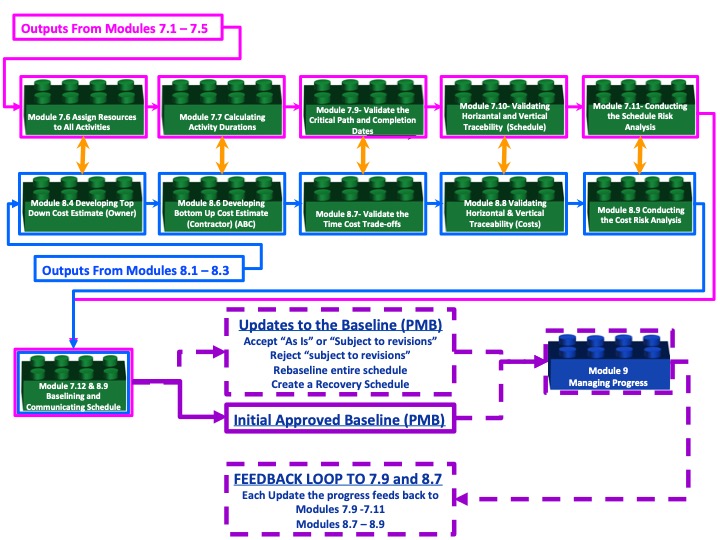
Figure 2 - 1,000 Meter Level Integrated Process Map between Module 7- Managing Planning and Scheduling and Module 8- Managing Cost Estimating and Budgeting
Source: Guild of Project Controls
The Management Planning & Scheduling Process Map:
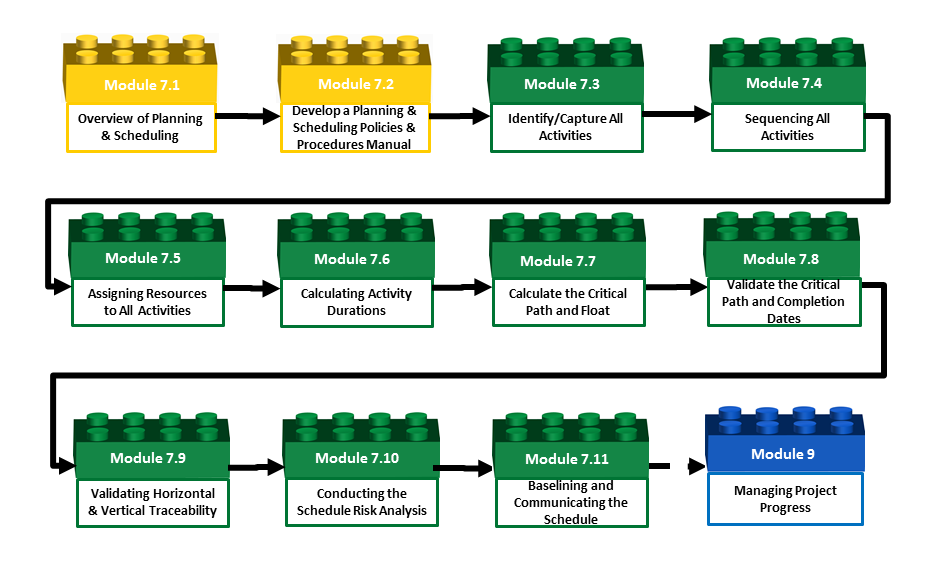
Figure 3 - The Management Planning & Scheduling Process Map 1,000 Meter Level of Detail
Source: Guild of Project Controls
The process which initiates the Planning and Scheduling processes is the policies and procedures manual. It is important that the policies and procedures manual be developed and maintained by those who are doing the work as without their buy in and support, they will quickly ignore the existing SOP and start using their own shortcut version.
The second step in the process s to further decompose the WBS into the activities. While the WBS tells us WHAT needs to be done, the activities tell us how we are going to actually do it.
The third step is to sequence the activities in the correct or most efficient order.
The fourth step s to assign the resources. The reason we assign resources first rather than establishing durations is because if there are not enough resources available then it will be impossible to perform the activity in the time frame allowed. So from a risk management perspective, let the resource availability drive the duration and not the other way around.
The fifth step in the process is calculate the durations which should be based on the available resources and their productivity.
The next step is to press “F9” (Primavera) and allow the software to calculate the schedule which will give us the Critical PATH (activities with zero total float); the near critical activities and those activities which are not critical.
Step 7 s to validate the critical path and make certain that the combination of logic and duration’s enables the project to finish within the targeted or acceptable time frames.
Step 8 s to ensure that the project as planned s able to “roll up” and “roll down” to the appropriate levels of detail and that there are “handover” activities between one phase or work package and the next.
Step 9 s to validate that we have allowed time buffers or time contingency to cover the difference between the P50 duration and whatever comfort or “P level” management expects to see.
Step 10 requires that we work with the cost estimating and budgeting people to ensure that the CPM schedule has been cost loaded, which will enable us to generate the “S Curve”. The cost and resource loaded CPM schedule, once approved, becomes the Performance Measurement Baseline or PMB.
For the 100 Meter View, see each sub-module within the Planning and Scheduling Module.
While the 100 Meter level of detail provides a more granular look of the processes and how they interact than the 1,000 Meter view, there is yet another deeper level of detail which the Guild calls the “ground” or “working level”. It is the next level deeper which contains the explanation for each of the modules shown above, telling more about what inputs are required, including providing some examples; what tools, techniques are typically used, including providing examples or templates, and in selected instances, specific step by step instructions or links to additional resources, showing how to use each of these tools or techniques consistent with the Guild’s commitment to identify and advocate “best tested and proven” practices.
07.1.3 - BACKGROUND INFORMATION FOR MANAGING PLANNING & SCHEDULING
This Module explains the processes by which the Planning & Scheduling practitioner utilises the Work Breakdown Structure (WBS) and Control Accounts (created within the Module 3 - Managing Scope) and from these scope management tools, builds a dynamic schedule model of the project, gains agreement or approval and produces a ‘baseline’ against which progress can be measured.
07.1.3.1 - History of Planning & Scheduling
Edmond Burke (1729 – 1797) was an Irish philosopher who warned us that “Those who don't know history are doomed to repeat it.” For that reason we want to open this Module with a brief over-view of the history of scheduling, and some of the leading contributors. Especially for those just entering the field as entry level planners, schedulers and project control professionals, it is important that you know and understand some of the history behind our discipline.
The primary reference on the “History of Scheduling” comes to us from Pat Weaver through his paper “Brief History of Scheduling” and based largely on that work, the following names are important for us:
- Joseph Priestly (1765) – was an 18th century English philosopher/theologian who is credited with having originated the use of the bar chart for historical and biographical purposes. Amongst his many contributions, he is also credited with having discovered oxygen.
- William Playfair (1796) - was a Scottish mathematician and theologian who is credited with developing a range of statistical charts including the line, bar (histogram) and pie charts. Playfair built upon Priestly’s concept by adding histograms to the bar chart, not a whole lot unlike what we see today when we combine the “Gantt Chart” view in MS Project with the Resource Histogram view.
- Karol Adamiecki (1896) created the "Harmonograph" or "Harmonogram" which evolved into what is known today (incorrectly named) as the Gantt Chart.
- Henry Fayol (1916) was one of the earliest advocators for the use of the Work Breakdown Structure (WBS) and the “Work Package” with his 1916 publication of "Administration industrielle et générale" which was translated into English in 1949. He was also the first to formalize the 6 responsibilities of management: to plan and forecast (“prevoyance”), to organize, to staff, to command or direct, to coordinate and to control. Many consider Fayol to be the father of modern project management and especially the concepts that have become “project controls”.
- Henry Gantt (1916) contrary to common belief, Henry Gantt did NOT “invent” the Gantt chart. That credit should have gone to Karol Adamiecki. Gantt (along with Frederick Taylor) was focused on worker productivity and an early advocate for the use of "earned value" or "earned time" as the basis for incentive payment for factory workers. While much of what Gantt (and Fayol) wrote about was for operational environments (steel mills and mines) the concepts are readily adaptable to project management. The definitive work on Gantt comes to us compliments of Pat Weaver.
- James E. Kelley, Jr. and Morgan Walker (1957) developed the first computerized schedule using i-j node programming. (Arrow Diagramming Method (ADM) also known as Activity on Arrow (AoA) method)
- John W Fondahl (1960) developed the first manual approach to scheduling. On your GPC exams you will be required to manually calculate total float using the same formula developed by Fondahl
As you will come to find out, much of what we do as practitioners have come to us from the work of Fayol, Gantt, Taylor, Frank and Lilian Gilbreth and while originally developed for use in an industrial or operational environment have been adapted for use in a project environment.
There are numerous instances where our failure to know and understand the history of scheduling has caused us to “reinvent the wheel” with people getting or taking credit for “rediscovering” concepts which have been in use for many years before and were thought to be “common knowledge”, the Guild of Project Controls believes it important for future generations to know and understand the history of our craft.
This module is based predominantly around the Recommended Practices (RP) of the Association for the Advancement of Cost Engineering (AACE) and the Best Practices for Project Schedules from the US Government Accountability Office’s (GAO).
- Recognizing that there is not and probably never will be 100% agreement on what constitutes “Scheduling Best or Good Practices” the Guild of Project Controls Subject Matter Experts (SME) believe this GPCCAR to be the most single comprehensive document to date which represents the consensus of so many stakeholders.
- Wherever possible, in the event there are strongly held opposing views, the Guild will include them in this document. In this Module the Guild Subject Matter experts have provided clarification, elaboration, expansion on and sometimes disagreement with what the two main references have recommended.
07.1.3.2 - Planning & Scheduling
The Terms: Planning and Scheduling or Planner and Scheduler are terms that are often used together when in fact they are two very different and often misunderstood elements. Global nuances have helped continue the incorrect use of the two terms.
The Aims or Role of the Planner and / or Scheduler: Is to create, manage and utilize one of the projects most valuable tools; the Project Schedule (frequently referred to as the programme).
07.1.3.2.1 - Planning
It is generally accepted that Planning is defined to be:
A basic management function involving formulation of one or more detailed plans to achieve optimum balance of needs or demands with the available resources. The planning process:
(1) identifies the goals or objectives to be achieved,
(2) formulates strategies to achieve them,
(3) arranges or creates the means required, and
(4) implements, directs, and monitors all steps in their proper sequence.
07.1.3.2.2 - The Project Management Plan
The overall planning process most often results in the creation of a Project Plan (often referred to as the Project Management Plan) – this being a set of documents, which support the project schedule, whilst defining the scope, objectives, requirements, budgets and timeframes envisaged for the project.
On many projects this is a formal, approved document or required deliverable and according to standards such as the PMBOK or PRINCE2, the plan must also describe the execution, management and control of the project.
This information can be provided by referencing other project documents such as a Risk Plan or Project Schedule, or it may be detailed in the Project Plan itself.
To be considered complete a Project Plan at MINIMUM should consist of the following items:
- People - Individual competencies, Management competencies, Organizational competencies & Stakeholder identification and engagement (See Module 2 - Managing People)
- Scope - Stakeholder requirements or objectives, Project Scope Statement, Work Breakdown Structure Dictionary, Work Breakdown Structure & Scope Baseline (See Module 3 Managing Scope)
- Risk / Opportunity - Risks Identified, Quantified, Prioritized & Risk Reponses Developed (See Module 4 - Managing Risk & Opportunity)
- Contracts - Contract Documents & Managing Contracts for Project Controls (See Module 5 - Managing Contracts)
- Resources - People, Materials & Equipment (See Module 6 - Managing Resources)
- Schedule - Cost and Resource Loaded Schedule & Schedule Baseline against which to track changes in time (See Module 7-11 - Baselining & Communicating the Scheduling)
- Cost - Cost Estimate & Cost Baseline budget (cost loaded schedule) against which to track changes in cost (See Module 8 - Managing Costs Estimating & Budgets)
- Quality - Continuous Process Improvement, Project Control Quality metrics & checklists (See Module 1- Managing Project Controls)
- Communications - Reporting Structures and Report Types (See Module 1- Managing Project Controls)
07.1.3.2.3 - Scheduling
It is generally accepted that Scheduling is defined to be: Assigning an appropriate number of workers to the jobs during each day of work, determining when an activity should start or end, depending on its: duration, predecessor activity (or activities), predecessor relationships, resource availability, and target completion date of the project.
07.1.3.2.4 - The Project Schedule
The Project Schedule, assuming it is fully cost and resource loaded as “best tested and proven practices” indicates it should be, lies at the heart of project controls.
The schedule is a dynamic model demonstrating how the project is planned to be carried out.
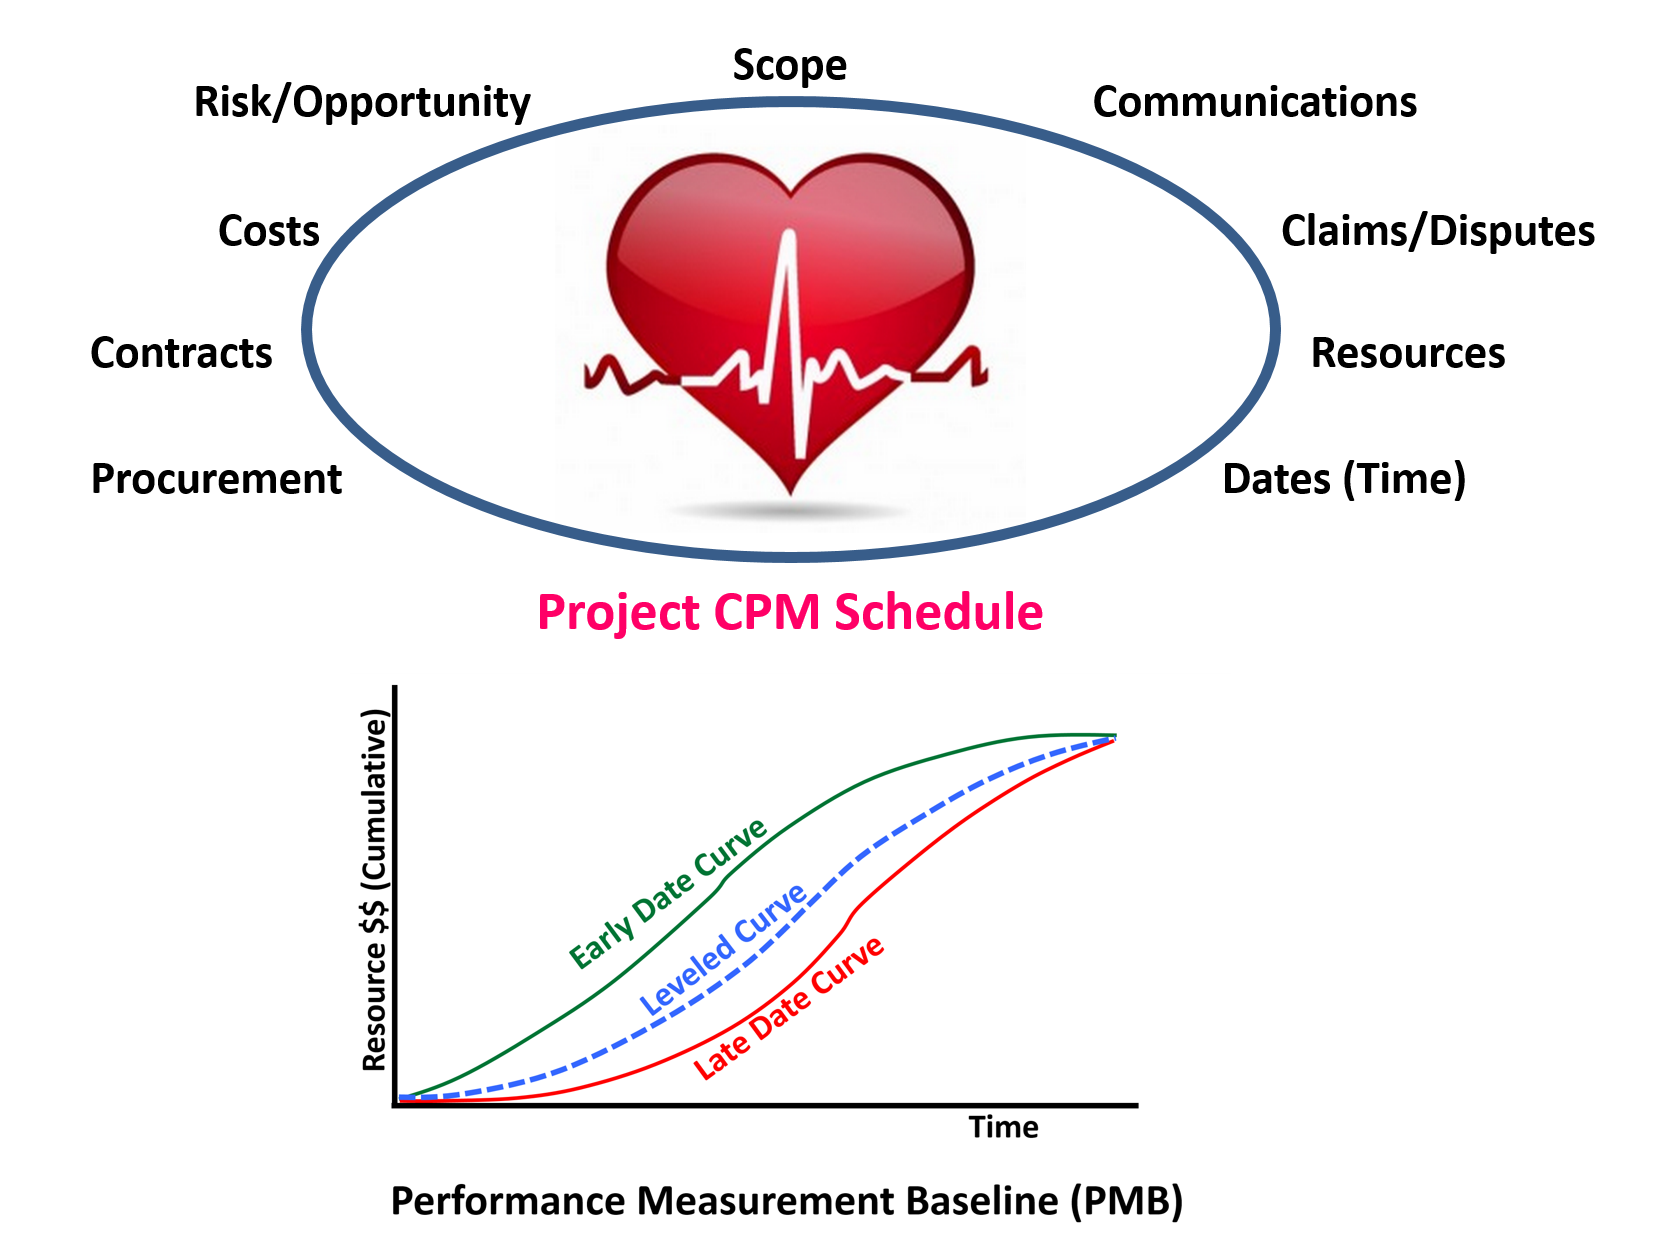
Figure 4 - Project Schedule as the Project Integrator
Source: Adapted from Project Manager’s Desk Reference, 2nd Edition, Lewis
Is it the single point where everything comes together in one document:
- Scope - The Project Schedule is a more detailed elaboration of the Work Breakdown Structure (WBS) and the schedule activities are an extension or continuation of the WBS which tell us what needs to be created to satisfy the needs of the project. The Work Packages and activities tell us how those scope elements / deliverables will be produced and when each will occur.
- Risks / Opportunities - The Project Schedule is where we begin to mitigate risks by building in time and cost contingency and is where we start to see opportunity as the project progresses.
- Contracts - The Project schedule is where we can see the interrelationship between the owners, contractors, subcontractors and vendors activities. We dynamically analyse these interrelationships through schedule modelling or in real time.
- Resources - The Project Schedule, assuming it is resource loaded as it should be, provides us with the histograms showing the required resource quantities and production outputs and when compared to peak resource availability gives us a clear indication of how much resource flexibility we have.
- Costs - Regardless of whether we are talking about Owners costs, Contractor costs or the costs of the Subcontractors and Vendors, the Project Schedule enables to track costs against the plan. To use the information for better cash flow management.
- Procurement - A fully integrated Project schedule includes procurement items, specifically, long lead or critical elements which are necessary to complete the project on time.
- Communications - As the Project Schedule defines the Performance Measurement Baseline, (PMB) if set up realistically and used to the fullest extent, is arguably the single most important document on the project. It can provide management and project team members with an accurate and realistic picture of what is happening on the project and provided the schedule is kept up to date, should provide the information they need to make timely and informed decisions.

- Claims - Unfortunately, in today’s world it seems instead of using the Project schedule to actually help us complete the projects in a realistic time frame, too often the schedule becomes either an offensive or defensive tool, used to either perfect claims by one party against the other as the basis to defend against those claims.
Explained more simply the data generated from a fully cost and resource loaded Project Schedule serves exactly the same function that "patient monitoring devices" in the hospital -
Figure 5 - EKG Health Monitor
Source: Intensive Care Unit Monitors
i.e. to provide “real time” status (communication) of the project not only in terms of time, but also of costs, risks/opportunities, resource utilization and procurement.
This puts the Planner / Scheduler right in the middle of the action and he / she either needs to be working closely with and communicating regularly with cost management, project management and site teams to ensure the schedule is used to the fullest potential.
As we know from Module 3 - Managing Scope, where the WBS is strategized and initiated, the Project Schedule is simply an extension of the WBS that tells us HOW the project team intends to create the deliverables defined by the WBS and WHEN each task in the Work Package is planned to be completed. The graphic below helps to show the relationship betwwen the WBS abd the Schedule:
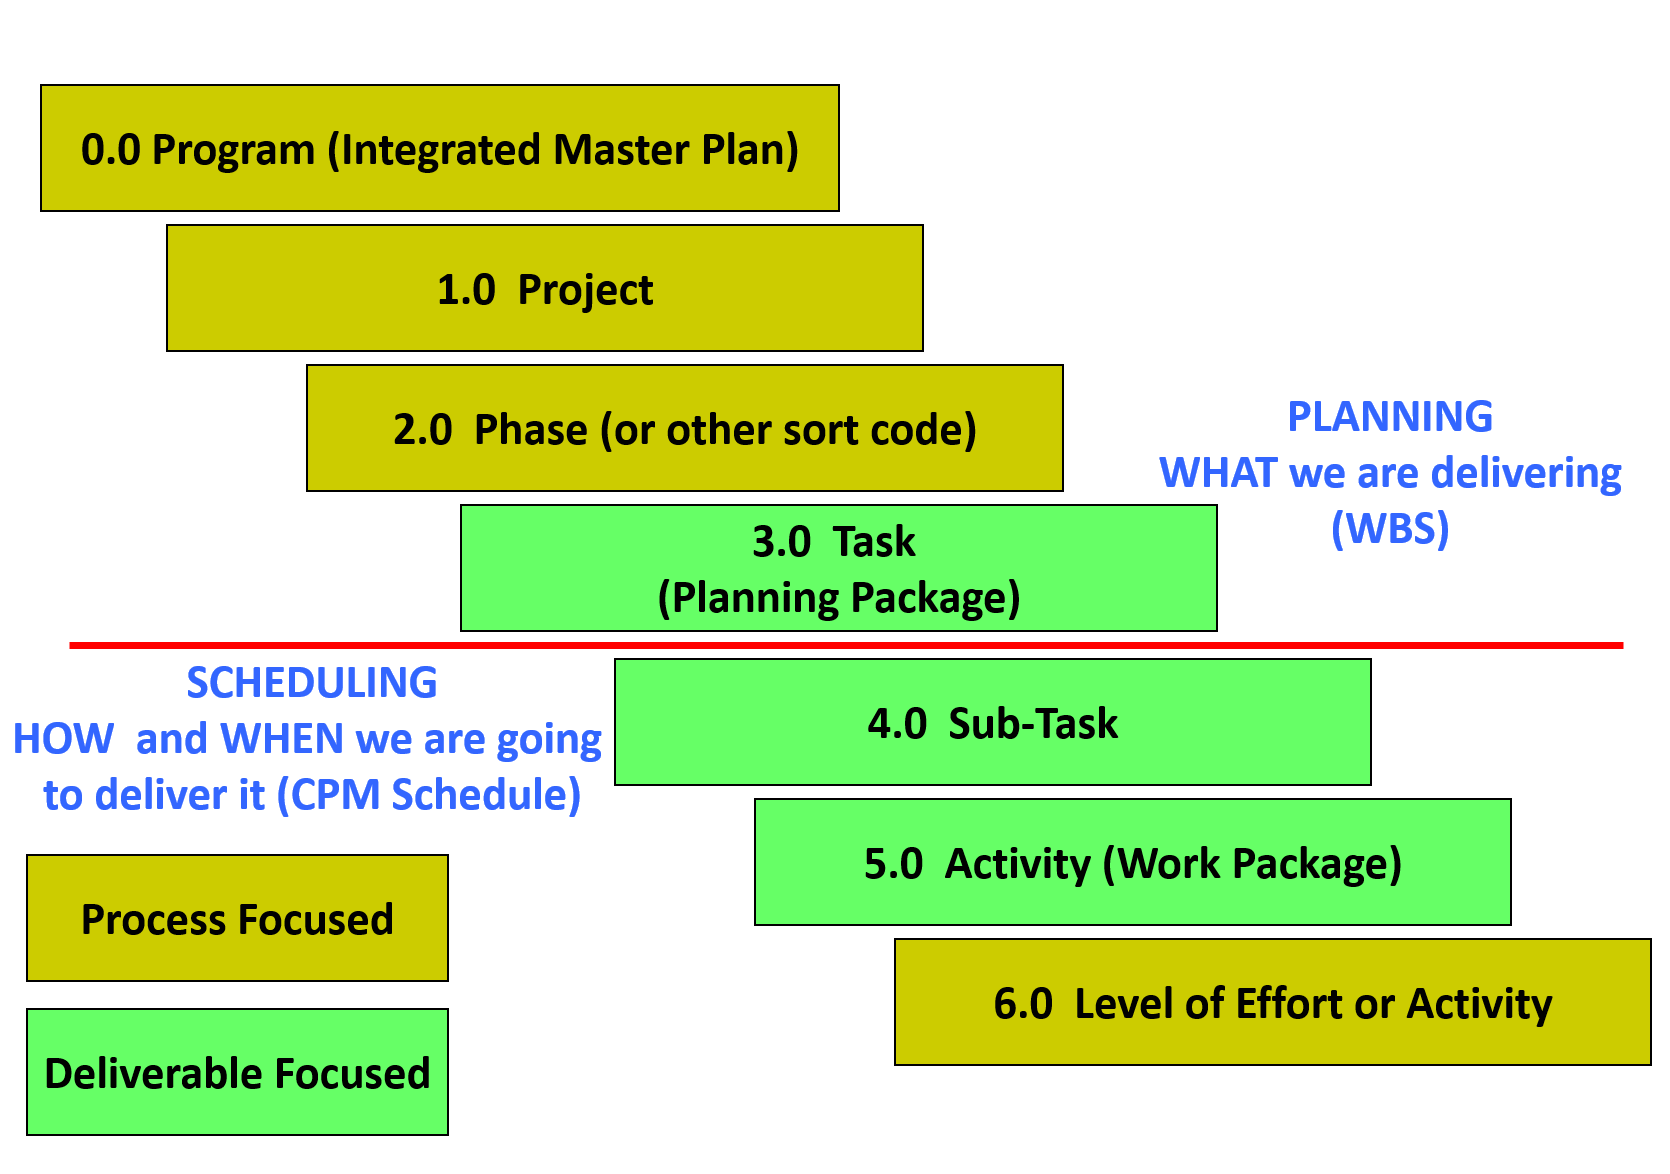
Figure 6 - Relationship between the WBS and the Schedule
Source: Giammalvo, Paul D (2015) Adapted from Project Manager’s Desk Reference, 2nd Edition, Lewis, 2000, pg 91 Contributed Under Creative Commons License BY v 4.0
It is important to remember that the most important objective is to create a schedule which comes as close as possible to modelling what the project team really plans on doing and NOT just what management or the client wants to see.
If we are to have any hopes of reducing the claims and disputes on projects, then one of the first places to start is by creating schedules which are realistic and reasonably achievable given the available resources.
The schedule should include all existing constraints (i.e. time, logic, space, resources, supply, financing, etc.) and only then can it be considered “realistic” and able to help to forecast results and be used to answer any “what if” questions.
It is a mathematical tool that confirms if project targets are achievable or not and demonstrates the optimal way to execute project activities taking into account all existing limitations.
07.1.3.3 - TYPES OF SCHEDULES AND THEIR USES
07.1.3.3.1 - Enterprise Plan / Integrated Master Plan
This is a high level schedule developed and used by both Owners and Contractors which shows all of the projects approved, pending or proposed, often for a period of more than 1 year and often up to as many as 5 years into the future.
- For an Owner it might show all of the projects for a specific business division or unit with in the division
- For a Contractor it would represent the existing projects currently and those projects being bid
This is a strategic tool used by the senior managers from both Owners and Contractor organizations to optimize resource and facilities utilization.
It helps owners develop budgets and to minimize the impact of shutdowns for maintenance and repairs and it helps contractors determine what work to bid and how aggressively they need to be in the marketplace to fill any holes or gaps in order to keep their key people gainfully employed.
For Owners in particular, one of the essential tasks of the Planner / Scheduler or Project Controller when creating an Integrated Master Plan (IMP) is to conduct an analysis to understand if there are any dependencies between any of the projects.
As can be appreciated, if there are dependencies between projects then changes to one project in the portfolio will have impacts on other projects in the portfolio.
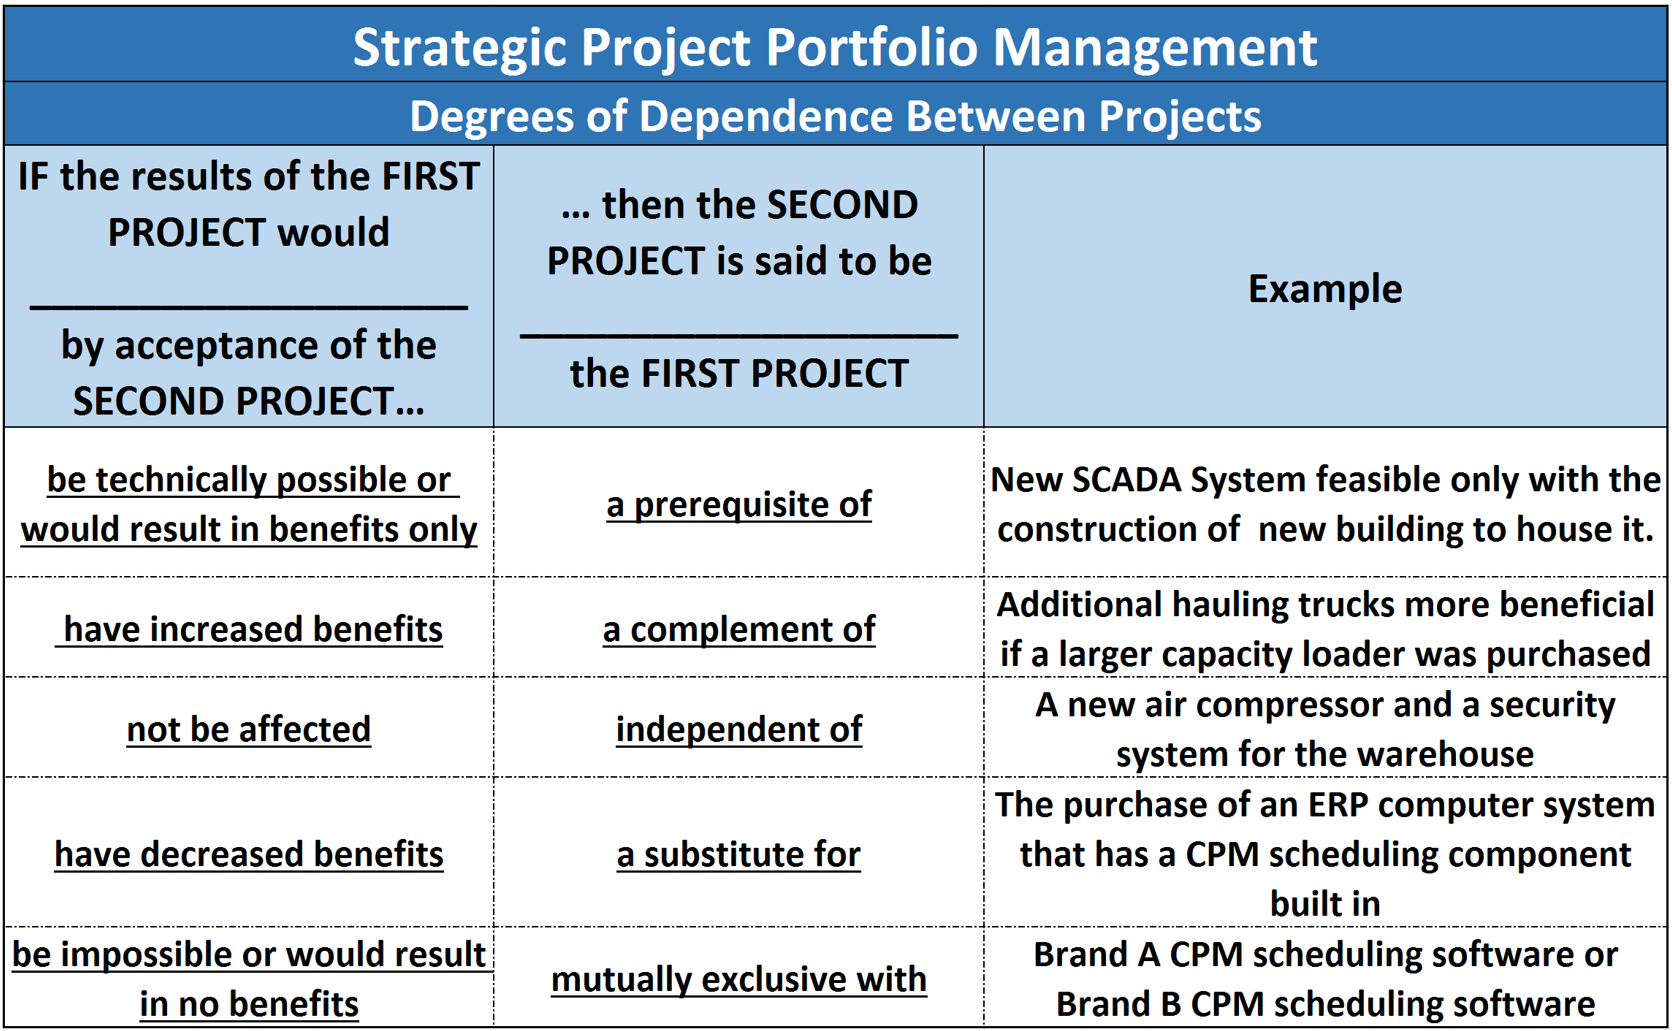
Figure 7 - Degrees of Dependence Between Projects
Source: Sullivan, Wickes & Kroelling (2014) Engineering Economics 15th Edition
This becomes important in the event that a project has to be postponed or delayed for whatever reason there may be follow on impacts if this analysis is not done and the appropriate logical relationship shown and documented in the Master Plan. Explained another way, when working on or using the IMP we treat each project as if it were an activity, except that not all projects will have logic between them.
This is the essence of PROJECT PORTFOLIO MANAGEMENT, which can be explained the centralized management of the processes, methods, and technologies used by managers and Project Management Offices (PMOs) to analyze and collectively manage current or proposed projects (see Module 2 - Managing People for examples of PMO structures).
When companies manage multiple projects in a consistent manner this is often referred to as utilizing an enterprise-level Project Management Office (PMO) so they can implement a single framework to manage, report and analyse projects in a consistent manner. This does however bring with is additional complexities for data management and the integration of cost, finance and scheduling (Enterprise) systems:
- Independently plan, schedule, and control multiple projects and allocate and manage enterprise-wide resources across multiple projects in order to balance resource capacity
- Combine schedule time, cost and resource infomration for overall corporate reporting and planning, and company-wide decision-making at the higher levels of management
- Manage relationships within projects and between different projects
- Divide a large, complex project into smaller projects, making each one more manageable for individual project managers
- Select the right strategic mix of projects to integrate schedule data (e.g. cost, time and resource) with financial management and human resource management systems
Having explained that the concept shown in Figure 7 above is not only a STRATEGIC TOOL but because it is SCALABLE, it can also be applied at the PROJECT level to manage various elements within a large-scale project.
07.1.3.3.2 - Tender / Proposal Schedule
This is the initial schedule to be created by the party or contractor wishing to demonstrate the proposed sequence, methodology and timing of the project.
It is usually accompanied with the method statements and financial proposals when requesting to be awarded the project.
The contractor needs to be careful with these kinds of schedules as they need to be detailed enough to show the potential client that the contractor can do the project within the prescribed time frame but not give away to many of the contractors ideas, methods and market advantages.
This level of schedule normally does not contain any government, owner, subcontractor or vendor activities.
07.1.3.3.3 - Implementation / Integrated Master Schedule
This is also often known as the Construction Schedule, Working Programme, Integrated Project Schedule.
This is a more fully developed version of the Tender or Proposal Schedule issued after contract award showing specifically how the project is to be carried out as it is required to be a model used to demonstrate “project execution”. A robust Implementation / Integrated Master Schedule is not just a snapshot of how the project might be undertaken but should enable the simulation of managerial decisions and effectively forecast all measurable project parameters. Thus the schedule should be able to:
- Demonstrate scope and sequence;
- Forecast project durations;
- Forecast project costs;
- Forecast resource requirements;
- Perform what-if analysis to provide information on expected consequences of control actions.
07.1.3.3.4 - As-Built Schedule
This is a version of the Implementation Schedule that depicts the actual dates of all of the activities contained within the schedule and is usually the final schedule to be produced for a project.
It is often used as the record of events and can be called upon to explain what happened and when it happened in the event of time or cost claims.
07.1.3.4 - LEVELS OF SCHEDULES
The following graphic helps demonstrate the various levels of schedule detail:
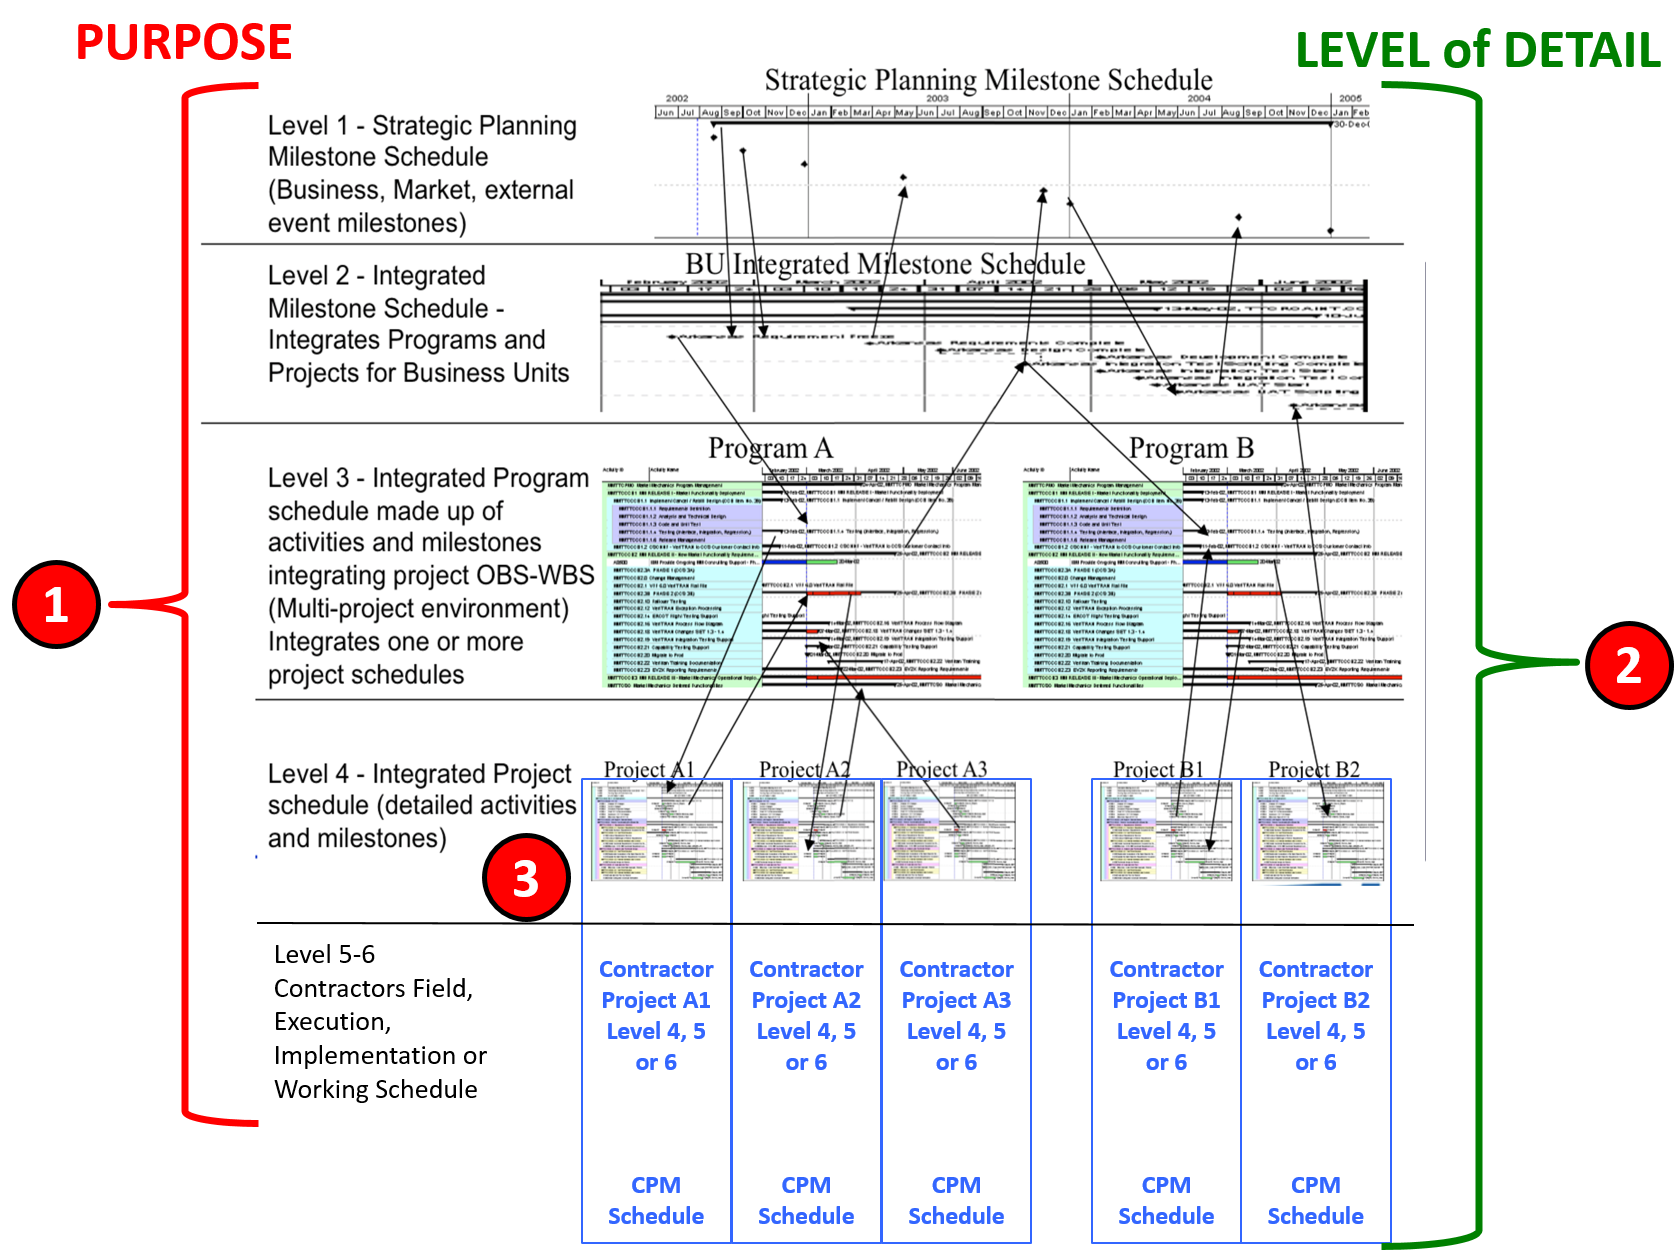
Figure 8 - Levels of Schedule Illustrated
Source: Giammalvo, Paul D (2015) Course Materials. Contributed Under Creative Commons License BY v 4.0
The Levels of Schedule cause considerable confusion as the Owner’s perspective and that of the Contractor (adapted courtesty of Mosaic Projects) are somewhat different.
To help clarify this, there are two parameters, aspects or attributes which determine the Level of a schedule. The first parameter is the PURPOSE (Item 1 and 3 above) the schedule was designed to serve and the second parameter is the LEVEL OF DETAIL (Item 2 above) the schedule contains or is shown. (“rolls up” or “rolls down” to different summary levels).
07.1.3.4.1 - OWNERS Perspective
07.1.3.4.1.1 - Level 1 Schedule: Strategic Planning Milestone Schedule
WHAT - Is used by Owner’s top management to look longer term at the entire portfolio of potential and approved projects. For the Owner this includes funded projects, usually looking out 1, 2 and 5 years or sometimes more. It focuses on the potential project from the business strategic perspective.
WHEN - Is prepared during Phase 1 and is included in the Decision Support Package for Phases 1 to obtain approval to move on to Phase 2
WHO - Is prepared by the Owners project controls department, project support services or PMO for use by the “senior management” responsible to establish long term strategy for the organization.
07.1.3.4.1.2 - Level 2 Schedule: Integrated Milestone Schedule
WHAT – This is used by second and third tier managers (“Directors” or “General Managers”) as the basis to plan and allocate their budgets. At this level of detail the focus is on what process or major pieces of equipment will be needed for this project. For petrochemical projects this schedule often includes Conceptual, Pre-FEED or Front End Engineering and Design (FEED). For architectural projects, this includes Conceptual, Schematic or Criteria Design.
WHEN - Is prepared during Phase 2 and is included in the Decision Support Package for Phases 2 to obtain approval to move on to Phase 3 .
WHO - This level is prepared by the Owner’s project controls department, project support services or PMO OR sometimes by outside consultants, for use by Asset Managers (CAPEX funded) and Operations Managers (OPEX funded) projects but it could also be sorted by individual business units.
07.1.3.4.1.3 - Level 3 Schedule: Integrated Programme Schedule
WHAT - this schedule contains a much greater level of detail for the owner and for oil, gas and mining projects is usually broken down into these activities “Permitting, Front End Engineering & Design (FEED), Detailed Engineering and Design, Procurement, Construction, Testing and Commissioning” or for architectural projects these activities “Predesign, Schematic Design, Design Development, Construction Documents, Agency Permit, Bidding, Construction, Closeout” This is the MINIMUM level of detail that an owner should be providing to a Contractor in the form of scope definition (WBS) and contractual delivery dates. Often included in this phase is the ordering of long lead items. During this phase, the procurement of any “owner supplied” equipment is initiated.
WHEN - Is prepared during Phase 3 and is included in the Decision Support Package for Phases 3 to obtain approval to move on to Phase 4.
WHO - This level is prepared by the Owner’s project controls department, project support services or PMO OR sometimes by outside consultants, for use by Engineering working together with procurement departments. If this project is to be bid using the traditional Design>Bid>Build approach (firm fixed price contract) this is when the legal department and engineering develop the technical specifications and contract documents. If this contract is being awarded as an “Engineer, Procurement, Construct and Commission” (EPCC) or “Design>Build" basis this is when the contractor comes on board and his/her project control team works with the Owners project control team to create the Integrated Master Schedule.
07.1.3.4.1.4 - Level 4 Schedule: Integrated Project Schedule
WHAT - This is the ideal or optimum or preferred level of detail that an Owner should be providing to the Contractor both in terms of scope definition (WBS) and contractual completion dates, either final or interim. This is the COMMON LEVEL where the Contractor’s and Owner’s schedules are identical and are merged or updated for progress (earned value) billings and change order. Explained another way this is most often the “handover” or “interface” between the owner’s project control team and the contractor’s project control team.
WHEN - This schedule is issued after the project has obtained funding and approval to execute the project.
WHO - If this project is being awarded using the traditional “Design>Bid>Build method, this level of schedule determines the contractual completion dates.
07.1.3.4.2 - CONTRACTORS Perspective
07.1.3.4.2.1 - Level 1 Schedule: Executive Summary
Also often referred to as Project Master Schedule (PMS)
WHAT - This is a major milestone type of schedule; usually only one page, it highlights major project activities, milestones, and key deliverables for the whole project. It is used to summarise the project schedule in reports and other documents when a more detailed schedule is not required. The Contractor often creates this by summarising and / or filtering data contained within more detailed schedules.
WHEN - Frequently developed by the ‘client’ as part of its initial feasibility studies for the project and then maintained by the contractor; may be used to assist in the decision making process (go/no-go, prioritization and determining the criticality of projects). Can be used to integrate multiple contractors / multiple project schedules into an overall program schedule.
WHO - Audiences for this schedule Level include, but are not limited to client, senior executives and general managers. If included with a bid and/or the Contract, demonstrates conformance to contractual and other milestones.
07.1.3.4.2.2 - Level 2 Schedule: Management Summary
Also often referred to as Summary Master Schedule
WHAT - Maintained as a summarisation of the Level 3 Project Coordination Schedule(s). It depicts the overall project broken down into its major components by area and is used for higher-level management reporting. The Contractor often creates this by summarising and / or filtering data contained within more detailed schedules.
WHEN - Frequently developed by the ‘client’ as part of its commitment planning for the project and then maintained by the contractor. Can also be used to integrate multiple contractors / multiple project schedules for the overall control of a program. It will include the Level 1 information expanded to show activities by area or major item of capital equipment. Should demonstrate the driving path for structures and major process systems at the CSI Division Level (e.g., Earthwork, Foundations, Framing, Enclosure, MEP Services and Process Equipment), based on the project method statement.
WHO - Audiences for this type of schedule include, but are not limited to general managers, sponsors, and programme or project managers.
07.1.3.4.2.3 - Level 3 Schedule: Project Coordination Schedule
Also often referred to as Publication Schedule
WHAT - Initially developed as an integrated CPM overview of the project, the Level 3 schedule is then maintained as an integrated rollup or summary of more detailed schedule activities for reporting status to senior management and to report monthly status to major clients, etc.
WHEN - Usually developed by the ‘main contractor’ as part of its tendering process for the project or by the project team during the initial phases of planning. The Level 3 schedule spans the whole of the project and is used to support the monthly report. It includes all major milestones, major elements of design, engineering, procurement, construction, testing, commissioning and/or start-up. If the Level 4 schedules are primarily developed by trade/sub-contractors, during the initial phases of the project the Level 3 schedule provides the schedule framework and constraints used by the subcontractors to develop their tenders. During the execution phase of the project this schedule defines the overall critical path and is the primary coordination tool for the overall project.
WHO - Audiences for this type of schedule include, but are not limited to program or project managers, CMs or owner’s representatives, superintendents, and general foremen
07.1.3.4.2.4 - Level 4 Schedule: Implementation Schedule
Also often referred to as Execution Schedule, Working Programme, Construction Programme, Project Working Level Schedule
WHAT - Level 4 is the detailed working level schedule, where each schedule is an expansion of part of a Level 3 schedule, and is established within the integrated project schedule. This is the key working level CPM schedule displaying the activities to be accomplished by the project workforce and is required for every project. The dates generated by the schedule activities represent the anticipated start and completion of work required to complete the project. If there is no ‘Level 3’ schedule, activities in future months/years may be summary in nature but still provide approximate start and completion dates for major pieces of work (this is called ‘rolling wave scheduling’).
WHEN - Developed by the ‘contractor’, ‘subcontractor’ (trade contractor), or the project team prior to commencing work on the project execution, or work in a phase or area of the project. The Level 4 schedule may be for the whole of the project or a part of the project depending on the size of the project and complexity of the work. A critical factor is keeping each ‘Level 4’ schedule to a sensible size that can be easily managed, updated, validated, etc. ‘Level 4’ schedules may be for major sections of the work or for discrete processes such as a ‘Design Schedule’, ‘Procurement schedule’ and/or a ‘Commissioning Schedule’. Generally, the ‘Level 4’ schedule represents the area of authority of a section manager or engineer, so one manager is responsible for all of the work in the schedule. Activities are generally over a week in duration (depending on the nature of the project) and should be resource loaded at least in the near term and include detailed crew movements and other means and methods to ensure viability. Where used, short term ‘look ahead’ are produced from this level; typically ‘Three Week Look-ahead’ schedules are updated every two weeks.
WHO - Audiences for this type of schedule include but are not limited to project managers, superintendents, and general foremen.
07.1.3.4.2.5 - Level 5-6 Schedule: Detailed Schedule
Also often referred to as Working Programme, Construction Programme, Project Working Level Schedule.
This is also the Owner’s Level 5-6 Scedule for work done by their own forces or for interface work where the Owner and Contractor have to hand over deliverables as in testing and commissioning schedules.
WHAT - The further breakdown of the activities of a Level 4 Schedule. A short term schedule used to map out the detailed tasks needed to coordinate day to day work in a specific areas.
WHEN - Level 5 schedules are developed by workforce supervisors to plan and coordinate their work at the detail level; workarounds and critical areas can be exploded here. Typically Bar Charts (Gantt Charts), the schedules are replaced every 1, 2 or 4 weeks depending on the complexity of the work, typically schedules extend for 1 or 2 weeks beyond the date when the replacement is due (eg a ‘weekly schedule’ will extend for 2 weeks and be updated/replaced each week), this encourages continuity of working.
WHO - Audiences for this type of schedule include but are not limited to superintendents, team leaders, crew leaders, general foremen, foremen and sub-foremen.
07.1.3.5 - SCHEDULING METHODS and SCHEDULE VIEWS
07.1.3.5.1 - Arrow Diagram or Activity-on-Arrow Method
The Arrow Diagram Method (ADM) is the pictorial representation of the plan which shows the inter-relationships and inter-dependencies of the component tasks. It is sometimes known as a ‘logic diagram’ or ‘arrow diagram’ and was developed by James Kelley and Morgan Walker in 1957 as the first computerized scheduling tool.
The two elements of an arrow diagram are directional lines (or arrows) each representing one activity, and circles or nodes representing the logic. The nodes represent the points at which activities start and finish and thus have no duration, whilst the directional lines (or arrows) represent the work activities being carried out.
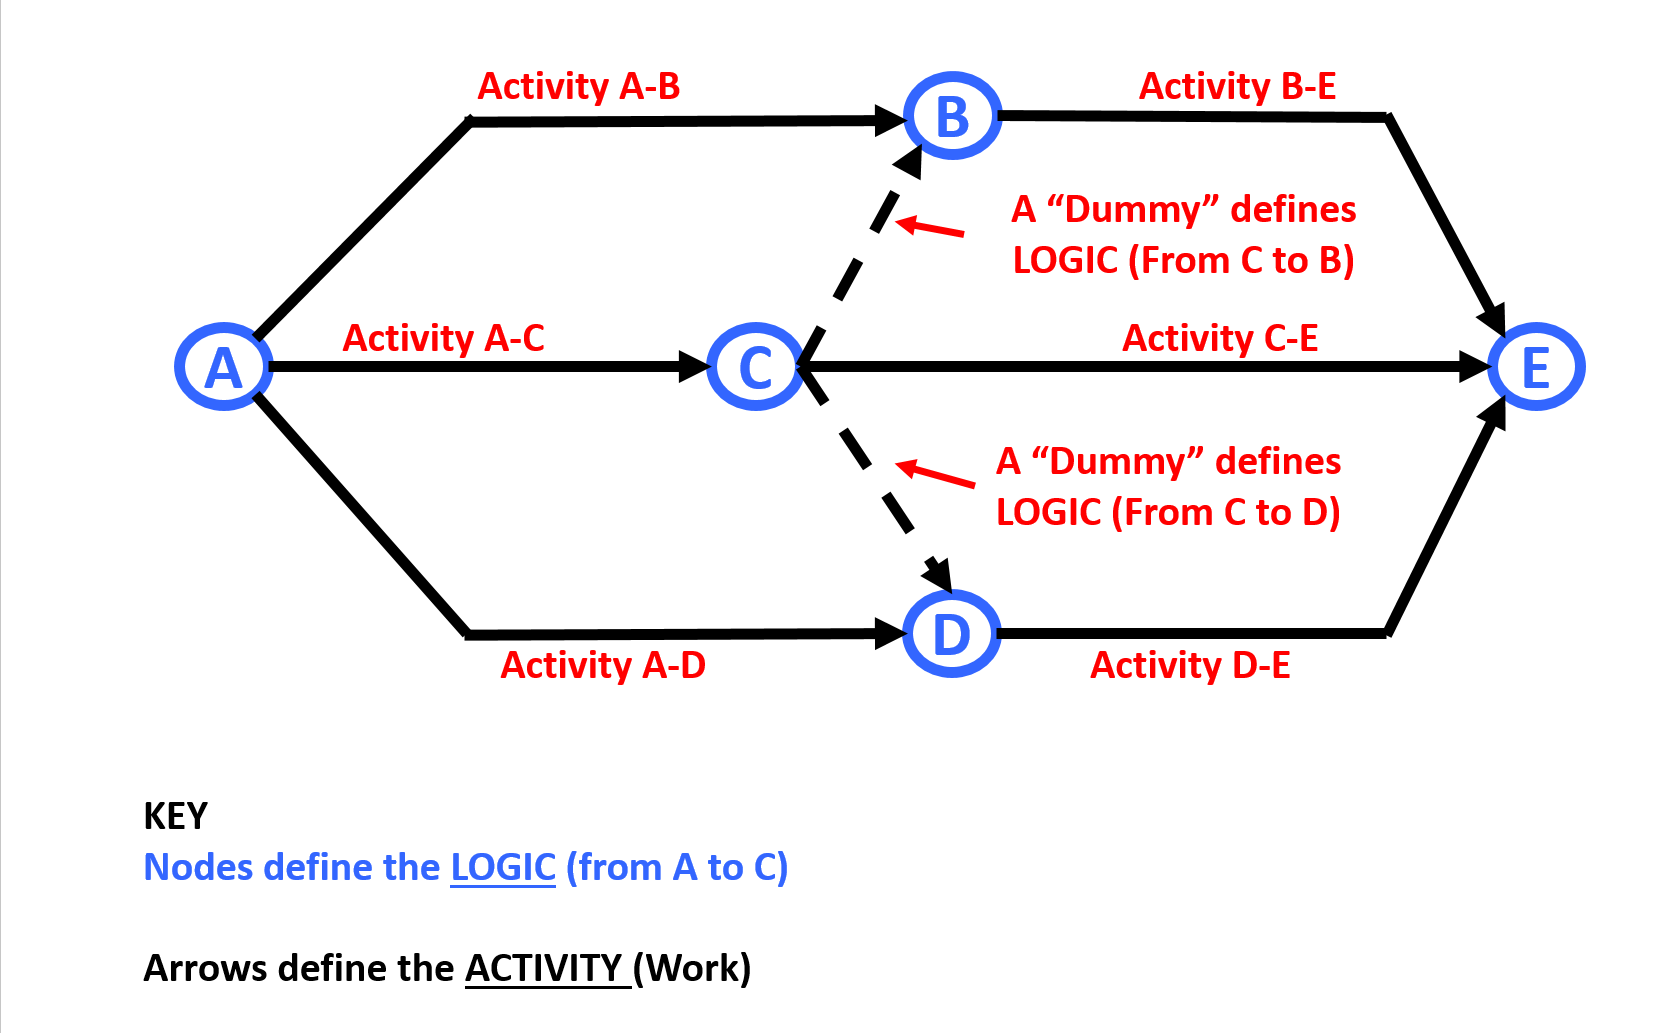
Figure 9 - The Arrow Diagram Network
Source: Giammalvo, Paul D (2015) Course Materials. Contributed Under Creative Commons License BY v 4.0
The Arrow Diagram Network s also contain ‘dummy’ activities. A dummy activity is represented by the dotted lines and represents a logical link between network paths (i.e. C:D and C:B rather than an actual task to be performed and is normally indicated by a broken line as opposed to a solid line representing the physical task. Explained another way, while the solid arrows represent actual work, the dotted lines indicate only logic but without any activity or work associated with them.
The node name comes from the logic for Activity A as being A:B, Activity B being A:C and Activity C being A:D etc. The method (ADM) is also known as Activity-on-Arrow or AoA method.
The Arrow Diagramming method is not popular today because:
- It only allows for Finish to Start relationships, thus limiting the ability to reflect realistically how work will progress, and:
- It tends to result in many more activities than does the Precedence Diagramming Method (PDM) or Activity on Node (AoN) and many of the software packages have shifted to the Precedence Diagramming method (PDM).
07.1.3.5.2 - Precedence Diagram or Activity on Node Method
In the Precedence Diagram Method (PDM) the work or activities is represented by the use of boxes, (sometimes referred to as nodes- as in “Activity on Node” Method), to represent scope (or activities) and inter-connecting relationships (with arrows) that show their dependencies or logic flow.
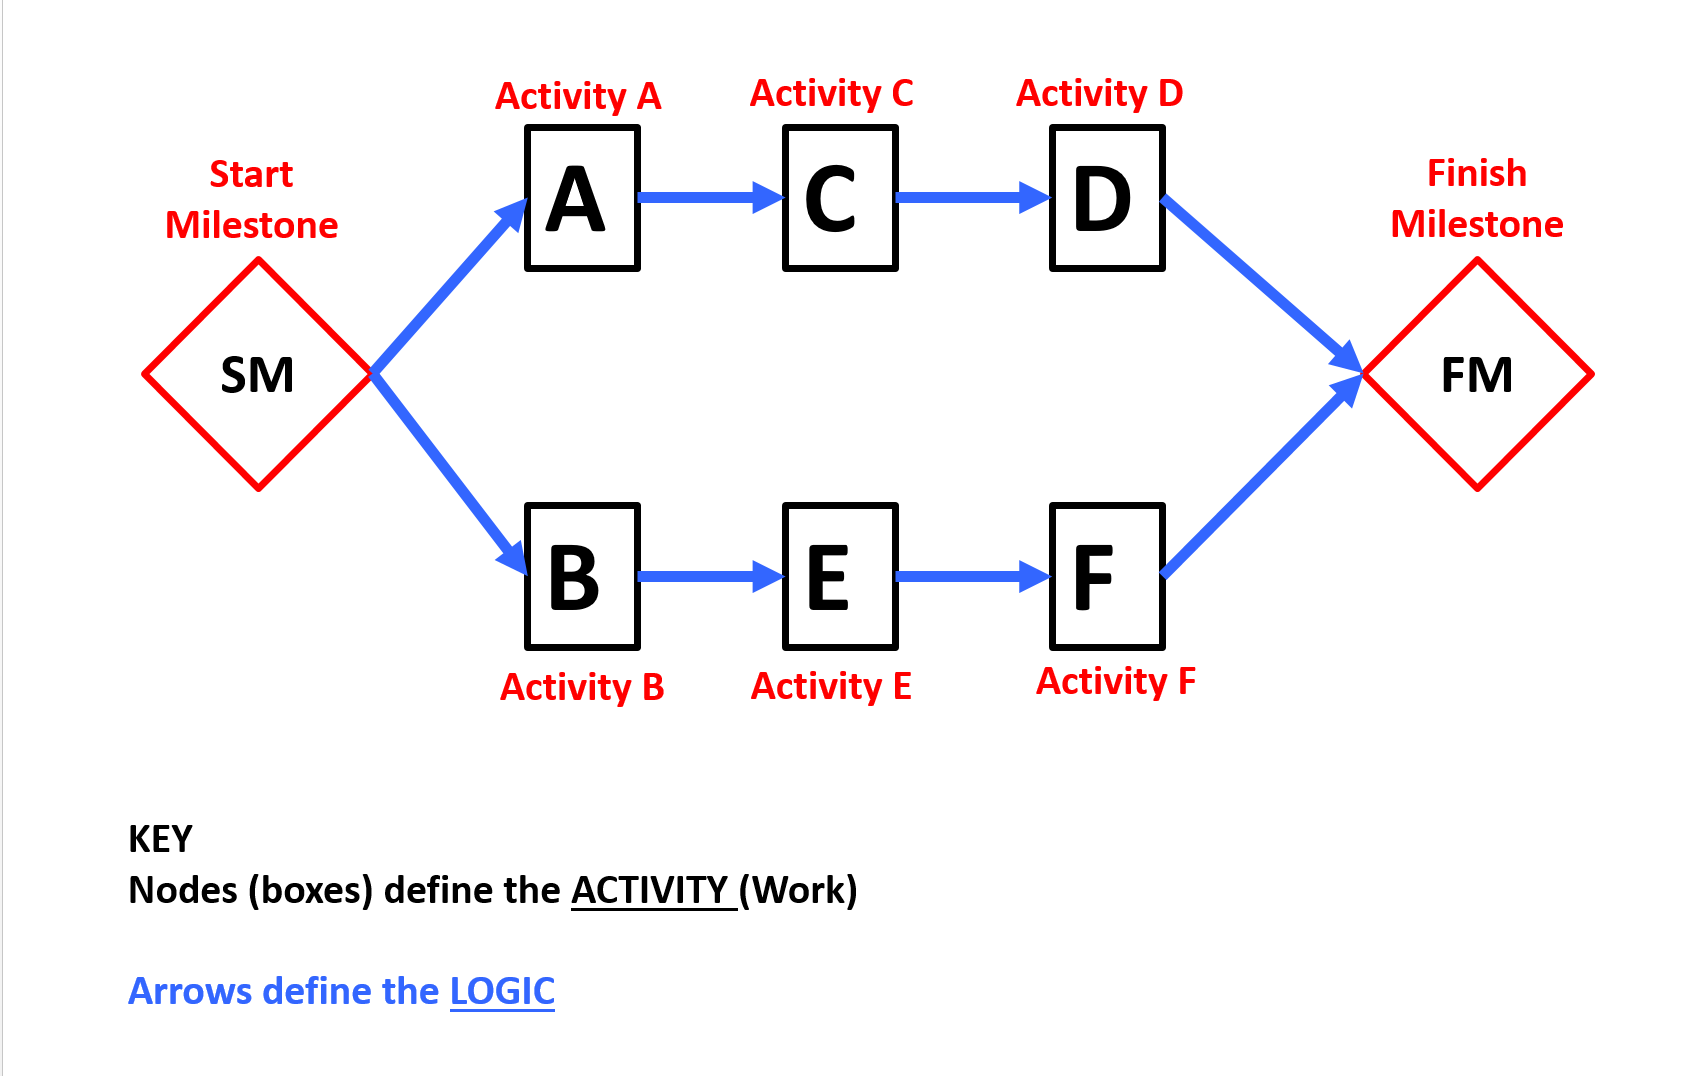
Figure 10 - The Precedence Diagram or Activity on Node Method
Source: Giammalvo, Paul D (2015) Course Materials. Contributed Under Creative Commons License BY v 4.0
This is the method used today by most software packages as Precedence Diagramming (PDM) offers two very distinct advantages over ADM:
- It can show a more realistic flow of work because in addition to offering only Finish to Start logic relationships, PDM allows us to use Start to Start, Finish to Finish and Finish to Start logic relationships.
- PDM generally results in fewer activities than does ADM because PDM offers us Start to Start and Finish to Finish logic rather than having to break each activity down into smaller activities.
Many of the “older” practitioner tend to prefer ADM over PDM because the use of Start to Start and Finish to Finish enables Contractors in particular to play games with the schedules, a topic which will be covered in Module 12- Managing Project Forensic Analysis.
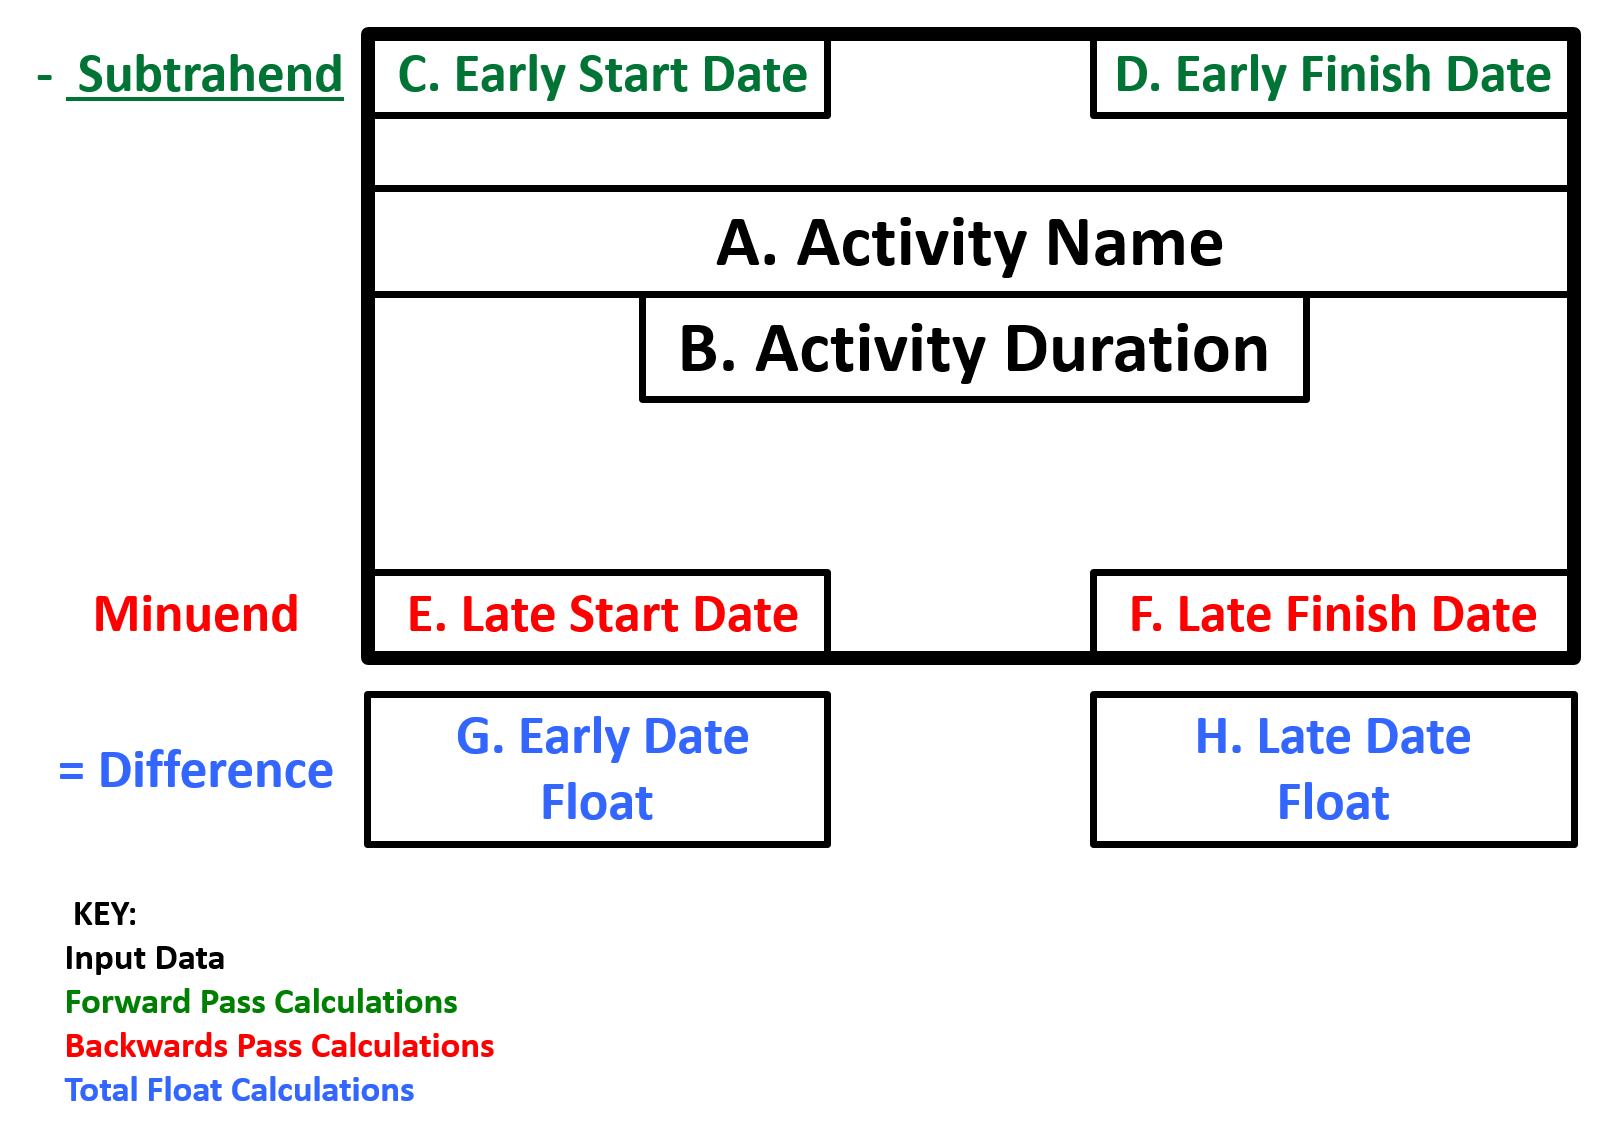
Figure 11 - The Activity Node
Source: Giammalvo, Paul D (2015) Course Materials. Contributed Under Creative Commons License BY v 4.0
When we examine an activity node, we can see the types of information provided and where it is often (but not always) located. Of particular interest is that for no other reason than it was common practice for the US Navy to put early dates on the top of their schedules, Professor Fondahl, when he created the PDM method, continued with the practice of putting the early dates on the top of the boxes and the late dates on the bottom. Now, while this technically contravenes standard mathematical convention, having the early dates on the top is considered acceptable practice.
The use and application of the formula to calculate Total Float will be covered in future modules, in particular Module 9 - Managing Project Progress and Module 12 - Managing Project Forensic Analysis.
07.1.3.5.3 - Critical Path Method
The Critical Path Method (CPM) is used to derive the critical activities - that is, activities that cannot be delayed without delaying the end date of the project schedule.
- The amount of time an activity can slip before the project or program’s end date is affected is known as “total float.”
- Critical activities have the least amount of float and, therefore, any delay in them generally causes the same amount of delay in the project or program’s end date.
- Activities with little total float are called “near-critical” activities, because they can quickly become critical if their small amount of total float is used up in a delay.
Management must closely monitor critical and near-critical activities. The general “rule of thumb” we use is that any activity with Total Float equal to or less than the reporting period is considered to be “near critical. For example:
- If you are reporting weekly, then any activity that has greater than 0 but less than or equal to 7 days would be considered “near critical”.
- If you are reporting monthly, then any activity with less than 30 calendar days or 22 work days would be considered “near critical”.
Another powerful and useful tool / technique we can use Total Float for and that is to PRIORITIZE activities based on their total float which determines which activities are more IMPORTANT and the need date, which determines how urgent they are.
07.1.3.5.4 - Bar or Gantt Chart vs. Time Scaled Logic Diagrams vs. Pure Logic Diagram
The earliest types of schedules are the Bar Chart or “Gantt Chart”:
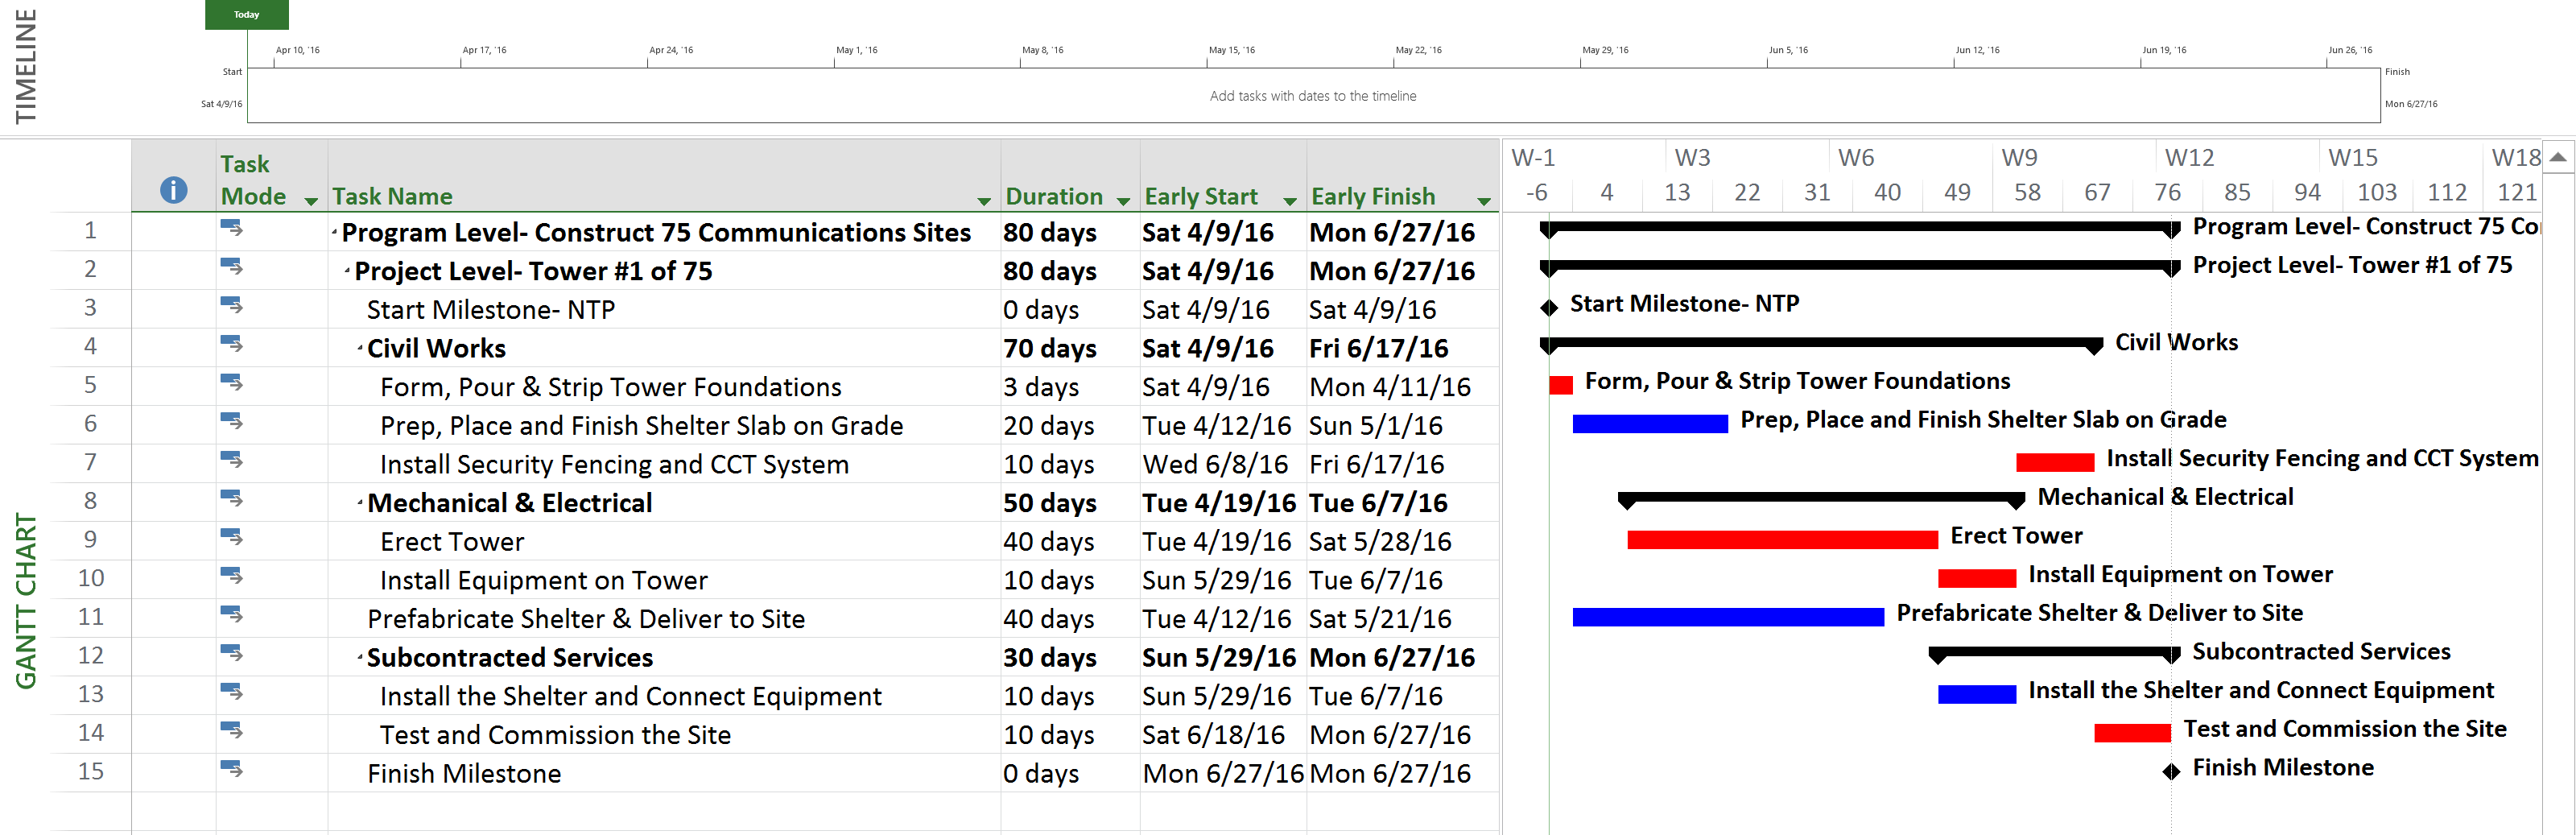
Figure 12 -Example of a Bar or Gantt Chart
Source: Giammalvo, Paul D (2015) Course Materials. Contributed Under Creative Commons License BY v 4.0
Using a Bar Chart or Gantt Chart we do NOT show logic links, only the bars. This is often used to compare actual progress against a baseline and is often used for management reporting, in particular to compare planned starts and finishes vs actual start and finishes.
In a Bar or Gantt Chart, while the logic is usually there, (unless created manually) it has been turned off. The reason being, when you have large or complicated schedules, the lines tend to obscure the point you are trying to make and in many instances causes more confusion and distracts from the presentation.
The diagram below indicates the same network but this time is presented in what is known as a Time Scaled Logic Diagram. Notice that the only change which has been made is to turn on the logic links. Otherwise, the durations, start and finish dates and critical path remain identical.
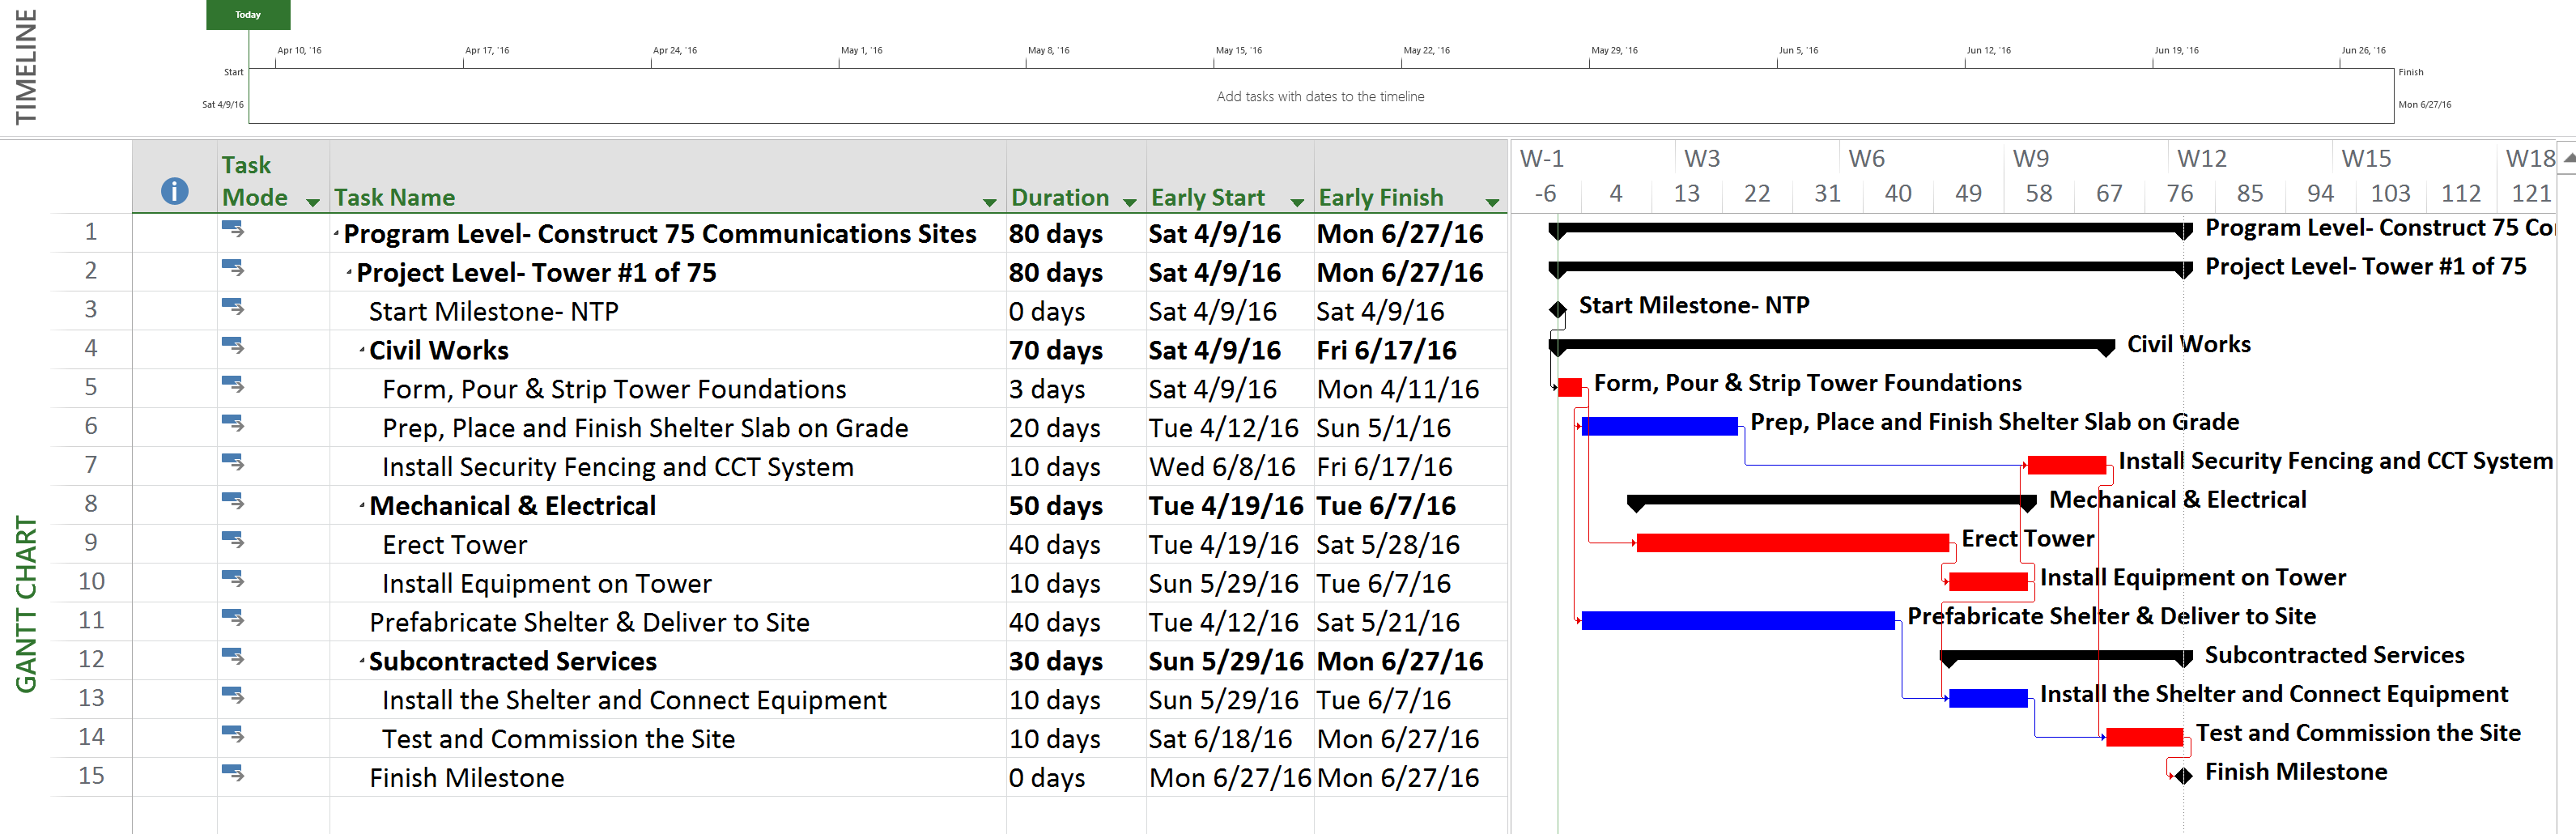
Figure 13 - Example of a Time Scaled Logic Diagram
Source: Giammalvo, Paul D (2015) Course Materials. Contributed Under Creative Commons License BY v 4.0
While the Time Scaled Logic Diagram is the most common view, for presentation to those who don’t understand scheduling, the logic links are often more of a distraction than a help, particularly if the logic is extensive or complicated.
And here is the same sample schedule but this time shown as what is known as a Pure Logic Diagram or Network Diagram view:
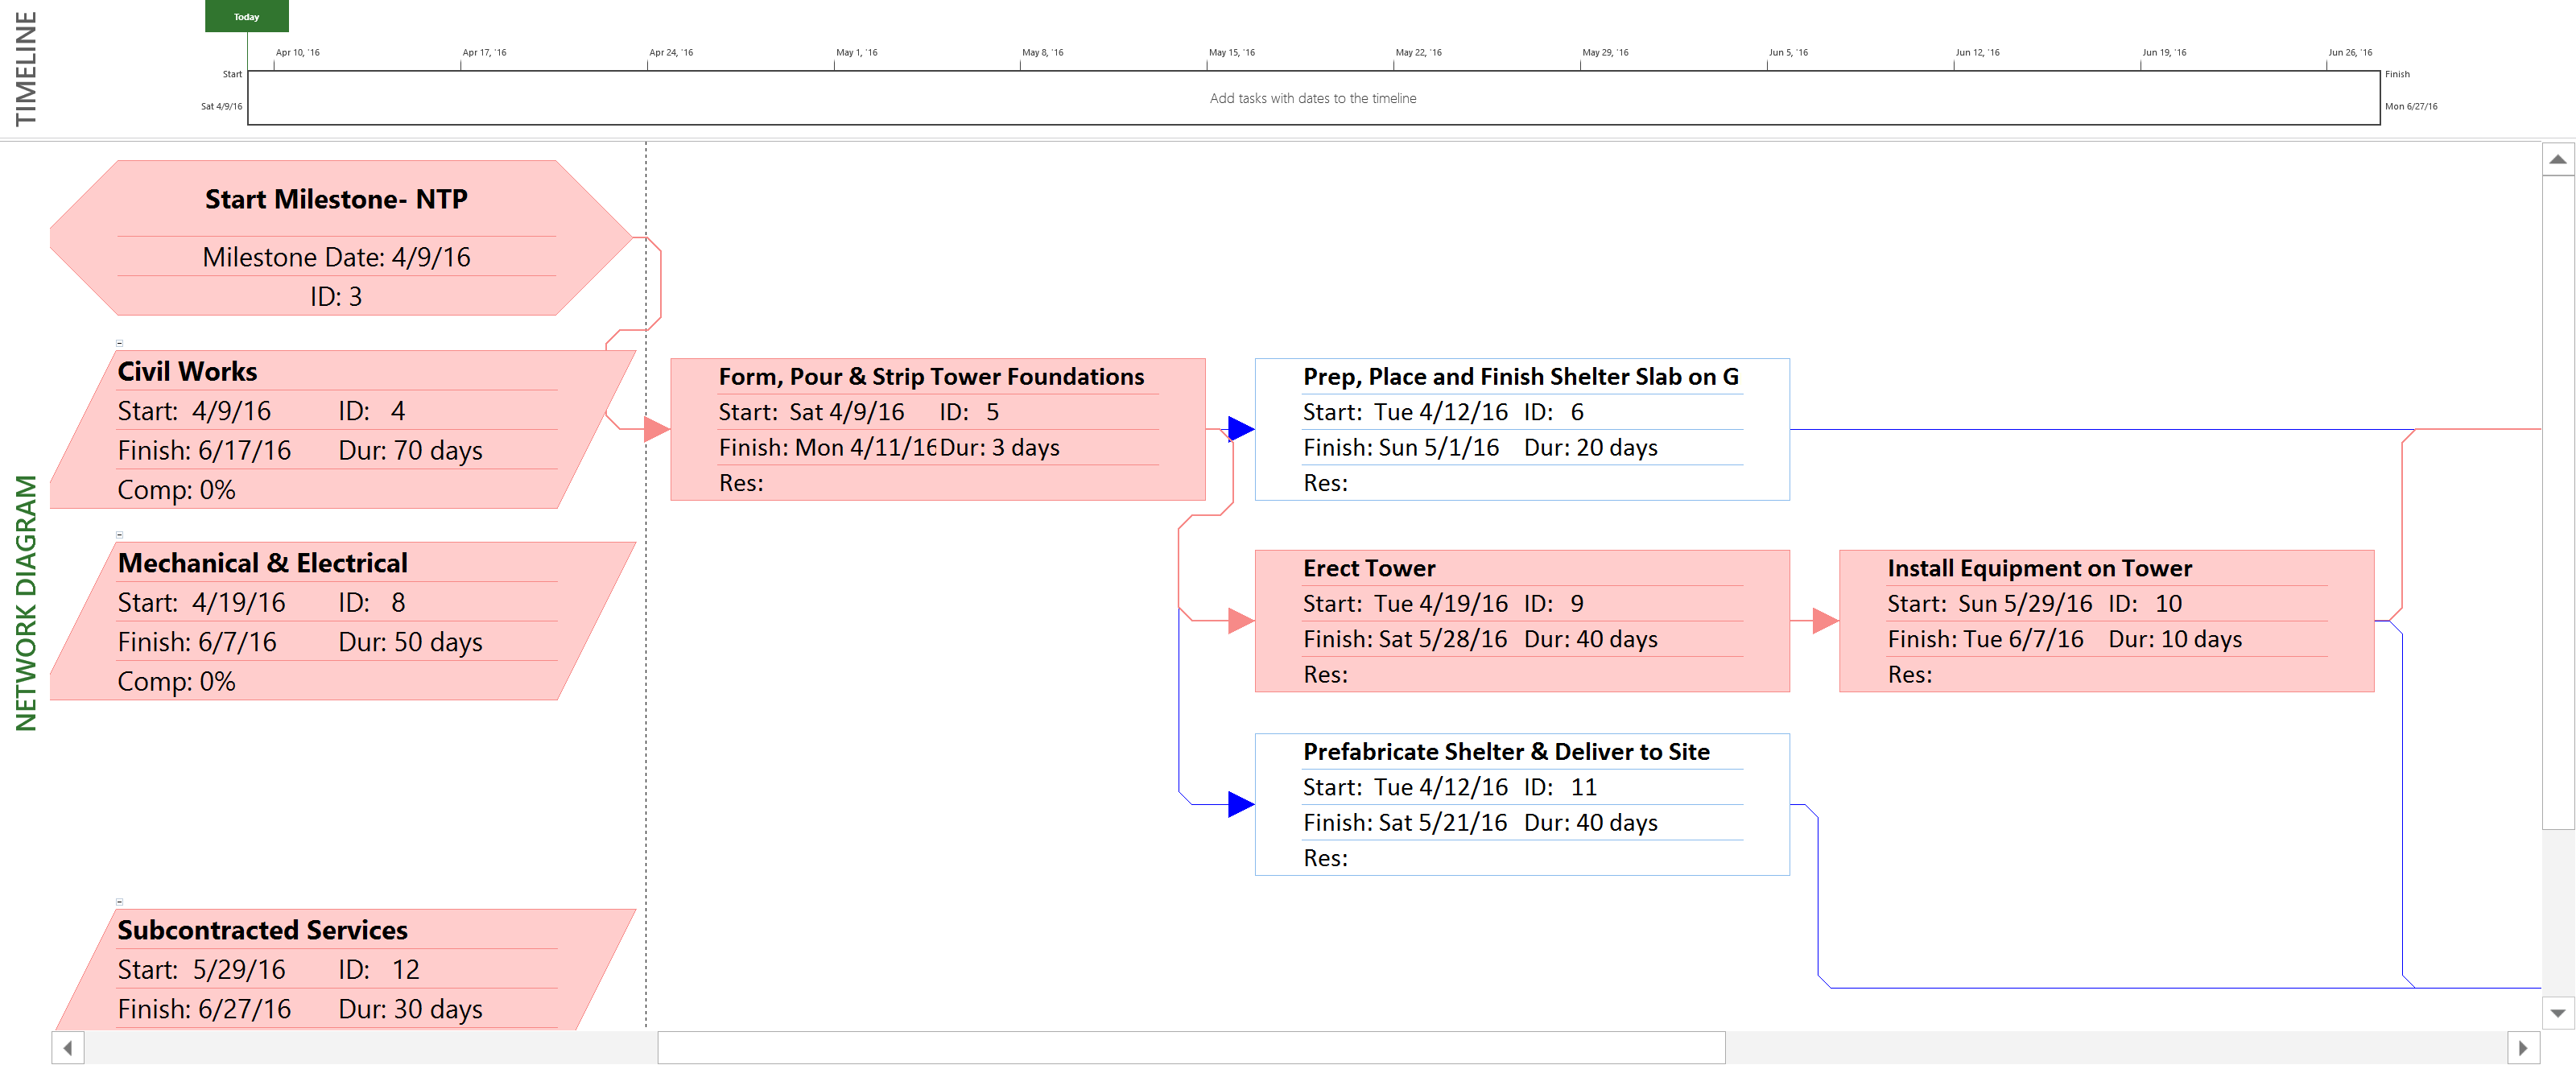
Figure 14 - Example of a Pure Logic or Network Diagram View
Source: Giammalvo, Paul D (2015) Course Materials. Contributed Under Creative Commons License BY v 4.0
7.1.3.5.5 - Line of Balance / Velocity Diagram Method
The concept of the Line of Balance (LOB) technique (also referred to as Velocity Diagram) is to have a greater understanding and control of production rates (outputs) between various trades such that resource levels can be balanced and wastage (such as ‘standing time’ between trades) can be kept to a minimum.
It is also sometimes referred to as a ‘lean construction’ technique and is useful when repetitive cycles of activities are required such as high rise construction.
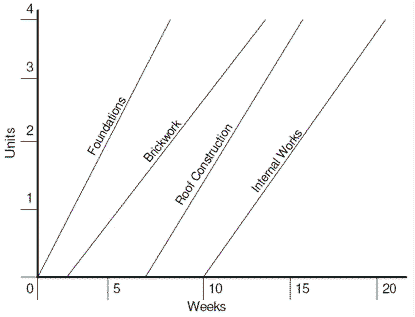
Figure 15 - Example of a Line of Balance / Velocity Diagram
Source: Application of Line of Balance Scheduling (LOBS)
Using the LOB technique, if the plan of the main contractor is to have an overall output rate of one floor per week then each necessary subcontractor will balance its own resources to also achieve a one floor per week. As can be seen above the production rate of the brickwork gang is slightly lower than that of its predecessor or successor but is still balanced sufficiently within the two so as not to delay the overall works.
This a very powerful scheduling tool/technique and is especially useful whenever we are doing work which is repetitive in nature, as each floor in a multi-story hotel or in constructing the same model of house in a large development. Other examples include constructing well pads for oil and gas production or the construction of telecommunications cell sites. This method tends not to get used as much as it could or should.
7.1.3.5.6 - Linear Time & Location Method
The technique of Time-Distance planning is mainly used for linear projects such as roads, rail, pipeline, trams, bridges, tunnelling, electrical power cabling, etc. Such charts are also known as Time-Chainage plans, Time-Location diagrams and March Charts.
The activities of a linear project are plotted on a grid where one axis is the time-scale and the other axis is the distance-scale and diagrams of the project (scans of maps, landscape cross-sections, etc.) are often included across the distance axis of the diagram to help orientate the reader to where physical attributes are located.
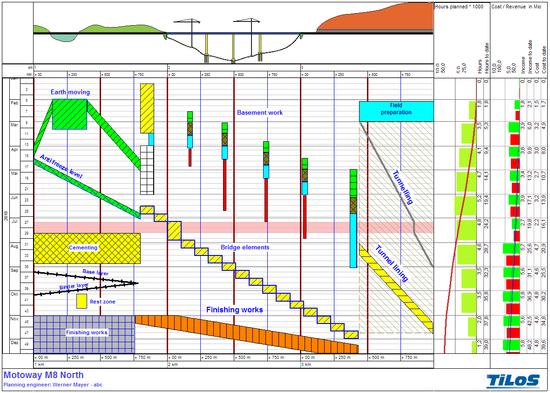
Figure 16 - Example of a Linear Time & Location Diagram
Source: Tilos (n.d.) TILOS Linear Project
Shapes are also used to represent activities and they have a special significance by adding activity attributes in a Time-Distance coordinated system.
Rectangles are used to show static activities that occupy a set distance for a period – e.g.: a bridge, level crossing, station, caisson, shaft, etc. The rectangles have different colours and fill patterns to distinguish the type of operation.
Parallelograms are often used to reflect linear activities where the work-face is moving through distance (like installation of power lines or the laying of rail), but where there is a reason to reserve the work-space around the position where the work is progressing.
Time-distance plans can be drawn in a graphics or spreadsheet package or can be created with specialty software that allows the plan to share all the same attributes as a standard precedence network with logic links, resources, and durations in order to allow a full critical path analysis. When considering a linear plan the scheduler needs to think of the logic as being distance-lead / lag driving the activities rather than being time lead / lag driven. Time-location charts may also be just another way of presenting a project schedule which has been created and calculated using one of the other methods described here.
7.1.3.5.7 - Rolling Wave or Schedule Density Method
As the graphic below indicates, “rolling wave planning” is a common sense practice that says to us while we may have goals and objective target dates, there is no way any of us can tell with absolute certainty what we will be doing exactly a year from today. However, it is much more likely that we can tell exactly what we will be doing next week or maybe even next month.
Applying this concept to scheduling, and knowing that our schedules are mapped against the level of detail contained in our WBS, we can get some idea of the level of detail generally considered appropriate for each timeframe.
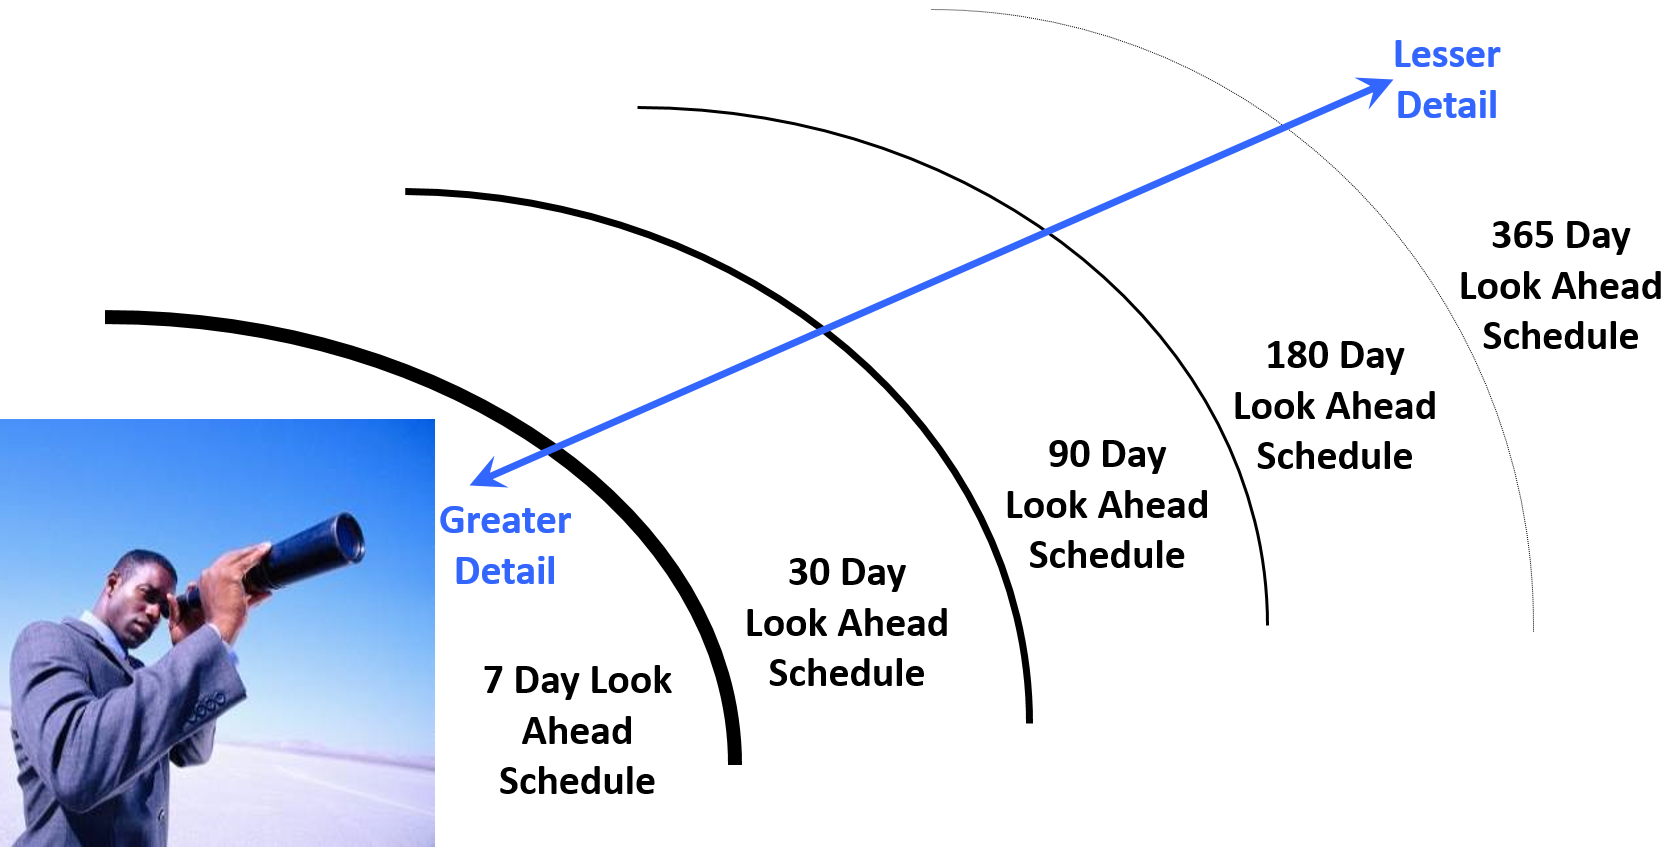
Figure 17 - “Rolling Wave Planning” Illustrated
Source: Giammalvo, Paul D (2015) Course Materials. Contributed Under Creative Commons License BY v 4.0
As we know from earlier discussions, a Level 6 Schedule is often known as a “1 Week Back-3 Week Look Ahead” schedule which is also known as a “Moving Window” schedule. This is the most common schedule used by field superintendents and trade foremen to determine exactly which crews are going to be working on which activities. At this level of schedule is where the planner/scheduler needs to make certain that engineering and procurement match up to the schedule need dates for each activity.
Unles the scope of work is fully designed and all subcontractors are on board before any work on site starts it is very unlikely that the planner / scheduler, or even the project team for that matter, can create an accurate plan for works occuring far into the future. The "density" of the schedule changes such that certain and known / iminent work is planned in detail while other, less understood work, is planned in less detail / lower density; i.e. a process of Progressive Elaboration.
If we look back to the Module on Contracts, we can see that one of the leading causes of lost productivity on a project is because of the workers having to wait for drawings or materials or equipment. This is an area where schedulers can really make a difference and add value by helping to make certain that the drawings are ready and that the materials are available before any activities start.
It is important to note that because one of the primary or most important objectives of a CPM schedule is to generate the early and late date “S Curves” or Performance Measurement Baseline (PMB) it requires that for both owner and contractor that every single activity be cost (resource) loaded. Implicit in this, especially for large schedules, that “rolling wave planning” be used to avoid having to produce Level 5 or 6 activities far into the future. Explained another way, for large schedules containing 5,000, 10,000 or more activities, while each and every activity should be cost/resource loaded, by changing the level of detail from greater to lesser the further into the future we get, enables us to generate accurate S Curves (both owner and contractor) without having to cost load each activity down to Level 4, 5 or 6.
7.1.3.5.8 - Building Information Modelling Method
Building Information Modelling (BIM) is the process of generating and managing building data during its life cycle.

Typically it uses three-dimensional, real-time, dynamic building modelling software to increase productivity in building design and construction, Figure 18 - 3D Laser Scanning right Source: Giammalvo, Paul D (2015) Course Materials. Contributed Under Creative Commons License BY v 4.0
The process produces the Building Information Model which encompasses building geometry, spatial relationships, geographic information, and quantities and properties of building components.
While most commonly used for new or “greenfield” projects, with the addition of laser generated “as built” drawings, BIM is increasingly being used for remodelling, expansions or “brownfield” projects.
The intersection of BIM and Planning and Scheduling is in the use of "4D Modelling".
The “4D Model”is the alignment of the 3D elements of the BIM model of a building with the schedule to provide the allocation of durations together with the sequencing of erection / installation.
These elements, typically through the use of an independent software package, are mapped so that each activity in the schedule can use the appropriate BIM object or objects in a visual display of planned performance.
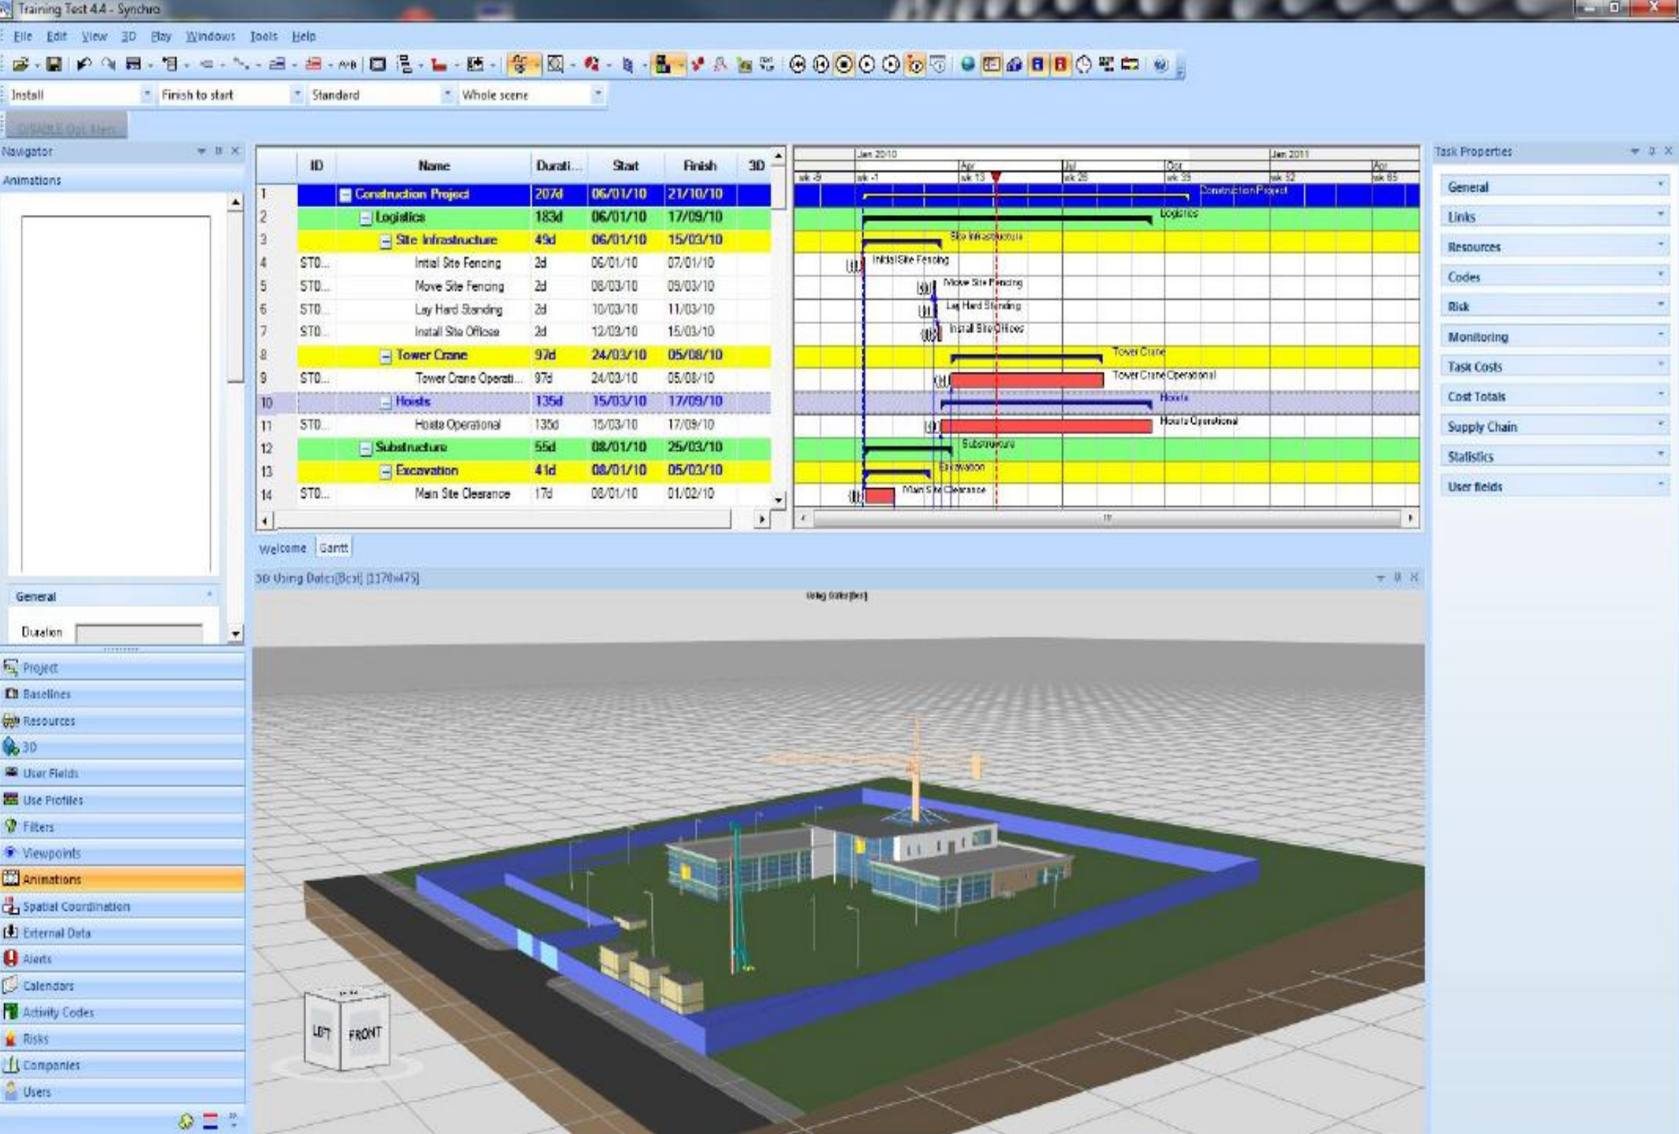
Figure 19 - Illustrating 3D BIM linked to CPM Schedule (4D BIM)
Source: Giammalvo, Paul D (2015) Course Materials. Contributed Under Creative Commons License BY v 4.0
As the software is improved in the ease of use, particularly in the ease of splitting objects to gain the same level of detail as the schedule, this technology will become more and more integrated into the planning and scheduling operations.
Use of 4D modelling will allow a movie of the project plan to be developed, with direct viewing of the scheduled progress. Often this will point out errors in planning, particularly with access to the project for various needs. An example of this is discovering that the mechanical room was designed with equipment that is too large to go through the door or to follow the required path to the room yet the room is planned to complete prior the planned delivery date for the equipment.
The ability to analyse the as-planned or baseline schedule is greatly enhanced by a 4D model that allows the project management team to graphically view the planned progress of the project, emphasizing sequencing and concurrent work opportunities to improve the plan. The planning and scheduling world will need to stay in the forefront of this technology to take advantage of the power of 3D modelling and the correlation with the schedule or programme.
BIM is changing the way construction is managed. In essence, it is the process of linking a 3D CAD model to a construction schedule, creating a time based model of the construction sequence. However, Building Information Modelling (BIM) can be taken further than simply linking the CPM Schedule to the project design drawings to produce 4D BIM as it can be extended to 5D BIM by integrating the Cost Estimating data and in some cases even further by integrating other elements such as Risk Simulation software databases to form 6D BIM etc.
7.1.3.5.9 - Correlation of WBS Detail, Schedule Detail and Cost Estimate Detail
Here is an area where concepts are generally understood and agreed to but naming conventions are not. As most owner organization’s use some form “staged” or “Phase Gate” approach to move from one stage of a project to another, the Guild is advocating that the schedules being produced at the various stages of the Project Life Span should match those shown below.
For example, for the contractor in the “Execute” stage (Phase 5), the schedule should ideally be created down to the Level 5-6 and similarly when the project is at the “Identify” stage (Phase 1) a Level 1 schedule would suffice:
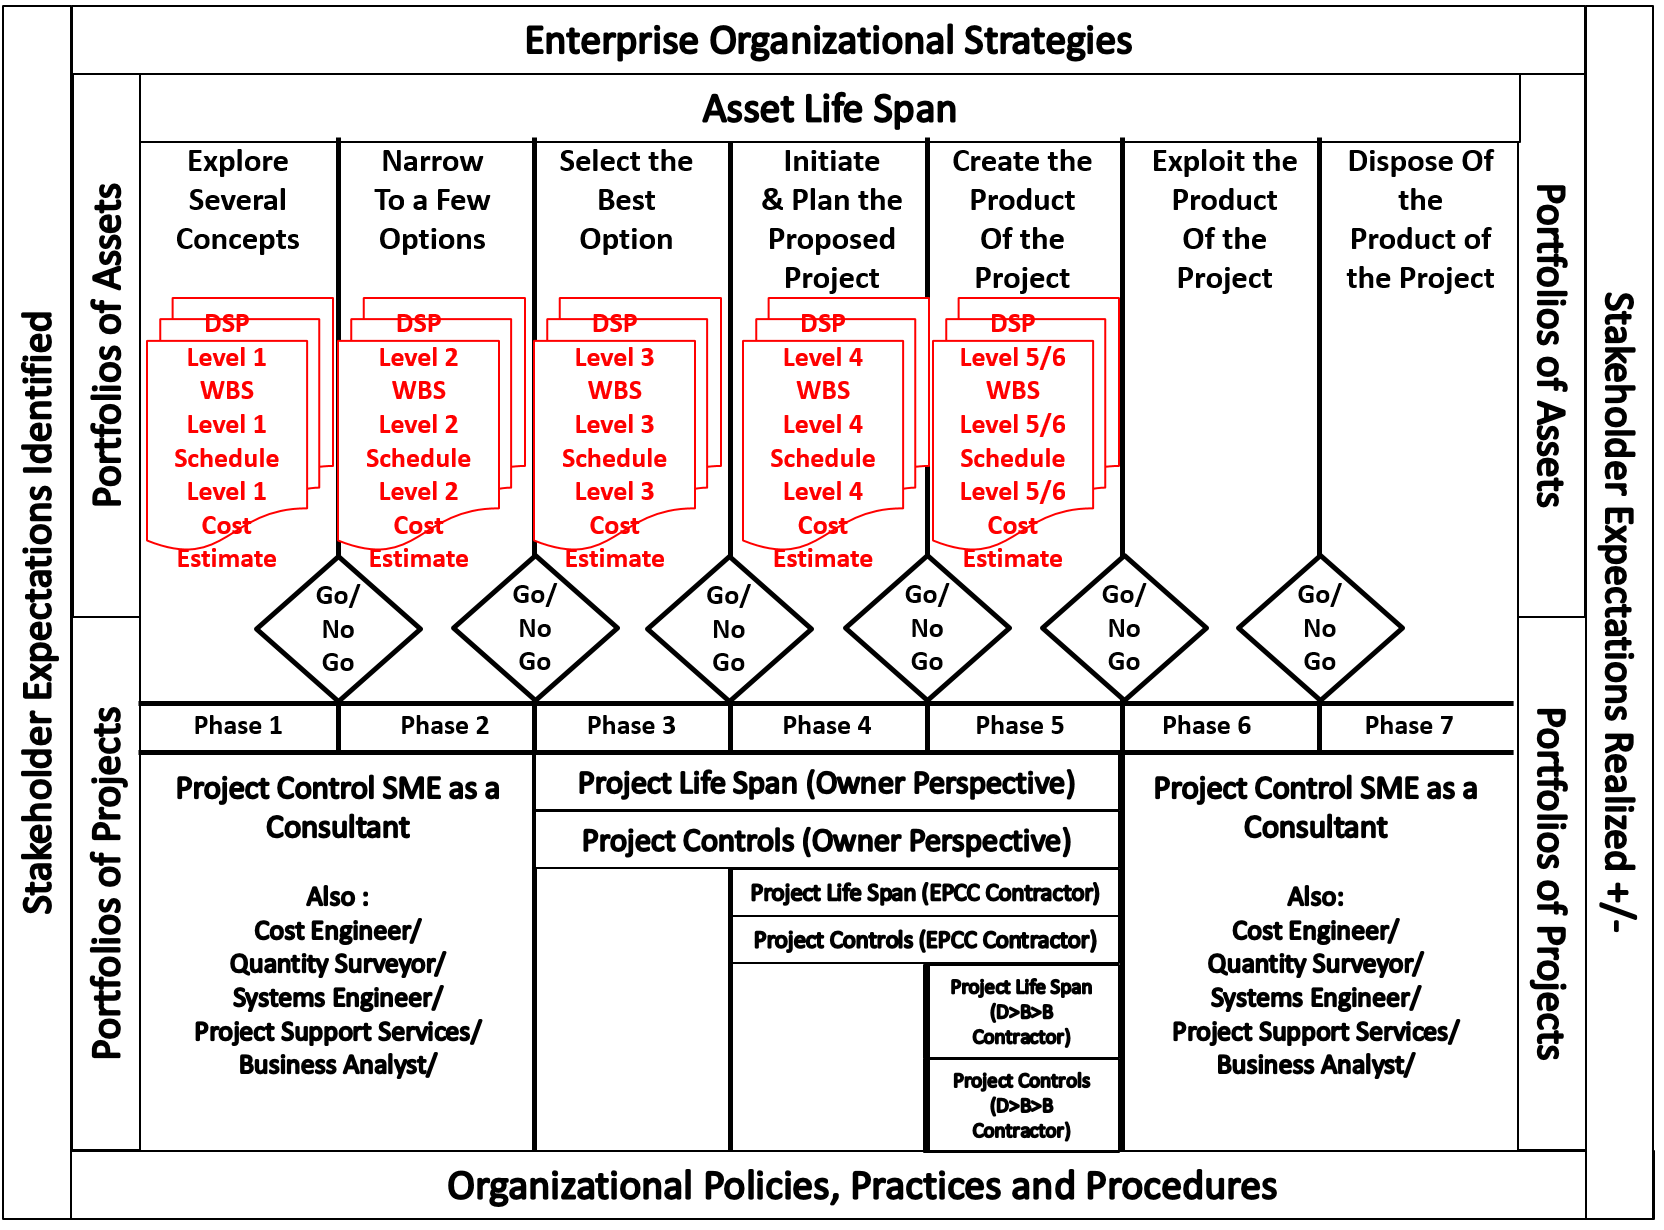
Figure 20 - Roles and Responsibilities mapped against the Phase Gate Process
Source: Giammalvo, Paul D (2015) Course Materials. Contributed Under Creative Commons License BY v 4.0
Given that the Guild of Project Controls is attempting to satisfy the needs of both OWNERS and CONTRACTORS, in Figure 15 above, we are demonstrating from the OWNER’S perspective, what the WBS, Schedule and Cost Estimating Levels need to be developed and included in each Decision Support Package (DSP) as we move from one phase to another.
Figure 21 below, when combined with the high level Asset and Project Life span development graphic above, helps to explain how we can use the Omniclass Table 22, Work Results (CSI’s Masterformat) as the “checklist” to ensure that our WBS contains the elements at the appropriate level of detail as the project evolves and becomes progressively elaborated as it passes each phase gate approval. For those Owner organizations beset by numerous change requests, if you were to take a more structured approach, using a standardized WBS (such as Omniclass or Norzok Z-014) as your scope checklist, you could reduce the number of change orders coming from your contractors AND you would receive bids which fall within a much smaller range, because the less your Contractors have to guess or "assume" what it is you want, the lower the amount of contingency they have to include in their bids.
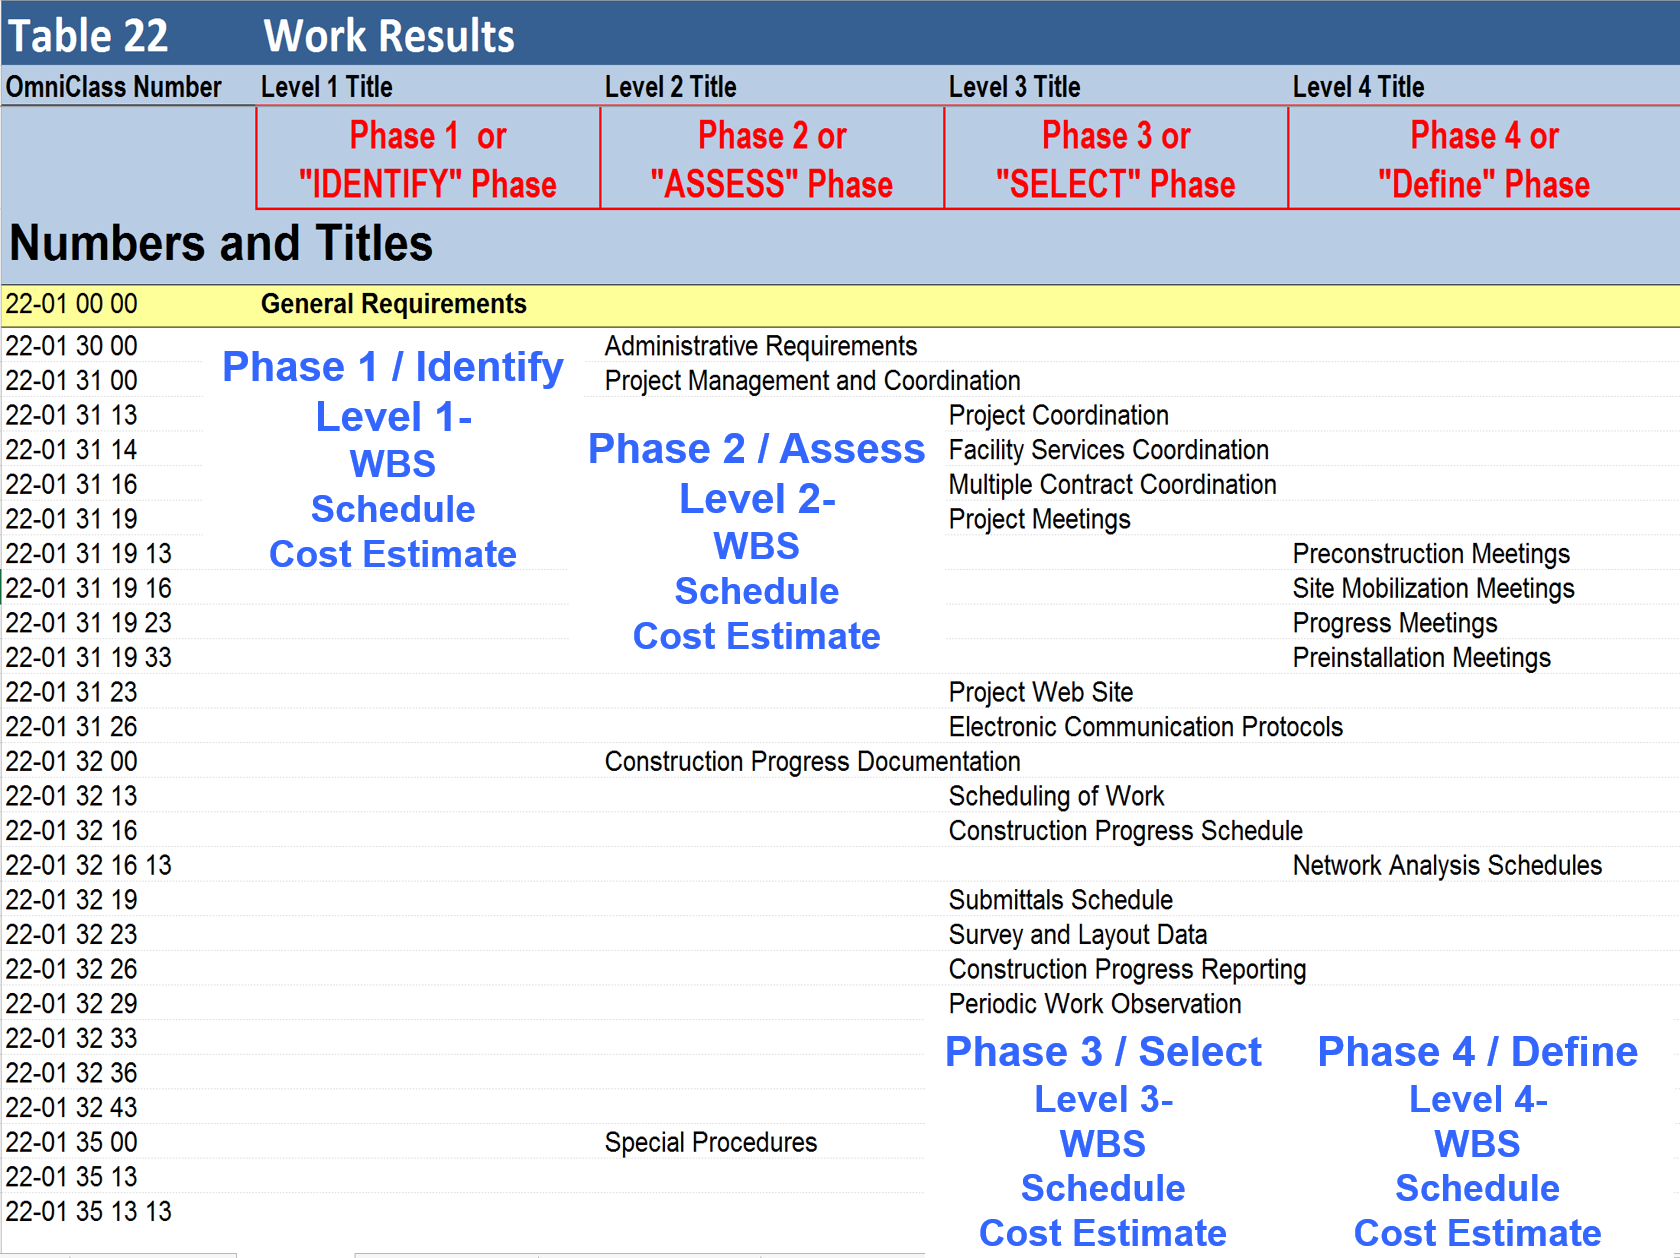
Figure 21 - Showing the PROPOSED numbering conventions mapped against Omniclass Table 22- Work Results
Source: Omniclass Tables (n.d.)
To summarize with Building Information Modelling driving the early design process, and most owner organizations using a phase gate approach, the Guild is advocating that we strive to adopt the following convention:
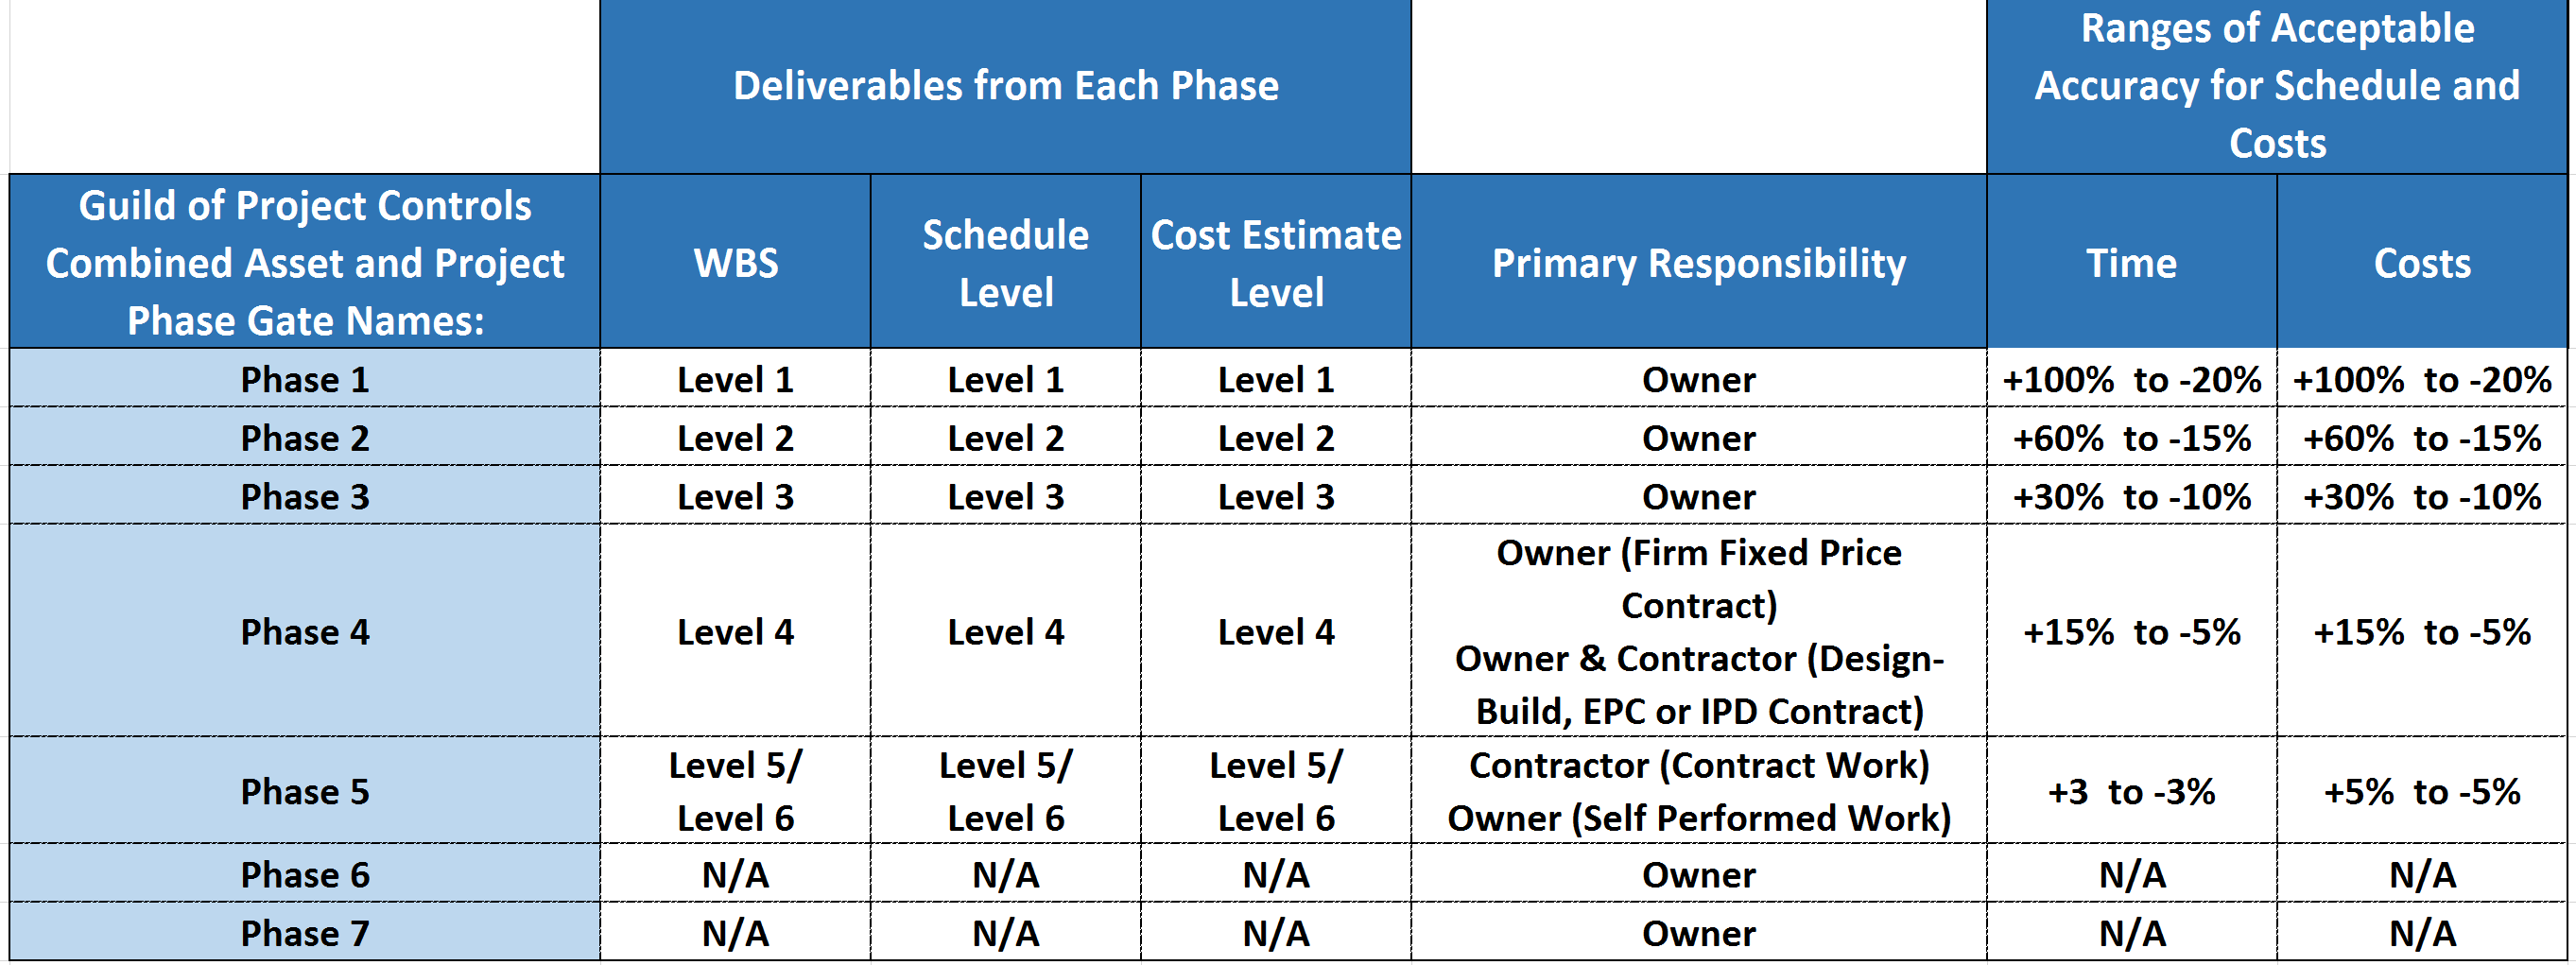
Figure 22 - Summarized WBS, Schedule and Cost Estimate Classification Naming Convention
Source: Guild of Project Controls
Taking this approach, we are consistent with our naming conventions for all and we are using the AACE range estimates as published in the DoE Cost Estimating Guide. Lacking comparable data for scheduling range estimating, we are adopting the same range estimates as those used for costs but this topic is important and is worthy of further research.
07.2 - Module 07-2 - Develop the Planning & Scheduling Policies & Procedures Manual
07.3 - Module 07-3 - Identify / Capture all Schedule Activities
07.4 - Module 07-4 - Create the Logical Relationships & Sequence Activities
07.5 - Module 07-5 - Assigning Resources to all Activities
07.6 - Module 07-6 - Calculate the Duration of Each Activity
07.7 - Module 07-7 - Calculating Float & the Critical Path
07.8 - Module 07-8 - Validate the Critical Path & Completion Dates
07.9 - Module 07-9 - Validate Horizontal and Vertical Integration
07.10 - Module 07-10 - Conducting a Schedule Risk Analysis
07.11 - Module 07-11 - Baselining & Communicating the Schedule
GPCCAR M07-1, Revision 1.03