08.0 - MANAGING COST ESTIMATING & BUDGETING
08.1 - MODULE 08-1 INTRODUCTION TO MANAGING COST ESTIMATING & BUDGETING
08.1.1 - WHAT IS THE PURPOSE OF MANAGING COST ESTIMATING & BUDGETING
The purpose of the Managing Cost Estimating and Budgeting Module is to introduce the tools, techniques and methodologies associated with cost estimating and budgeting that have been identified as being “best tested and proven” practices and which have been found to work on “most projects, most of the time”; provide a logical or rationale sequence showing when those tools or techniques would normally and customarily be used and in selected instances, show how to use those tools/techniques and/or where to find additional information on how to use or apply them.
A “Cost Estimate” is defined by our standard Business Dictionary reference to be “An approximation of the probable cost of a product, program, or project, computed on the basis of available information.” While “Cost Budget” is defined to be a “Financial plan prepared for every major expense category, such as administrative cost, financing cost, or production cost".
To put these two definitions in context, cost estimating is the process to produce an “educated guess” of what a program, project, work package or activity will cost at some point in the future, while cost budgeting is taking that approved estimate and allocating it over time by cost loading the phased, work packages or activities.
Explained another way, cost estimating is the process of generating a monetary value or range of values for management to review and accept. Upon acceptance, this value or range of values becomes the time phased budget for the program, project, work package or activity against which progress against the plan is assessed, analyzed, evaluated, the output of which is used by management to make decisions.
When combined or integrated with Module 7- Managing Planning and Scheduling, we have produced a time phased budget, which normally takes the approximate shape of an “S Curve” and is known as the “Performance Measurement Baseline” or PMB.
08.1.2 - WHAT ARE THE PROCESS MAPS FOR MANAGING COST ESTIMATING & BUDGETING
This module is about the creation of the baseline, prior to the schedule being progressed or updated, and as such the primary deliverable at the completion of this process along with the process of Planning and Scheduling, is to create the “Performance Measurement Baseline” (PMB) which traditionally takes the shape of an S Curve, and is used to capture, measure and assess progress against the baseline plan and to forecast current performance based on past performance to date.
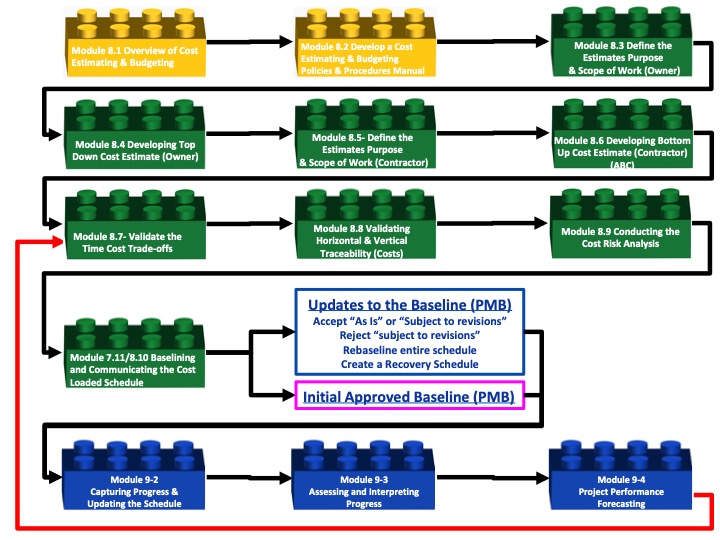
Figure 1 - 1,000 Meter Level Typical Process Flow Chart for Module 8- Managing Cost Estimating and Budgeting
Source: Guild of Project Controls
To turn the cost estimate into the cost budget, we need to INTEGRATE the Planning and Scheduling processes from Module 7 with those of Module 8. To see how the two processes are complimentary and synergistic, we need to understand the process shown in Figure 2 below.
Please note that in functionally structured organizations this means the management of each functional group needs to coordinate the efforts between the planning/scheduling functions and the cost estimating/cost budgeting functions, however, if the organization is structured cross functionally as a project management office, (PMO), Project Support Office (PSO) or Project Controls Office (PCO) this integration may well be done by the same people either separately or more commonly, simultaneously.
Also important to understand is the fully integrative relationship between Module 7- Managing Planning and Scheduling, Module 8- Managing Cost Estimating and Budgeting and Module 9- Managing Progress.
08.1.2.1 - The INTERFACE Between PLANNING Modules, COST Modules and Project PROGRESS Modules
If we are working in a cross functional environment (i.e. Project Management Office (PMO), “Project Controls” (PC) or “Project Support Services” (PSS), where there is a team of cross trained professionals in planning & scheduling, cost estimating and forensic analysis, this is not an issue as either one person known as a “cost engineer” or “project controller” or “project control engineer” is responsible to produce a fully cost and resource loaded CPM schedule, whether from the owner’s (top down) or contractors (bottom up) perspective.
However, if you are working in a FUNCTIONAL organization where planning & scheduling, cost estimating and forensics are treated as separate organizations which may or may not even be working together in the same area, then we have to understand how and when the planners and schedulers need to be collaborating to ensure that the schedule is cost and resource loaded and that the schedule actually makes sense from the standpoint of those doing the work.
(1) Whether owner or contractor, when working in a FUNCTIONALLY STRUCTURED organization, the planners and schedulers will execute Module 7.1 through 7.4 validating their work against the relevant GAO’s “Best Practices in Scheduling” checklist as shown in Appendix 1 and Appendix 3. At the same time, the FUNCTIONALLY ORGANIZED Cost Estimating/Quantity Surveyors are producing their cost estimates, whether owner (using “top down” tools & techniques) or contractor (using “bottom up” tools and techniques)
(2) As the owner’s cost estimator, each time you are preparing for a phase gate review, you would need to work with the planner/scheduler and based on a Level 1 Scope of Work the planner/scheduler would create a Level 1 Schedule and you, as the Owner’s cost estimator, would have to prepare a Level 1 cost ESTIMATE and then allocate that cost estimate across however many activities the planner/scheduler created. This process would repeat until you get to Phase 3 and you have a cost and resource loaded CPM schedule based on the owner’s inputs down to Level 3 minimum or ideally, level 4, WBS, CPM Schedule and Cost Budget, including owner’s risk contingency for both time and cost.
(3) When we get to Phase 4 or Phase 5, the owner has now put the project out for bid and it is now the CONTRACTOR who has to put together his/her schedule as the basis to bid the project. Because the contractor is working on singled digit EBIT margins, it is essential that the cost estimate is coordinated between the planner/scheduler and the cost estimator as the durations (which are a function of the resources available and their productivity) have a direct impact on the cost of the activity. This is known as Activity Based Costing (ABC) and you will have the opportunity to work on a case study later in this module so you know how it is done and you can see why it is so important for the planner/scheduler and the cost estimator/project controller to work together when doing this.
(4) Having assigned the resources, (planner/scheduler) and having put a cost against those resources, (cost estimator) and adjusting the duration and costs for productivity, we have a cost and resource loaded schedule but one which is not yet OPTIMIZED. What we may find out is that instead of doing the concrete work in the spring or fall, when placing concrete is the least expensive, we may find out that the concrete is scheduled to be placed in the middle of winter or in the heat of summer, when placing concreted is more expensive. The cost estimators and planner/schedulers need to hold a scheduled development meeting with those who will be doing the work and see if there is a way to move the concrete placement activities around so they fall in the spring or summer, when costs are lower.
(5) As not only does schedule information (i.e. Activity ID’s, Activity Codes and WBS etc) have to roll up from the contractors schedule into the owners schedule, so does the COST and BILLING (earned value) information also have to roll up from the contractor’s schedule into the owners schedule. This is why it is so crucially important that the OWNER is the one who determines the coding structures and needs to include them in the relevant specifications section governing CPM Schedules and billing usig Earned Value Management, which is covered in Module 9.
(6) Using exactly the same tools and techniques to identify and mitigate schedule risk and cost risk, these too need to be done simultaneously. The reason for this being is there is a very strong correlation between time and costs which means as a result of the outcomes from Module 7.11 and 8.4, we may have to go back to Modules 7.9 and 8.7 again to explore trade-offs to get the schedule OPTIMIZED in terms of both time and cost.
(7) IF this is a Phase Gate Review then the OWNER’s project control team would submit the cost and resource loaded CPM schedule at the level of detail appropriate to the phase gate, for their management to accept or otherwise act on. If this was Phase 4 or Phase 5 and the CONTRACTOR’s project control team had prepared the Cost and Resource Loaded CPM Schedule for the owner’s acceptance in order to obtain the Notice to Proceed (NTP), then the OWNER’s Planner/Scheduler and Cost Estimators would need to conduct a due diligence review, consisting of an audit against Modules 7.3 to 7.11 and and 8.3- 8.9 and based on the outcomes of that audit, making recommendations to their management to accept the contractors Performance Measurement Baseline (PMB) and approve the notice to proceed. (either “as submitted” or “subject to” minor changes) For specifics on what audits the planner/scheduler and cost estimator should be doing, refer to the GAO’s Best Practices in Scheduling, Appendix 1 and Appendix 3 and the GAO’s Best Practices in Capital Budgeting, Best Practices 1- 17.
(8) The Owner’s Management accepts the Contractors cost and resource loaded CPM schedule and issues the Notice to Proceed (NTP)
(9) Work commences against the project plan (project performance baseline) and at the end of each contractually required reporting period, the contractor submits a progress report along with his/her billing for the work completed. Prior to submitting the progress report and billing to the owner, the CONTRACTORS planner/scheduler and cost estimator should conduct a QUALITY CHECK, against the GAO’s Best Practices in Scheduling, Appendix 1 and Appendix 3 and the GAO’s Best Practices in Capital Budgeting, Best Practices 1- 17. Upon receipt of the periodic progress report from the contractor, the OWNER’s planner/scheduler and cost estimator should also use the two GAO “Best Practices” as the basis to evaluate the accuracy, reliability and precision of the contractors progress report and billings.
(10) This feedback loop repeats each and every time a progress report is prepared by the contractor, quality checked prior to submittal to the owner, quality checked by the owner against the same standards;
(11) Lastly, the owner’s planner/schedulers and cost estimator provide their recommendations to their management as to whether to accept the progress report, reject it and either Rebaseline or create a Recovery schedule and the cycle begins again.

Figure 2 - Detailed Interface between Module 7- Managing Planning & Scheduling, Module 8- Managing Cost Estimating and Budgeting and Module 9- Managing Progress
Source: Guild of Project Controls
The graphic below provides further explanation and clarification of the interfaces between the Contractor’s and Owner’s project control teams to obtain the initial Notice to Proceed (NTP) and then prepare, submit and assess periodic updates.
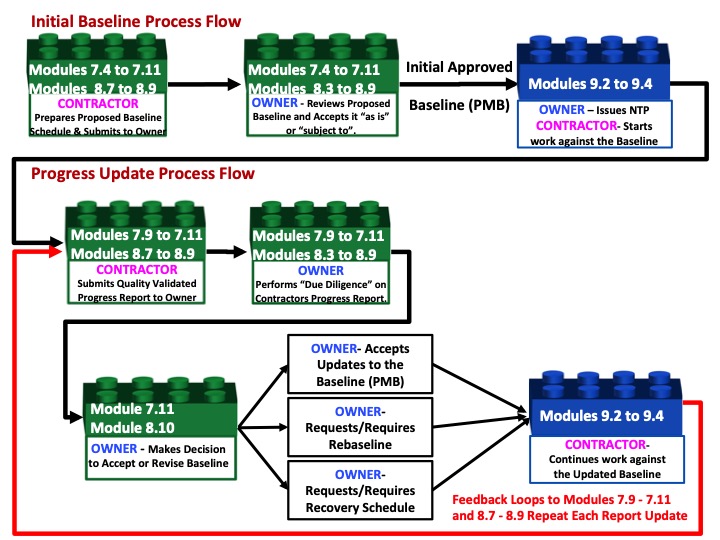
Figure 3 - Showing the Interfaces Between Contractor and Owner for Modules 7- Managing Planning & Scheduling, Module 8- Managing Cost Estimating and Budgeting and Module 9- Managing Project Progress
Source: Guild of Project Controls
08.1.3 - BACKGROUND INFORMATION FOR MANAGING COST ESTIMATING & BUDGETING
The Guild of Project Controls has invested considerable time and effort researching “best tested and proven” practices. To be considered, they had to have met 4 criteria
(1) Been developed and published by credible authors, universities or other organizations;
(2) They had to be “recent” (no more than 10 years old)
(3) Available at no cost or obligation;
(4) Are “open source” or “public domain” publications accessible on-line.
Keeping in mind that many members of the Guild of Project Controls are from the developing nations and given the future is clearly based on the ability to use mobile and other internet connected devices to access information, these three criteria were deemed to be important and are what set the Guild of Project Controls apart from many other professional organizations.
And the four documents pertaining to cost estimating and cost management which are free, published in the public domain, and which we believe represents “best tested and proven practices” are:
(1) US Government Accountability Office (GAO) “Cost Estimating and Assessment Guide - Best Practices for Developing and Managing Capital Program Costs” (2009) GAO-09-3SP
(2) US Dept of Energy (DoE) “Cost Estimating Guide”
(3) Gary Cokins and the Institute of Management Accounts (2006) “Implementing Activity Based Costing”
(4) United States Department of the Interior National Park Service "Cost Estimating Requirements Handbook"
For background information both documents had input from a significant number of leading AACE and PMI members, and much of the AACE Recommended Practices have been incorporated directly or indirectly into all 4 reference documents.
Thus this module is considered to be a SUMMARY OF and a SUPPLEMENT to both the GAO and DoE documents as the Guild of Project Controls has expanded upon, clarified and in some cases, disagreed with what the GAO or DoE are recommending. Explained another way, the Cost Estimating and Budgeting Project Controls module is based on the GAO-09-3SP plus DOE 413.3-21 as the foundation documents and TOGETHER, all three documents represent the current definition of the Project Controls Compendium and Refernece (GPCCAR).
The Guild of Project Controls has also looked at Cost estimating and budgeting from both the Owner’s perspective (which is the same perspective that the GAO and DoE documents did) and also from the Contractor’s perspective. (Which the GAO and DoE documents do not)
For those preparing for any of the GPC certification exams, you need to be familiar with all three documents, however, in the event there are any clarifications or disagreements, the GPC (this) document will take precedence. You would also be well served if you were to review:
- Module 4 - Managing Risk,
- Module 5 - Managing Contracts,
- Module 7 - Managing Planning & Scheduling,
- Module 9 - Managing Progress,
- Module 10 - Managing Change and
- Module 12 - Managing Project Forensic Analysis
Why? because there is a strong linkage between Cost Estimating / Cost Budgeting and Risk, Contracts, Planning & Scheduling, Progress, Change and Claims.
08.1.3.1 - History & The Challenges Facing BOTH OWNERS and CONTRACTORS
While there are no written records from the Pyramids, credible research done by Damian Zimmerman back in 1997 on the Great Wall of China explained:
“The fact is, that the cost of the wall's construction bankrupted Dynasty after Dynasty.”
More recently, the Panama Canal offers us an opposing view:
“The Panama Canal cost Americans around $375,000,000, including the $10,000,000 paid to Panama and the $40,000,000 paid to the French company. It was the single most expensive construction project in United States history to that time. Fortifications cost extra, about $12,000,000.
Amazingly, unlike any other such project on record, the American canal had cost less in dollars than estimated, with the final figure some $23,000,000 below the 1907 estimate, in spite of landslides and a design change to a wider canal.
What we do know, based on Halbert P. Gillette in his 1910 “Handbook of Cost Data for Contractors and Engineers” is the processes of cost estimating have not changed significantly since the early 1900’s and there is no reason to believe they had changed much prior to that for hundreds of years prior. While we have gone from doing quantity take offs and calculations by hand, to using slide rules, to estimating boards and electronic spreadsheets and now Building Information Modelling (BIM), while the tools have become more automated, the processes themselves remain unchanged.
The 1970's was an era of change for the average estimator and one of the most important changes was the pocket calculator. The first affordable pocket calculator came on the market in 1973 (but they still cost half an average week's wages) replacing the need for cumbersome slide rules. Another innovation in the 1970’s was the publication of several cost estimating guides, including R. S Means, which is often cited as examples by the Guild of Project Compendium and Reference.
These books allowed estimators to look up pre-researched figures for materials and labour that could be easily added to any estimate they were working on. These hard copy cost guides are still in use today and are a vital component of estimator's tool box. However, with contractors working on single digit EBIT margins, most contractors today have developed their own proprietary and confidential cost estimating databases which provides them with a competitive advantage over their competitors when bidding or negotiating work.
The arrival of personal computers in the 1980's saw estimating start to change from paper-based to electronic with the arrival of spreadsheet programs such as Lotus 1-2-3 in 1983 and later Microsoft Excel in 1987. The 21st century estimators no longer has to depend on slide rules, a good head for figures or even a spreadsheet.
Despite the increasing automation of the cost estimating processes, research on the top 15 worst performing projects globally has been compiled by Prof. Bent Flyvbjerg
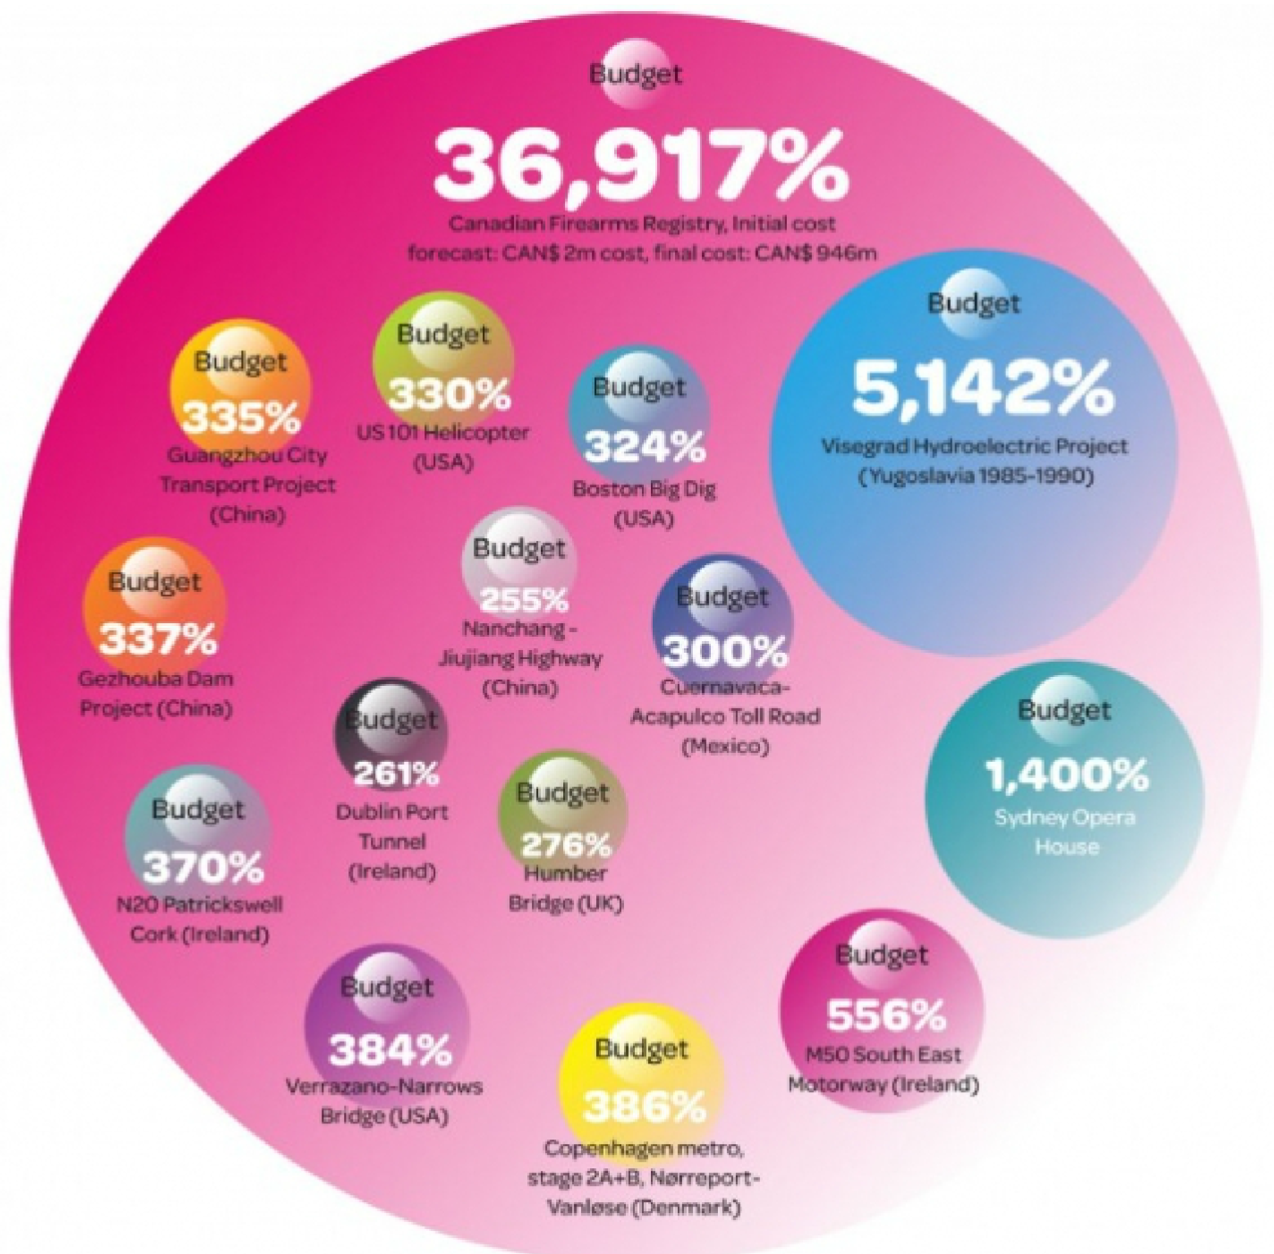
Figure 4 - Research on the Top 15 Worst Performing Projects Globally
Source: Prof. Bent Flyvbjerg (n.d.) 15 of the World’s biggest Cost Overrun Projects
Professor Flyvbjerg has been an outspoken critic of the practice of cost estimating and has suggested that it goes beyond mere incompetence and in many examples indicates malfeasance, non-feasance or misfeasance on the part of cost estimators, project managers, project sponsors and politicians along with other elected or appointed leaders.
To summarize the history to date, with few exceptions, cost over-runs seem to be a common occurrence, going back hundreds if not thousands of years, and appear to be getting worse not better, as projects become larger and more complex. As we try to professionalise the practice of project controls, cost estimation seems to be the area which offers the most promise to make improvements.
There is no shortage of credible evidence that projects continue to finish late and over budget. The most recent came to us from KPMG with their 2015 Global Construction Project Owner’s Survey- “Climbing the Curve”.

Much of what is contained in this document will be focused on addressing the issues identified in the research.
Maturity in Performance
Figure 5 - Maturity in Performance (right)
Source: KPMG Global Construction Survey 2015
The KPMG researchshows some shocking performance results. Project “success” rates ranged between 47% on the HIGH side and as low as 29% for energy and natural resource projects to only 10% for public sector projects.
31% of projects came within +/-10% of budgets meaning a whopping 69% exceeded their budgets by more than 10% and as only 25% of the projects finished on time, means that 75% finished late.
Also worth noting is how owner organizations view contingency and management reserves.
This too will shape the recommendations illustrated in this document.
This is clearly not a sustainable situation and represents opportunity for those who consider themselves to be “professional” cost estimators and/or project controllers to help fix this problem.
Maturity in Preparation-
Figure 6 - Maturity in Preparation (right) 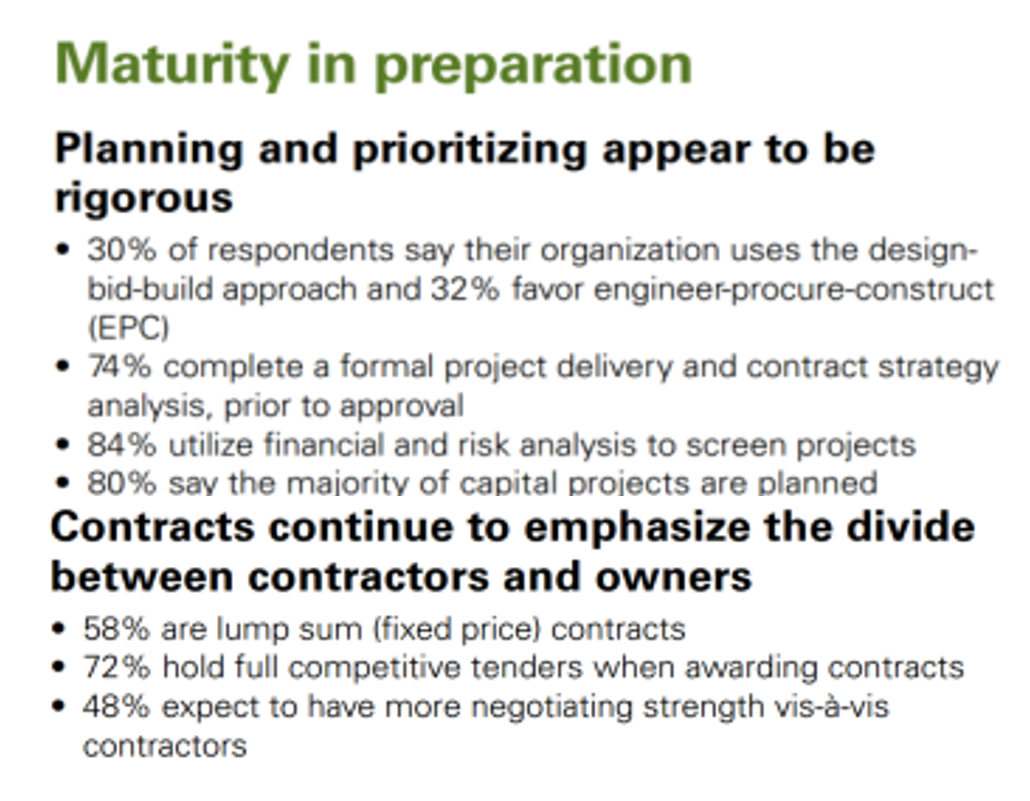
Source: KPMG Global Construction Survey 2015
Based on the KPMG findingswe see that only 30% of owners now use the traditional “Design>Bid>Build” approach with more owners now favoring the “Engineer>Procure>Construct” (EPC) or “turn-key” approach. That still leaves another 38% who use other methods.
Also of interest to project control professionals is that while 74% utilize a formal project delivery approach, it leaves 26% who do not.
This is an opportunity for project controls to market our skills to those companies who are not currently using our services.
So while the KPMG and other studies are telling us that OWNERS are not happy with contractors and see areas for improvements, research indicates that the CONTRACTORS are doing also failing with alarming frequency. Research sponsored and published by the Surety Information Office (SIO) www.sio.org, National Association of Surety Bond Producers (NASBP) www.nasbp.org and the Surety & Fidelity Association of America (SFAA) www.surety.org in 2014 showed just how RISKY the contracting business is for contractors. Figure 7 indicates the contractor failure rates over a 3 year period between 2011 and 2013 of 20% to 29%. Assuming these numbers are typical, what that means is in any given 3 year period, between 25% to close to 30% of contactors fail. And it is highly likely that these percentages apply not only to the USA but to other countries as well.
The same research identified the root causes or “early warning” signs, many of which project control professionals can help identify and mitigate. The partial list below shows where project controls can and should be able to make a positive impact, falling under three main categories:
1. Poor Estimating and/or Job Cost Reporting:
1.1. Revenues and margins decrease over time
1.2. There are continued operating losses
1.3. The company has a loss of or reduction in bonding capacity
1.4. Company bids jobs too low.
2. Ineffective Financial Management System:
2.1. Cash flow is tight or there is an inability to forecast cash flow
2.2. Receivables are turning over too slowly
2.3. Vendors demand cash on delivery for supplies and materials
2.4. Bills are past due
2.5. Company experiences profit fade
3. Poor Project Management:
3.1. Supervision is inadequate
3.2. There is an inability to administer and collect change orders
3.3. Projects are not completed on time
3.4. There is a claim on one or more contracts
3.5. Company is continually involved in litigation
3.6. Backlogs increase without adequate project management resources
3.7. Lead time to prepare bids is too short
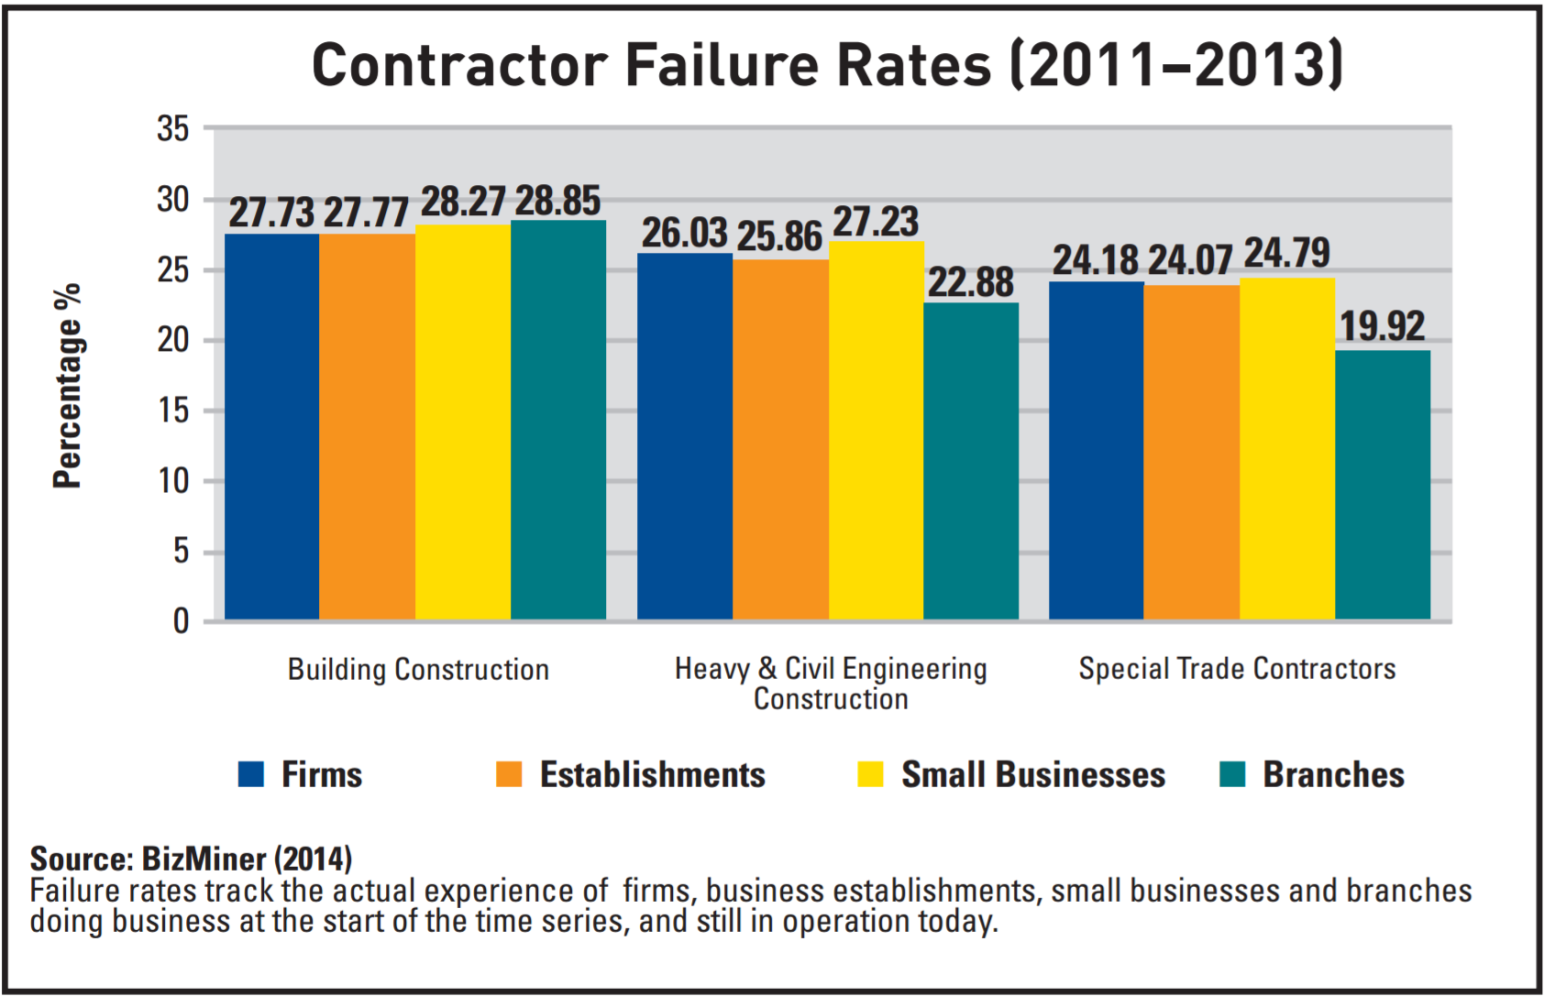
Figure 7 - Why Do Contractors Fail?
Source: Surety & Fidelity Association of America (SFAA)
Given that it was Albert Einstein who told us that “doing the same things over and over again but expecting different results is the definition of insanity”, the Guild has invested thousands of person hours to research and identify “best tested and proven” practices. At the same time, the Guild also recognizes that there are contractors and owners who do not agree with some of the practices being advocated. The question is, whether the rather poor performance recognized by both owners and contractors alike is enough for us to continue doing the same things over and over again or are we willing to at least try the “best tested and proven” practices identified by the Guild in the GPCCAR?
Recognizing that there may be more than one approach that has been “tested and proven to work”, the Guild of Project Controls has implemented a procedure (Include link to update procedure) for those who have differing opinions to share other “Best tested and proven” practices for inclusion into the GPCCAR.
We can also see the percentages of the types of contracts that owners are using. (Refer back to Module 5 - Managing Contracts)
To close out our efforts to provide context for this module, we can see research published by NASA’s Glenn Butts (Butts, Glenn (2010) Mega Project Estimates- A history of denial).
His scathing review of NASA’s estimating track record and his research into the “root causes” for project costs and schedule growth has also played an important role in the preparation of this document.
When sharing with you “best tested and proven” practices, we will try to tie them back to these 8 “root cause” problems.
One of the big issues is whether as a professional “cost estimator” or “project controls” practitioner, we have an ethical if not legal obligation to “push back” when owners or clients are pushing us to deliver what are known as “Death March” projects- projects which we know from the time of inception have overly optimistic time or cost budgets. (See Module 2 - Managing People for more on this topic.)
For more on this, Glenn Butts, Head Cost Estimator for NASA, has published several papers on what he believes are the problems and the solutions to get better cost estimates. In his 2010 paper, “Mega Projects Estimates - A History of Denial” he has identified 8 leading causes of poor or incomplete cost estimating. The Guild of Project Controls has relied heavily on the advice of Glenn Butts in developing this Module and those modules which are linked to and support the creation of a cost estimate. In his research, Butts relies heavily on research conducted by the Rand Corporation as to Why US government projects consistently run over budget.
After a review of this and supporting documents, the Guild of Project Controls believe that many of the same root cause problems identified by Rand and Butts, apply to all projects and not just US government funded projects. This has been further validated and confirmed by leading academics and practitioners such as Professor Bent Flyvberg, BT Professor and inaugural Chair of Major Programme Management at Oxford University's Saïd Business School and Ed Merrow, President of IPA and author of Industrial Megaprojects- Concepts, Strategies and Practices for Success”.
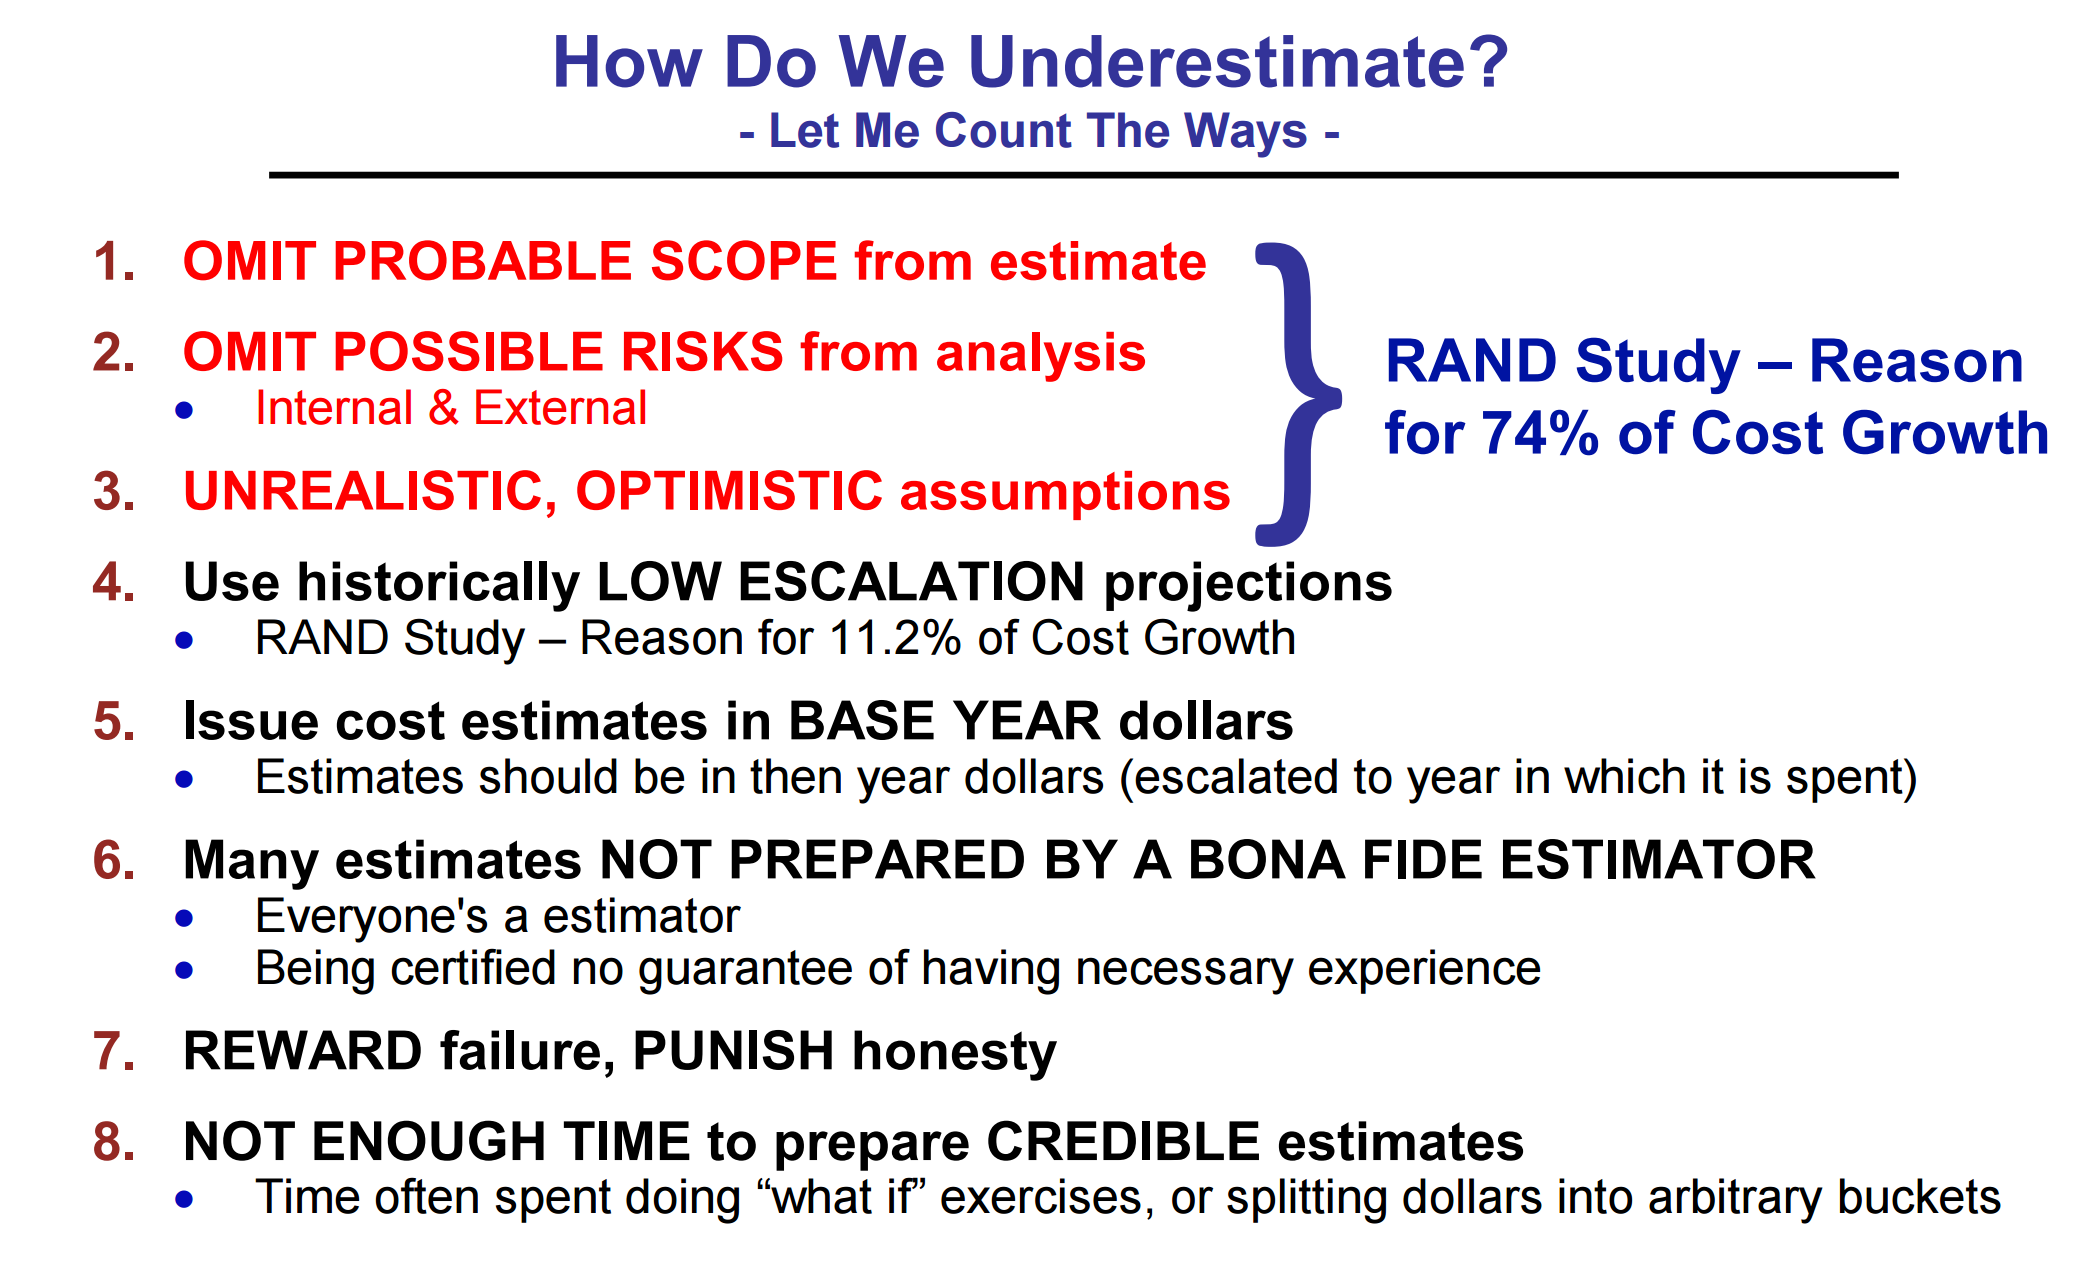
Figure 8 - Eight Leading Causes of Poor or Incomplete Cost Estimating
Source: Butts, Glen (2010) “Mega Projects Estimates - A History of Denial”
As the Guild of Project Controls has relied heavily on this credible research, we have taken great pains to ensure that we address each of these issues in the GPCCAR document:
(1) Omit Probable Scope- Your Guild has dedicated an entire Module which covers Managing Scope with the conclusion that we consider it a “best tested and proven” practice to:
a. Adopt STANDARDIZED Work Breakdown Structures
b. Which are capable of producing multiple sorting or viewing capability
(2) Omitting Probable Risks- The Guild of Project Controls has also dedicated Module 04- Managing Risks and Opportunity which includes an assessment of both Internal and External Risks and Opportunities.
(3) Unrealistic/Overly Optimistic Assumptions- Throughout the GPCCAR, one of the common themes is the ethical if not legal importance for project control professionals to be continually testing and validating assumptions, both in terms of time and costs.
(4) Use of historically low escalation factors- The GPPCCAR is advocating that instead of using average (P50) values for inflation and other cost increases that between P60 (Contractors) or P75 (for Owners) would be the minimum acceptable factors to be prudent.
(5) Use of Base Year money- In both this module 08- Managing Cost Estimating and Budgeting and Module 04- Managing Risks and Opportunity, we explain the various tools & techniques to project today’s costs into the future so that we are using “real” monetary units when the project is going to be actually executed rather than today’s money, when the project funding is approved.
(6) Use of UNQUALIFIED or MARGINALLY QUALIFIED Cost Estimators (and by inference, Schedulers and Project Control professionals)- This is the driver behind the Planning Planet creating the Guild of Project Controls and our multi-level, multi-track credentialing program which is predicated on COMPETENCY and not just the ability to pass multiple choice exams. More on this focus can be found in Module 02- Managing People and more specifically, Module 02-2- Developing the Project Controls Career Path Development Plan
(7) Rewarding Failure/Punishing Honesty- Unfortunately, project control practitioners are frequently subject to “Shoot the Messenger” syndrome where our management, clients or other stakeholders hold us responsible for sharing “bad news” with them, even though we had little or nothing to do with the execution of the work against the plan. To address this issue, the Guild of Project Controls is revisiting our Code of Ethics and exploring how to modify it to be in alignment with the “best tested and proven” Code of Ethics advocated by the Society for Corporate Compliance and Ethics (SCCE). By benchmarking the GPC Code of Ethics against the SCCE “Best in Class” standard, we hope be able to raise the professional image of “Project Controls” practitioners by empowering us to reject unrealistic cost estimates or schedules.
(8) Not Enough Time to Prepare “Credible” Estimates- This issue was addressed very specifically in Module 08-4 Creating the Owners Cost Estimate, where we provide an example of how to calculate how much time to allow for a “credible” cost estimate to be prepared.
As the Guild of Project Controls has based our GPCCAR as well as our multi-level, multi-track credentialing program on the PROCESSES associated with Project Controls, it is highly recommended that whatever level of competency you are at, that you start with Module 1 and at least familiarize yourself with Modules 1-7 BEFORE starting this module and that you follow on and continue reading Modules 9-12 upon finishing this module.
- Only by developing the “big picture” understanding of how the processes all work together can one begin to appreciate any one specific role or responsibility they have in that big picture.
08.1.3.2 - What is a Cost Estimate
Looking to our Business Dictionary to provide us with standardized, unbiased definitions, they define a “Cost Estimate” to be “An approximation of the probable cost of a product, program, or project, computed on the basis of available information.
Four common types of cost estimates are:
(1) Planning estimate: a rough approximation of cost within a reasonable range of values, prepared for information purposes only. Also called ball park estimate.
(2) Budget estimate: an approximation based on well-defined (but preliminary) cost data and established ground rules.
(3) Firm estimate: a figure based on cost data sound enough for entering into a binding contract.
(4) Not-to-exceed /Not-less-than estimate: the maximum or minimum amount required to accomplish a given task, based on a firm cost estimate.
This definition is consistent with the “old” ANSI Z-94.0, which is still being followed by some organizations, such as PMI. However, as we have moved to a phase gate approach, most organizations have gone from a 4 level system to a 5 or 6 level system, to match each phase gate decision support package. As the DoE has adopted the approach taken by AACE in their Recommended Practice 18R-97 and 17R-97, this is the basis that the Guild of Project Controls has also taken.
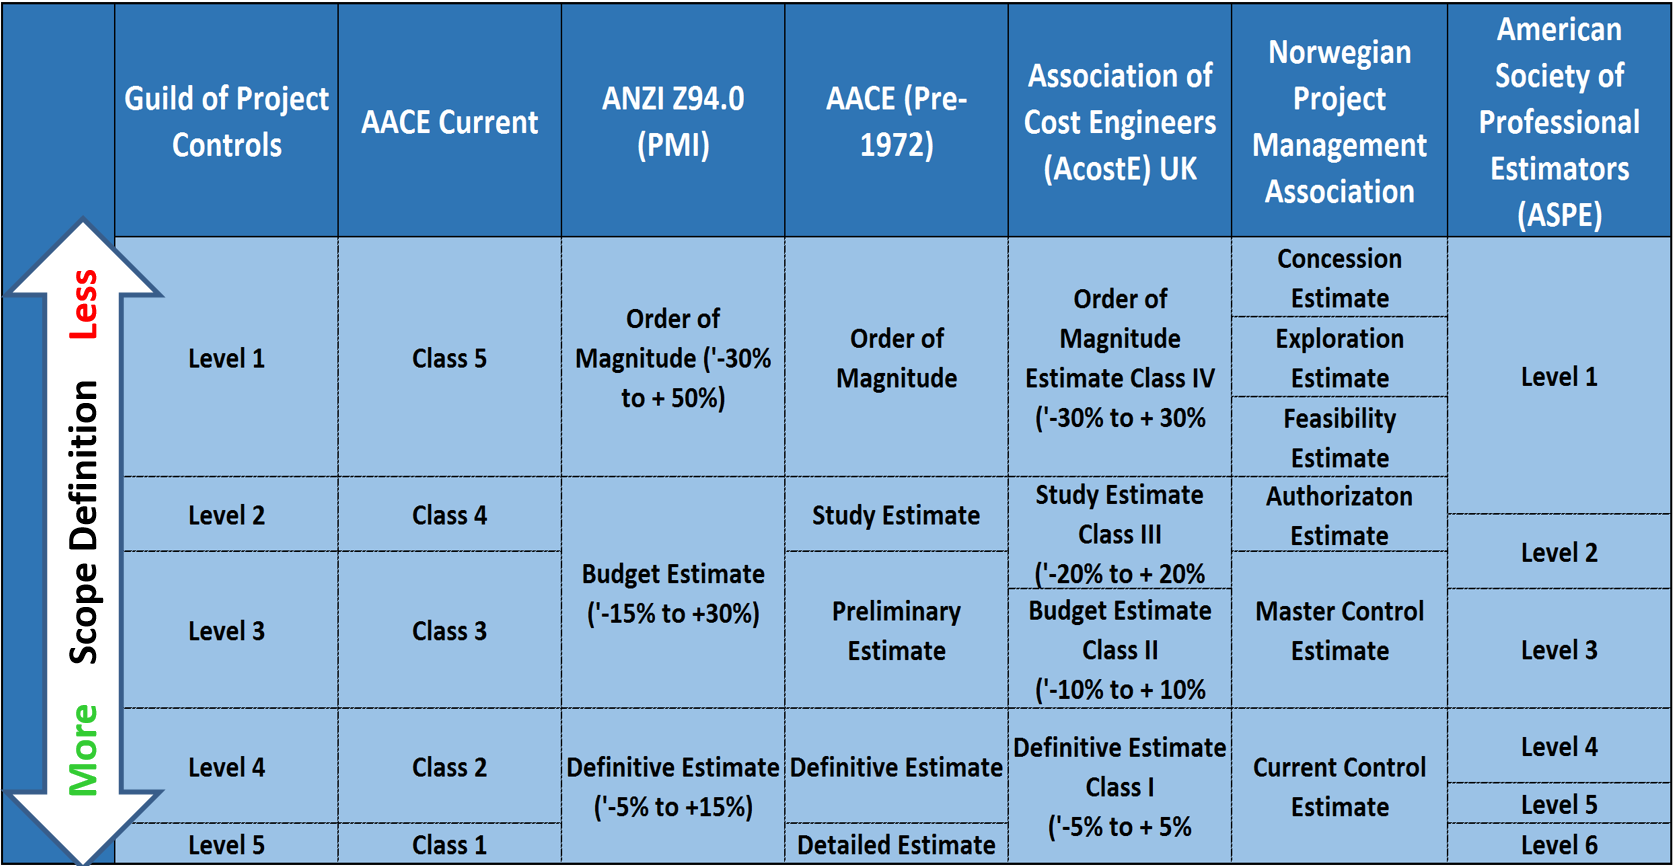
Figure 9 - Illustrating the lack of standardization in Levels of Cost Estimates
Source: Guild of Project Controls
In illustration Figure 9 above, we illustrate the lack of consistency and standardization in naming the different levels or classes of estimates. To help alleviate this “Tower of Babel”, the Guild of Project Controls has chosen to standardize our WBS, Schedule and Cost Estimate Levels to the Phase Gate process.
To help clarify the clearly unsustainable situation above, the Guild is proposing the following naming conventions: what was explained in Figure 9 above.
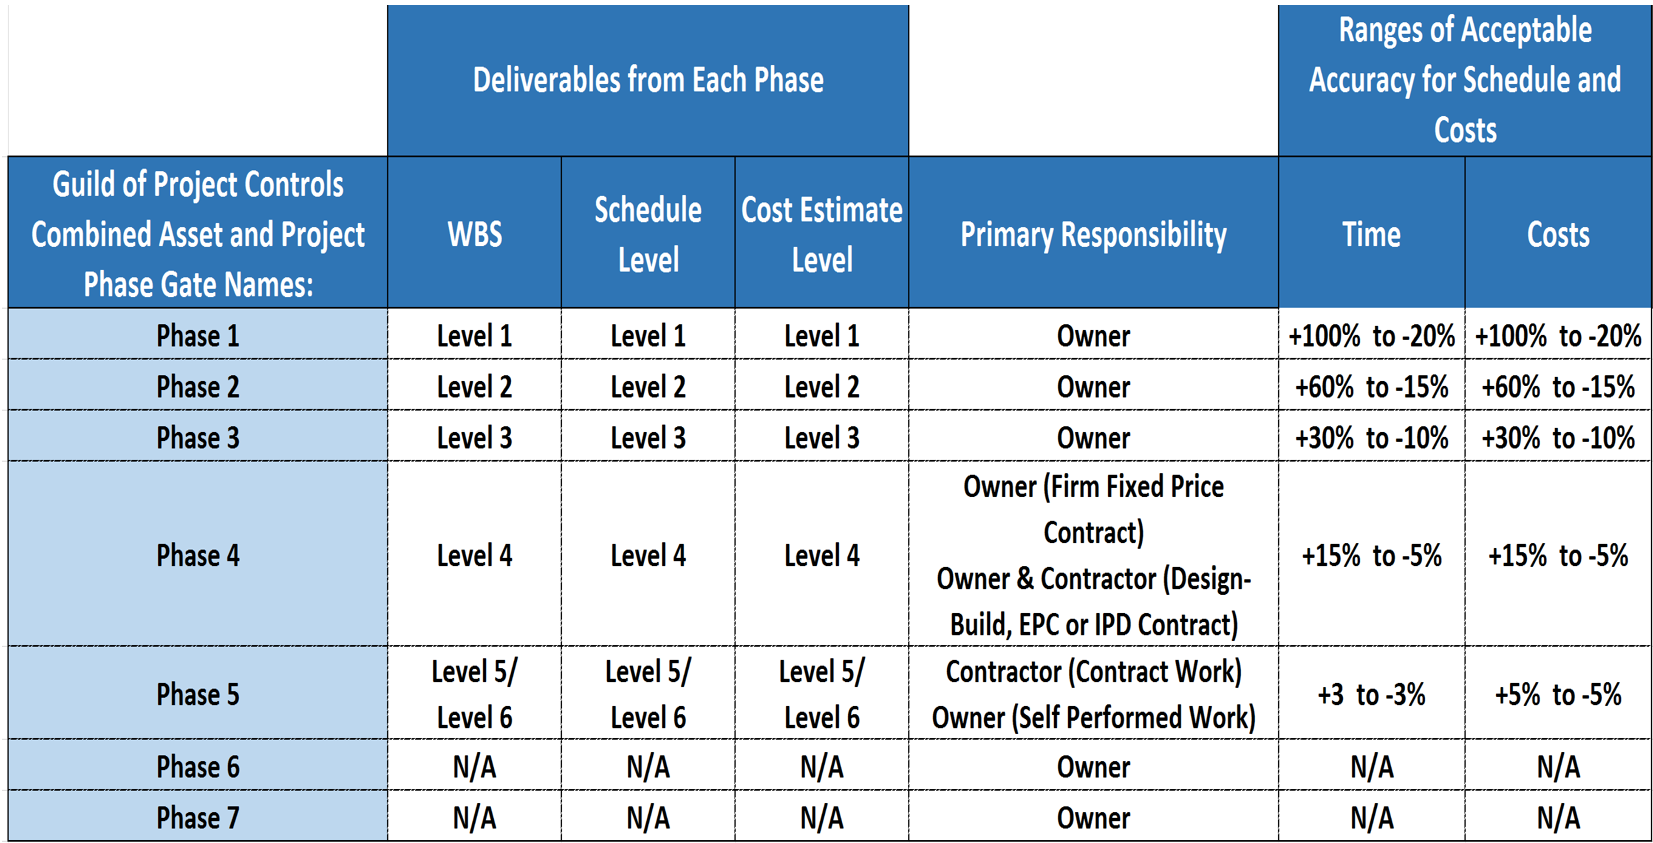
Figure 10 - Guild of Project Controls Proposed WBS, Schedule and Cost Estimate Level Taxonomy
Source: Guild of Project Controls
In this model, we have adopted the ranges of acceptable accuracy from AACE and the US Dept of Energy standards, however we would like to see more research being done to validate those ranges both for time and costs as we believe they vary sector to sector and perhaps based on the complexity of the project or other variables. Thus this topic would make a very good research paper topic for those aspiring to higher levels of certification.
As the Guild of Project Controls believes the phased gate approach to be a “best tested and proven” practice we advocate that organizations adopt a cost estimating model which is consistent with their phase gates. The model we have been using for illustration purposes is an adaptation of the model used by Chevron, (which is also based on AACE’s RP 18-R-97 and RP 17R-97)) however, even though the names of the phases change, the concept of using a phase gate approach is used by nearly all major international oil companies and has been adopted by other industries as well.
One of the objectives in using the phased gate approach is to VALIDATE that the cost estimate as produced by the owner’s cost estimators meets three quality control metrics:
(1) How ACCURATE is the estimate, when benchmarked against the mean (P50) or target value
(2) How RELIABLE is the estimate, when benchmarked against the mean (P50) or target value
(3) How PRECISE is the estimate, when benchmarked against the mean (P50) or target value
08.1.3.3 - Accuracy vs. Precision vs. Reliability
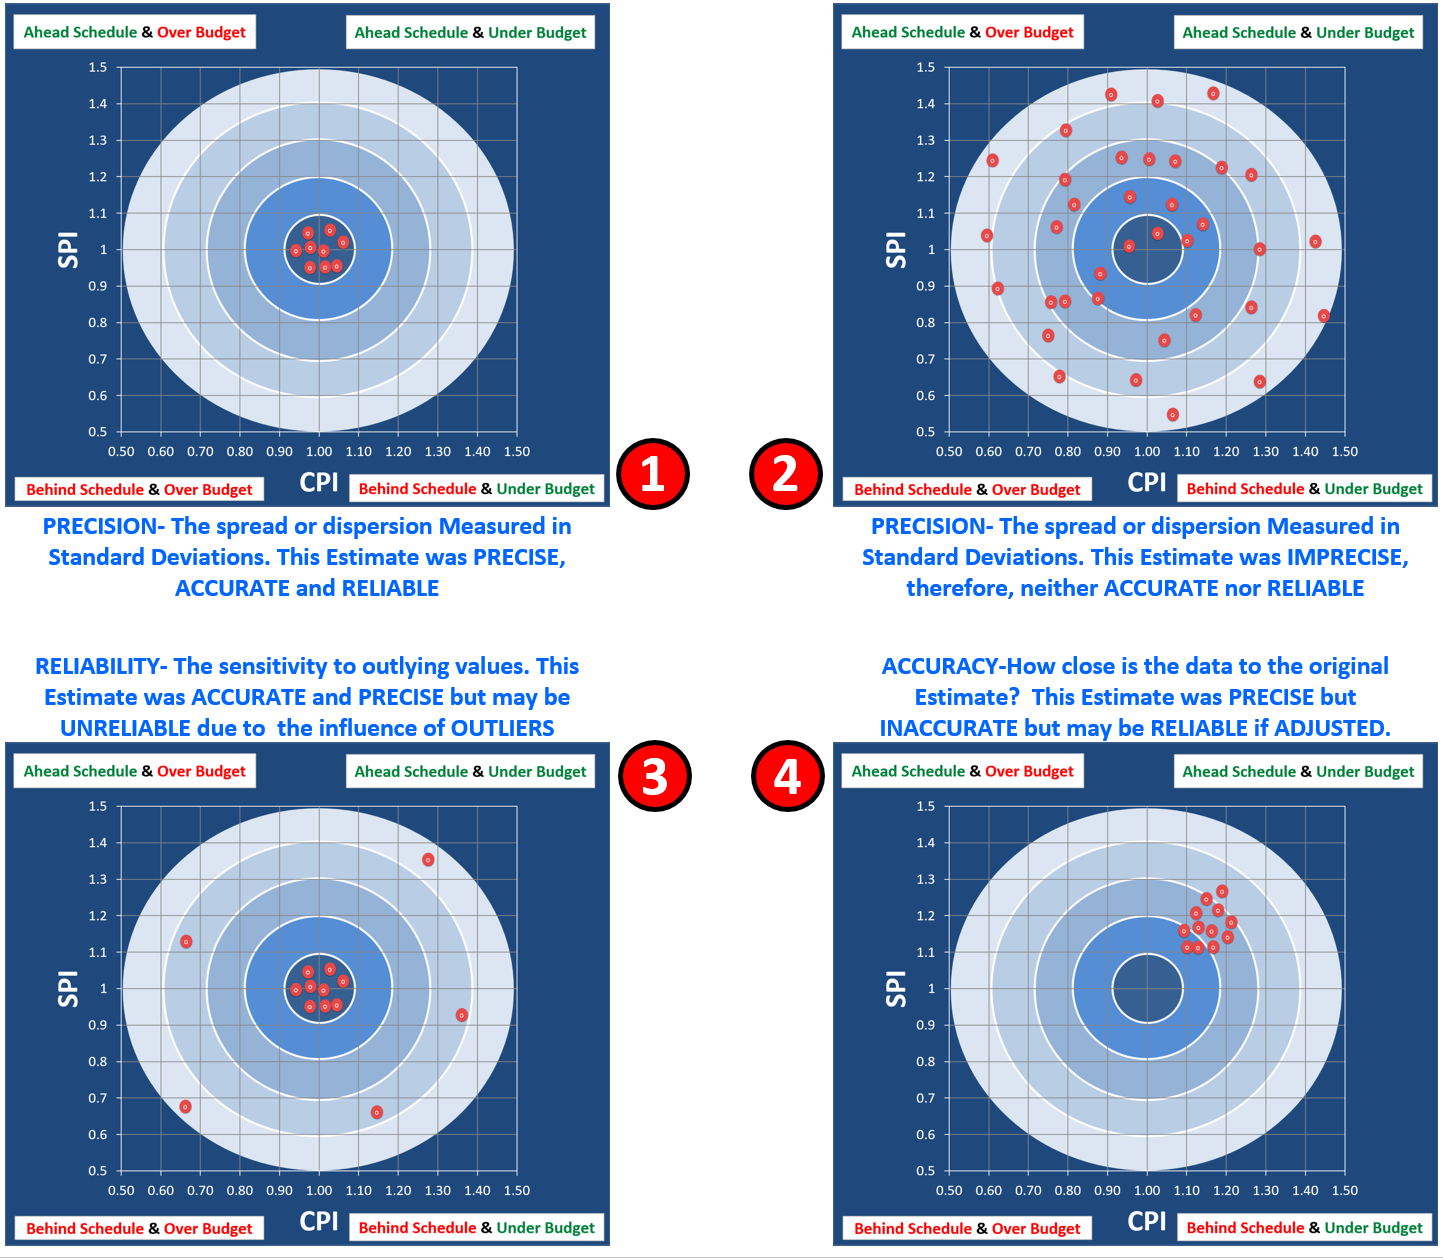
Figure 11 - Illustrating the Concepts of Precision vs Accuracy vs Reliability
Source: Giammalvo, Paul D (2015) Course Materials Contributed Under Creative Commons License BY SA v 4.0
As we recall from Module 4 - Managing Risk and Module 9 - Managing Progress, we need to be able to use the two primary formula from process capability, (efficiency) the SPI and CPI as the basis to evaluate our cost estimating, scheduling (productivity, durations etc) data in terms of how ACCURATE, RELIABLE and PRECISE the data is.
THE 4 SCENARIOS EXPLAINED:
(1) In Scenario 1, the efficiency, as measured by the SPI and CPI are consistently falling within the acceptable target ranges. This means our original baseline estimate was PRECISE, ACCURATE and therefore, is RELIABLE to use for FUTURE PROJECTIONS in terms of both time and cost.
(2) In Scenario 2, the periodic readings are all over the place. This means our baseline estimate was IMPRECISE, therefore it was neither ACCURATE nor RELIABLE to use to predict into the future.
(3) In Scenario 3, while most of our periodic SPI and CPI report readings have been PRECISE, ACCURATE and therefore RELIABLE, we have to ASSESS THE IMPACT of the OUTLIERS. In this situation the project control professional could apply statistical process control chart analysis and throw out those readings which fall outside of +/- 3 sigma as being “special” or “identifiable” causes. In this scenario, using these values to predict the future without running a statistical process control check on them is risky.
(4) In Scenario 4, we are getting SPI and CPI readings which are both PRECISE and RELIABLE but because they are missing the target the only way to use them would be if we adjusted the time and cost estimates to bring them back closer to the target which is one. In this particular example, because we are showing we are both ahead of schedule and under budget, we could at least CONSIDER REDUCING the remaining cost budget and SHORTENING the target completion date.
What we need to remember that the target is always 1 and that a reading which is too HIGH (>1.0) is not necessarily “good”- that overly high readings may well be a sign that the time or cost budget has been “padded” with too much contingency.
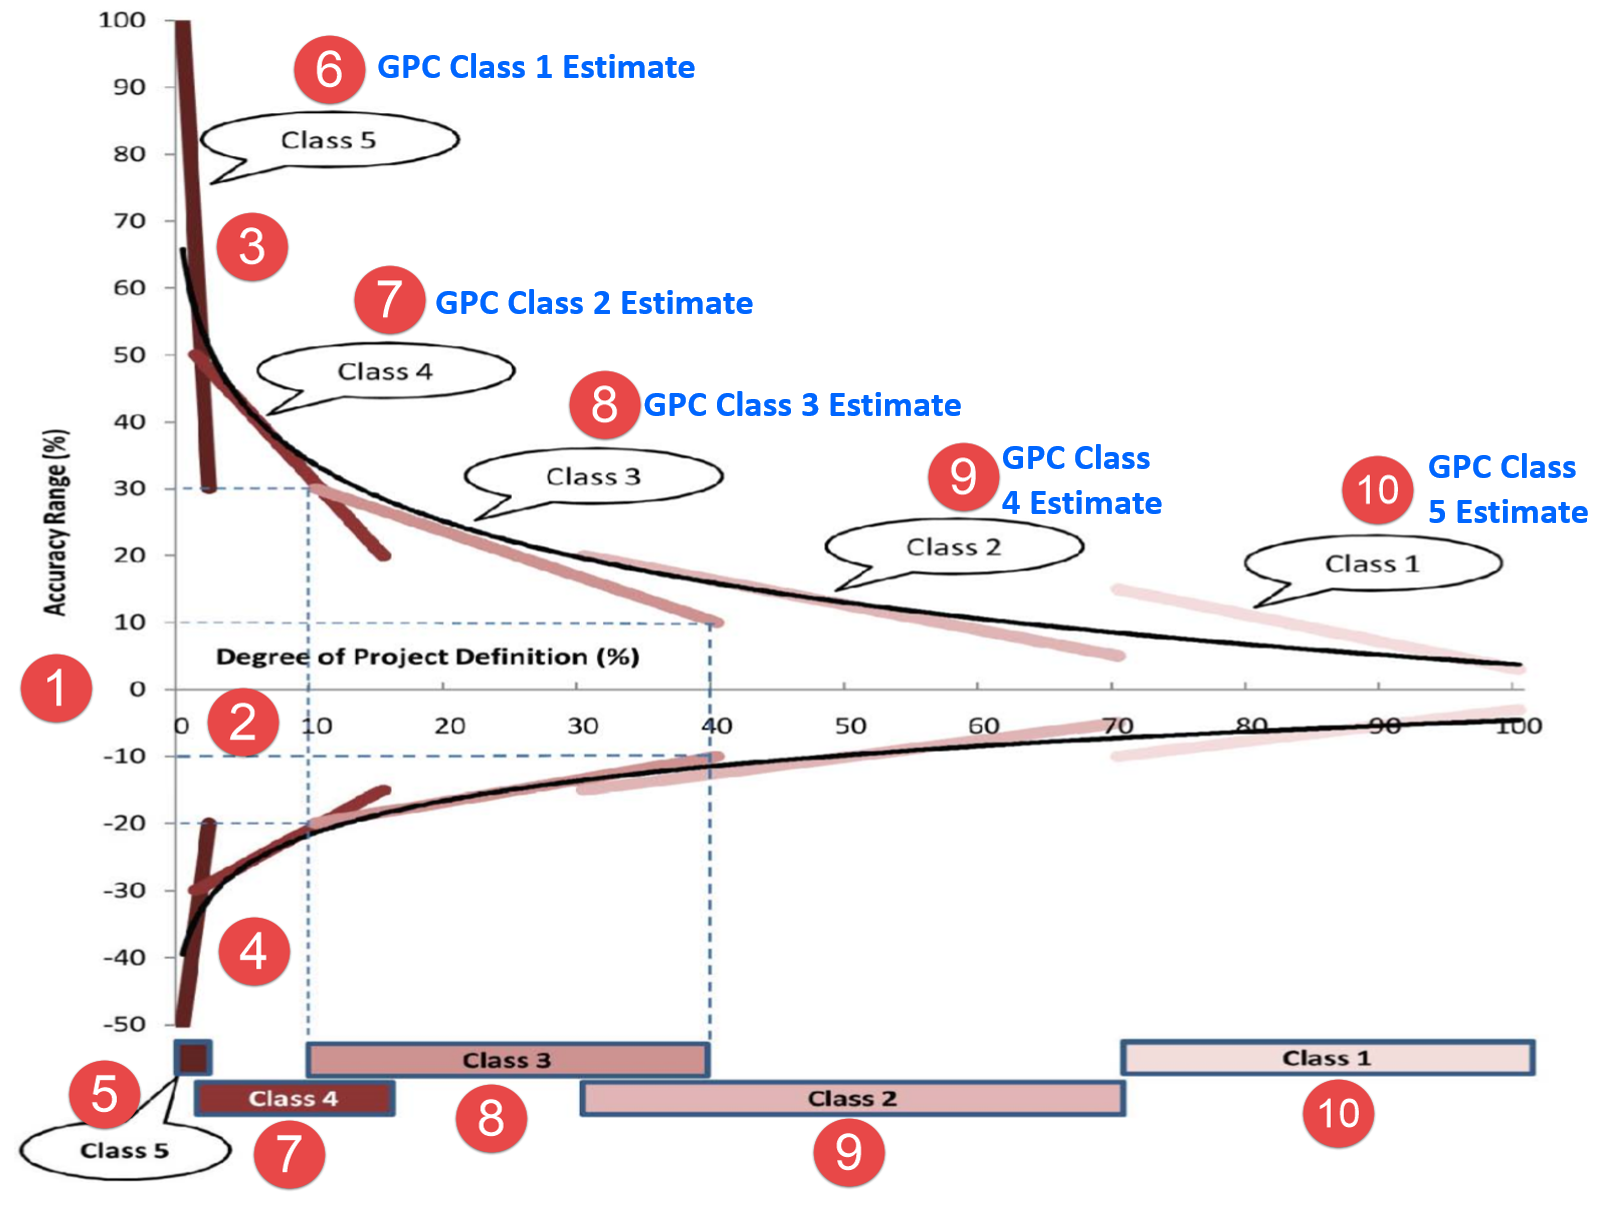
Figure 12 - Range Cost Estimate Data Showing Accuracy Ranges vs Scope Definition
Source: Adapted from DoE Cost Estimating Guidelines
Also taken from Module 4 - Managing Risk and Opportunity, we need to be able to use this chart to help us calculate the Range Estimates for each level of estimate, remembering that what AACE calls a Class 5 Estimate, the Guild of Project Controls calls a Level 1 estimate to match with a Level 1 WBS structure and a Level 1 CPM schedule.
To explain this graphic:
(1) This graph compares the relative range of accuracy versus the degree of project scope definition.. As we can see, the range of estimating accuracy runs from 0% to +100% and from 0% to -50%.The objective being that as we progressively define the scope, we should be able to come as close to zero variance as possible in terms of the difference between the estimated or targeted cost and the actual cost at the end of the project
(2) The other variable in this graph is the degree of scope definition, going from 0% at the far left to 100% scope definition at the far right.
(3) This is typical for all classes of estimates and it shows the UPPER range of allowable variation, which we can see ranges from +30% to +100%. To translate this into Standard Deviations above the mean, +30% = 0.84 δ while +100% = ~+ 4.9 δ.
(4) GPC Class 1- On the down or negative side, the LOWER range of allowable or acceptable variation would be -20% to -50%. Again, to convert this to Standard Deviations (δ) if we consult a z table we can see that -20% = -0.52 δ while -50% is also ~-4.9 δ.
(5) Looking at the series of bars along the bottom, we can see they match up to the % of scope definition (2) and we can see that what is identified as a Class 5 estimate by AACE (Class 1 Estimate using Guild terminology) equates to between 0% - 2% scope definition.
(6) GPC Class 1 Estimate- As noted above, in the DoE reference which is where this graphic originated, they used the AACE classification which the Guild changed to make it more consistent with the levels of schedules and level of WBS structures.
Explained another way, given the mean or P50 cost estimate for a given project, at a Level 1 scope definition of between 0% to 2%, the acceptable variance in costs ranges from a low of -50% to a high of +100%.
(7) GPC Class 2 Estimate -We can see that for the Guild of Project Controls Class 2 estimate, we have an UPPER range of acceptable cost variance between +20% to +50% (+ 0.53 δ to + 3 δ), and a LOWER range of acceptable variance of -15% to -30% (-0.13 δ to -0.53 δ) And looking at what is labelled here as a “Class 4” estimate (GPC Class 2) the expected range of scope definition would be between 1% to about 15%.
Explained another way, given the mean or P50 cost estimate for a given project, at a Level 2 scope definition of between 02% to 5%, the acceptable variance in actual costs at the completion of the project ranges from a low of -30% to a high of +50%.
(8) GPC Class 3 Estimate- Looking at label 8, the GPC Class 3 or AACE Class 3 estimate we have an UPPER range of acceptable cost variance between +10% to +30% (+ 0.25 δ to +0.84 δ), and a LOWER range of acceptable variance of -10% to -20% (-0.25 δ to -0.52 δ) And looking at what is labelled here as a “Class 3” estimate the expected range of scope definition would be between a low of 10% to about 40% on the high side. Explained another way, given the mean or P50 cost estimate for a given project, at a Level 3 scope definition of between 10% to 40%, the acceptable variance in actual costs at the completion of the project ranges from a low of -20% to a high of +30%.
(9) GPC Class 4 Estimate- Label 9, the GPC Class 4 or AACE Class 2 estimate we have an UPPER range of acceptable cost variance between +05% to +20% (+ 0.13 δ to +0.53 δ), and a LOWER range of acceptable variance of -5% to -15% (-0.13 δ to -0.38 δ) And looking at what is labelled here as a “Class 3” estimate the expected range of scope definition would be between a low of 30% to about 70% on the high side.
Explained another way, given the mean or P50 cost estimate for a given project, at a Level 4 scope definition of between 30% to 70%, the acceptable variance in actual costs at the completion of the project ranges from a low of -5% to a high of +20%.
(10) GPC Class 5 Estimate- Label 10, the GPC Class 5 or AACE Class 1 estimate we have an UPPER range of acceptable cost variance between +03% to +15% (+ 0.13 δ to +0.53 δ), and a LOWER range of acceptable variance of -5% to -10% (-0.13 δ to -0.38 δ) And looking at what is labelled here as a “Class 5” estimate the expected range of scope definition would be between a low of 70% to about 100% on the high side.
Explained another way, given the mean or P50 cost estimate for a given project, at a Level 5 scope definition of between 70% to 100%, the acceptable variance in actual costs at the completion of the project ranges from a low of -10% to a high of +15%.
08.1.3.4 - Cost Estimating vs. Cost Budgeting
A “cost estimate” is defined by our standard Business Dictionary reference to be “An approximation of the probable cost of a product, program, or project, computed on the basis of available information.”
While “Cost Budget” is defined to be a “Financial plan prepared for every major expense category, such as administrative cost, financing cost, production cost".
To put these two definitions in context, cost estimating is the process to produce an “educated guess” of what a program, project, work package or activity will cost at some point in the future, while cost budgeting is taking that estimate and allocating it over time by cost loading the phased, work packages or activities. . Explained another way, cost estimating is the process of generating a monetary value or range of values for management to review and accept. Upon acceptance, this value or range of values becomes the budget for the program, project, work package or activity.
As seen in Figure 12 above, there is a strong correlation between scope definition and the accuracy, reliability and precision of that estimate.
Figure 13 below provides us with an example of a COST ESTIMATE while Figure 12 illustrates how project control perspective, what a COST BUDGET looks like.
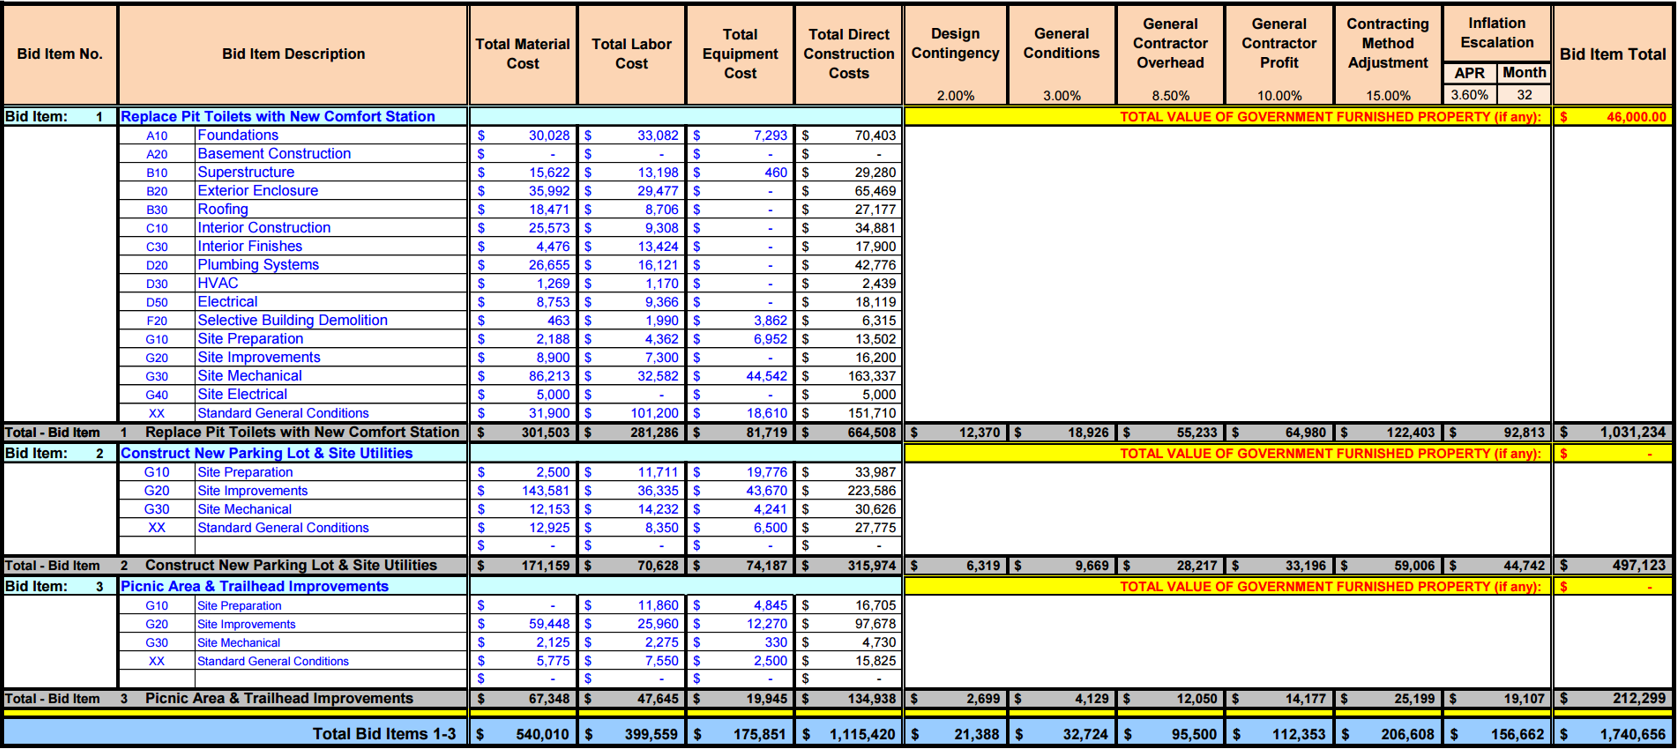
Figure 13 - Example of a Cost ESTIMATE (summarized to Level 3 of the WBS)
Source: US National Park Service Cost Estimating Handbook (2011)
Note that using the Park Service terminology, what they call a “Class A” estimate is what the GPC calls a Level 5
Normally a cost ESTIMATE is shown in spreadsheet or database format and invariably, can be “rolled up” or “rolled down” to Level 4, 5 or even 6. The example shown above goes down to Level 5. To obtain the blank Excel template for this example, go HERE- Scroll down to “Class A Estimate”
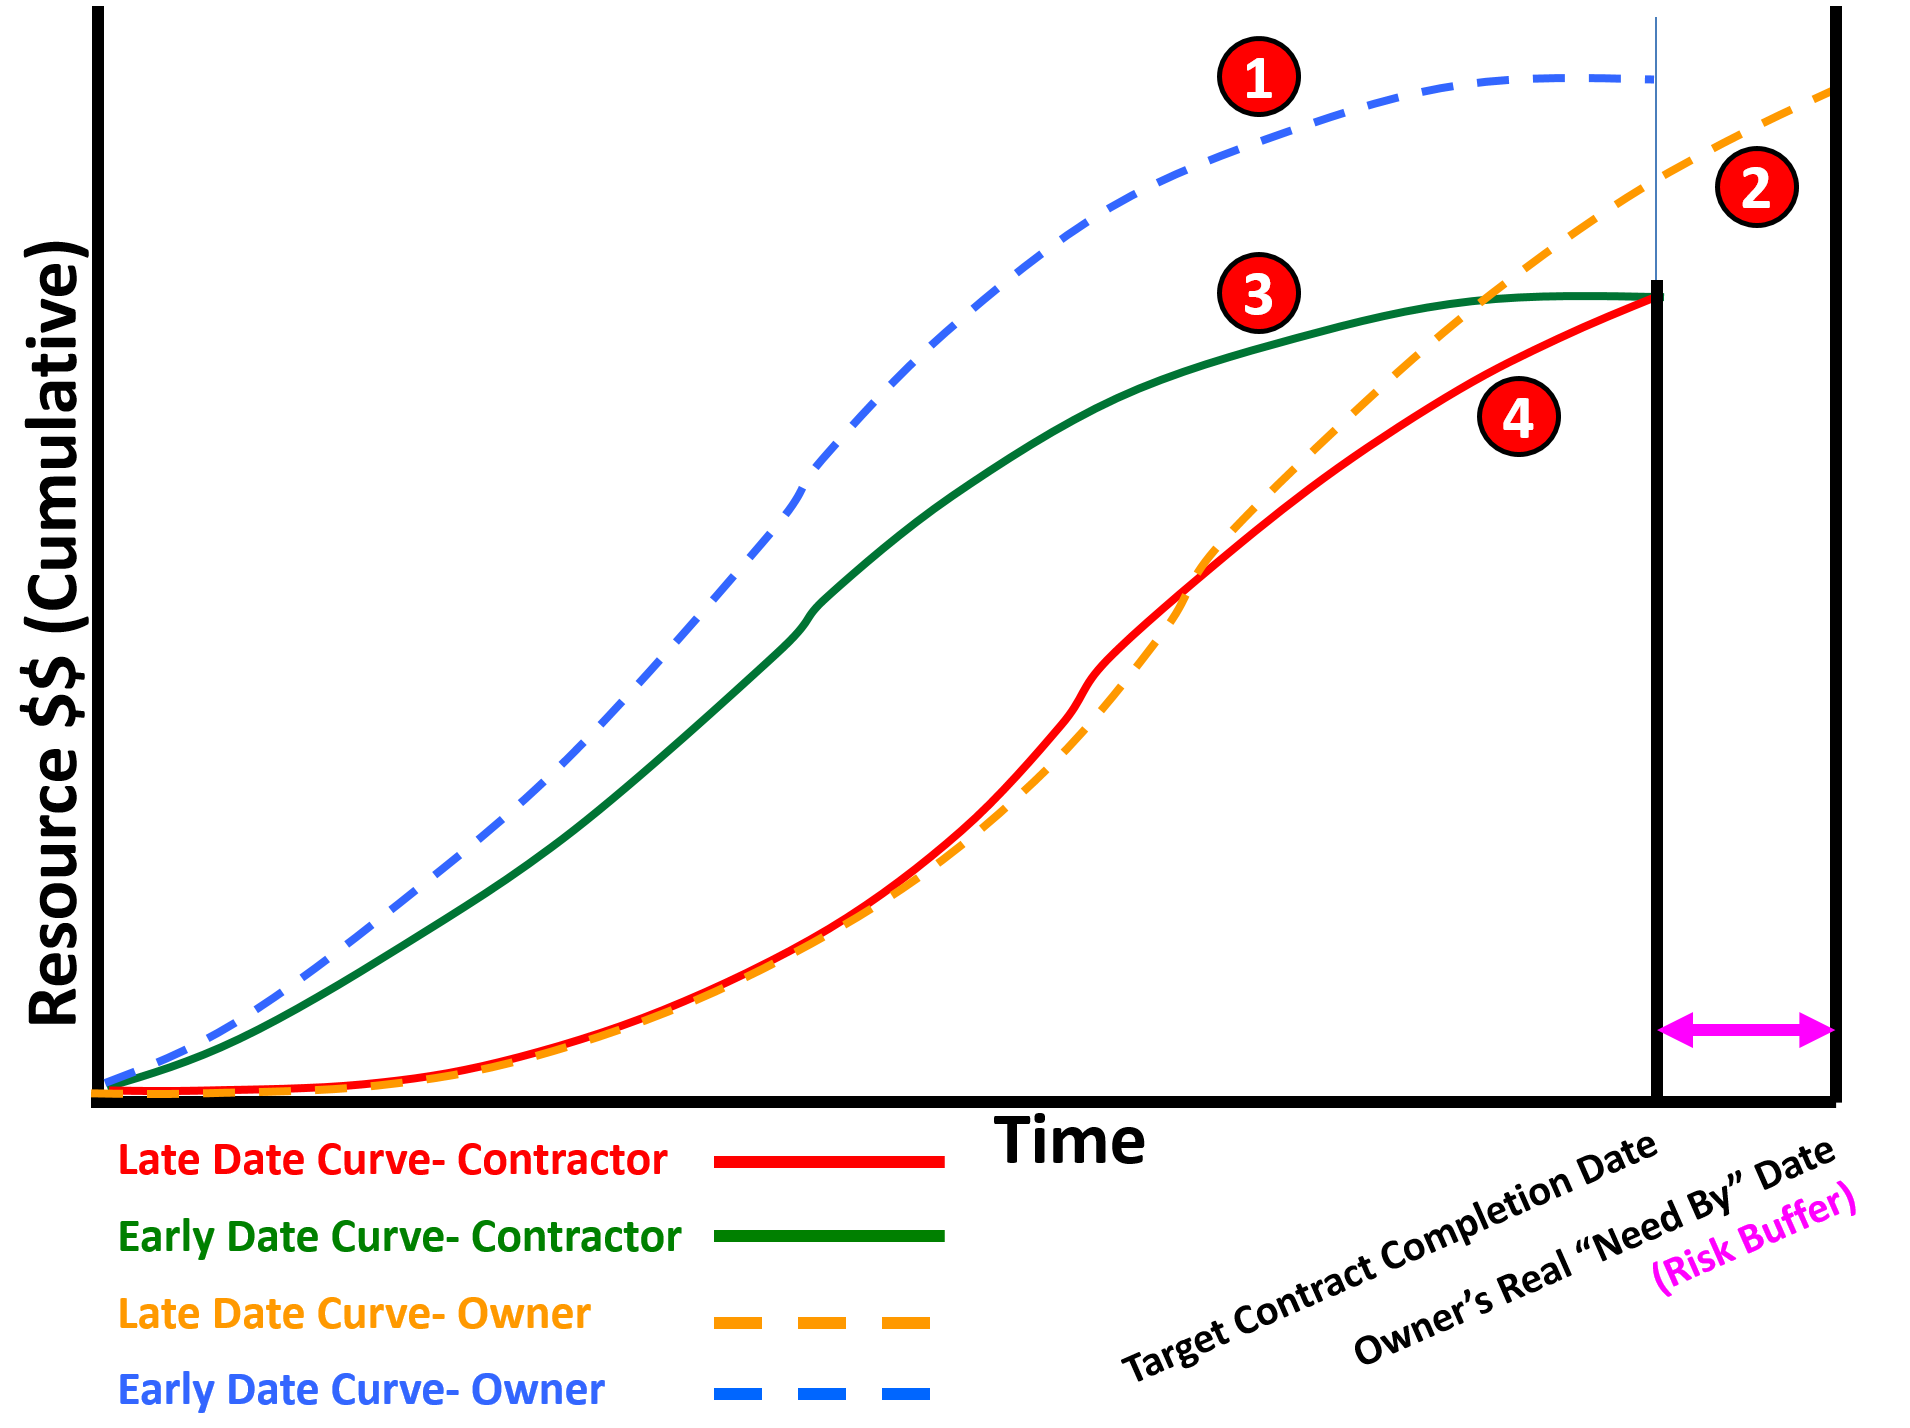
Figure 14 - How Project Control Practitioners Normally View Cost BUDGETS
Source: Giammalvo, Paul D (2015) Course Materials Contributed Under Creative Commons License BY v 4.0
In Figure 14 above, the way project control practitioners normally view or communicate Cost BUDGETS is using the Early and Late Date S Curves. These are generated by COST LOADING each Work Package (Phases 1, 2 or 3 of the Project Life Span) or cost loading each ACTIVITY (Phases 4 or 5) in the CPM Scheduling software, which automatically generates either or both the early and late date curves.
It is important to note that because one of the primary or most important objectives of a CPM schedule is to generate the early and late date “S Curves” or Performance Measurement Baseline (PMB) it requires that for both owner and contractor that every single activity be cost (resource) loaded. Implicit in this, especially for large schedules, that “rolling wave planning” be used to avoid having to produce Level 5 or 6 activities far into the future. Explained another way, for large schedules containing 5,000, 10,000 or more activities, while each and every activity should be cost/resource loaded, by changing the level of detail from greater to lesser the further into the future we get, enables us to generate accurate S Curves (both owner and contractor) without having to cost load each activity down to Level 4, 5 or 6.
Be sure to remember that what the OWNER and CONTRACTOR include in each of these S curves is NOT the same information:
(1) The OWNER’s Early Date Curve is usually set to the same date as the contract completion date, and consists of the CONTRACTORS bid price PLUS the OWNER’s Project OVERHEAD costs (i.e. Project Management, Safety, QA/QC etc) plus any Project DIRECT costs, such as Owner Supplied Equipment or Owner Supplied Materials. The Owner’s S curve also contains any owner identified CONTINGENCY. What the OWNERS S Curve should NOT include is any UNALLOCATED MANAGEMENT RESERVE.
(2) The Owner’s Late Date Curve contains all the cost elements that the early date S curve contains BUT instead of being set to the Contract Completion Date, it is normally set to the owners “real” “need by date” which often contains a “risk buffer” in terms of time.
(3) The CONTRACTORS Early Date Curve includes the following cost elements: a. Direct Costs (Labor, Materials, Equipment and Subcontractors) b. Project Indirect Costs (Project Management, On Site Offices, Electricity, Vehicles and Division 1 costs) c. Contingency (both time and cost) d. Home Office Overhead e. Profit Margin (Contractors Management Reserve) Thus the “COST” loaded schedule the contractor submits to the owner is not the contractors COSTS but his/her SELLING PRICE. The early date curve is set to the CONTRACTUAL COMPLETION DATE, even though in fact the Contractor will be trying to beat that date if at all possible.
(4) The CONTRACTORS Late Date Curve includes exactly the same cost elements that the Early Date curve contains but like the Early Date Curve, the completion date is set to the contractual completion date.
08.1.3.5 - OVERVIEW
Prior to embarking on the exploration of Cost Estimating and Budgeting it is important that we review the definitions of the more common terms which will be used throughout this module.
- Cost Estimate - Is an educated guess as to what something is going to cost in the future. It can be expressed two ways, with the first one being the “better” tested and proven practice: (a) a RANGE of values. (e.g. Labor costs for this project will be between $90,000 to $110,000) Ideally a range estimate also includes a probability showing what the probability is that the actual number will fall between. (e.g. The probability that the Labor costs for this project will be between $90,000 to $110,000 is 95%) or (b) as a single value, in which case a PROBABILITY should go with it. (e.g. Labor costs are estimated to be $100,000, with a 50% probability that amount will not be exceeded) This is NOT a recommended “best tested and proven” practice as the monetary value tends to be remembered but the probability is soon lost or forgotten.
- Cost Budget - Is a cost estimate which has been formally approved or accepted by the appropriate level of management. Ideally, whenever a cost budget is presented to management, the cost estimate is allocated over time, either as a cash flow analysis or as a performance measurement baseline. For owner organizations, the cost estimate allocated over time is include in the Decision Support Package for each phase and when approved, it becomes the target budget for the follow on phase. For contractors, upon being awarded the contract, either with or without negotiations, the contract value per the agreement is the contractor’s budget for that project.
- Project Direct Costs - Is the Labor, Materials, Equipment which is consumed by or embedded into the deliverable required by the contract documents and identifiable with one or more specific Work Packages or Activities. Examples would include concrete, steel, nails and other fasteners and the labor or equipment necessary to install them. Anything that remains with the project deliverables when the project is completed. When shown on a profit and loss statement, these costs are known as “above the line” costs or “Costs of Goods Sold” (COGS) Revenue less COGS = GROSS PROFIT of the project.
- Project Indirect Costs - Those items which are not directly identifiable with any specific work package but are required by one or more clauses in the contract documents. Examples include the project manager, personal safety devices, QA/QC, environmental protection. Any items found in CSI Division 1- General Conditions. When shown on a profit and loss statement, these costs are known as “above the line” costs or “Costs of Goods Sold” (COGS) Revenue less COGS = GROSS PROFIT of the project.
- Home Office Indirect Costs - These are what are known as “General, Sales and Administrative (GS&A) costs” or “below the line” costs. When shown on a profit and loss statement, these are the costs of doing business whether the organization has zero projects or 100,000,000 in revenue. Examples include: CEO’s salary, home office rental, cost estimating and bidding departments, accounting/finance and cost of money, taxes and insurance.) The amount remaining after deducting the COGS and GS&A costs is known either as EBIT (earnings before interest and taxes) or EBITDA (earnings before interest, taxes, depreciation and amortization) A more common name is the NET PROFIT.
- Contingency - Contingency is intended to mitigate or offset the impacts of “known-unknown” risks. These are risk events which have been identified in advance of them happening and should have been included in the Risk Register. There are two types of contingency: Risk Contingency - This covers the impacts of a risk event happening which has been ACCEPTED by either the owner or contractor and has not otherwise been mitigated. An example would be the deductible amount for any insurance policy and Price Contingency - This covers the impacts of any price increases in labor, equipment or materials over the life of the project. (See Escalation below)
- Escalation - Is an amount of money, usually expressed as a percentage of the labor and/or material portion of a contract, designed to offset or mitigate inflation, currency fluctuations or unanticipated labor cost increases.
- Management Reserve - This is an amount of money also often expressed as a percentage of the contract or project value, that is used to offset, mitigate or otherwise cover “Unknown-Unknowns”. Risk events which were NOT identified before they happened. For contractors, the profit margin serves as their “management reserve” while for owners, it is often an amount which is established by their senior management and/or by a government agency. Management Reserve is neither OWNED nor CONTROLLED by the project manager, whether working for an owner or contractor organization. As the name implies it belongs to and is controlled by “Management” at a level higher than the project manager.
08.1.3.5.1 - Challenges Facing Both Owner and Contractor Cost Estimators
As shown in the GAO graphic below there are many challenges and constraints facing planners, schedulers and cost estimators but of all the project management roles and responsibilities, cost estimating is one of the functions which is just as much art as it is science. Why? Because cost estimating is little more than being able to take an educated guess as to what something is going to cost 6, 12, 24 or even 60 months from now.
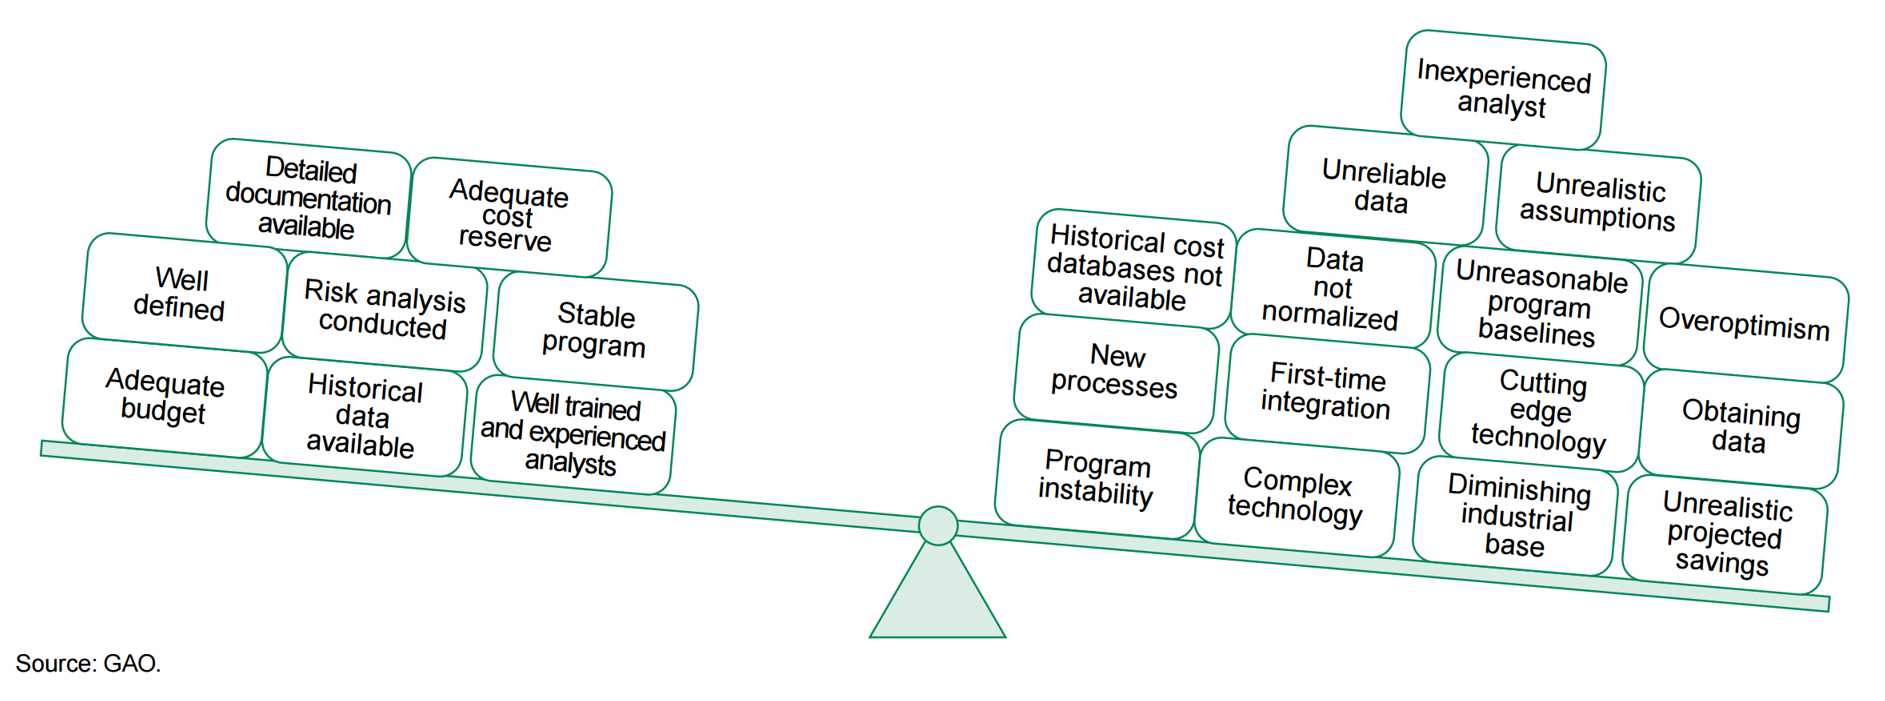
Figure 15 - Illustration showing the Challenges Cost Estimators Face, whether working for Owner or Contractor Organizations
Source: GAO Cost Estimating and Assessment Guide Best Practices for Developing and Managing Capital Program Costs (2009)
08.1.3.5.2 - Types of Cost Estimates and Their Uses
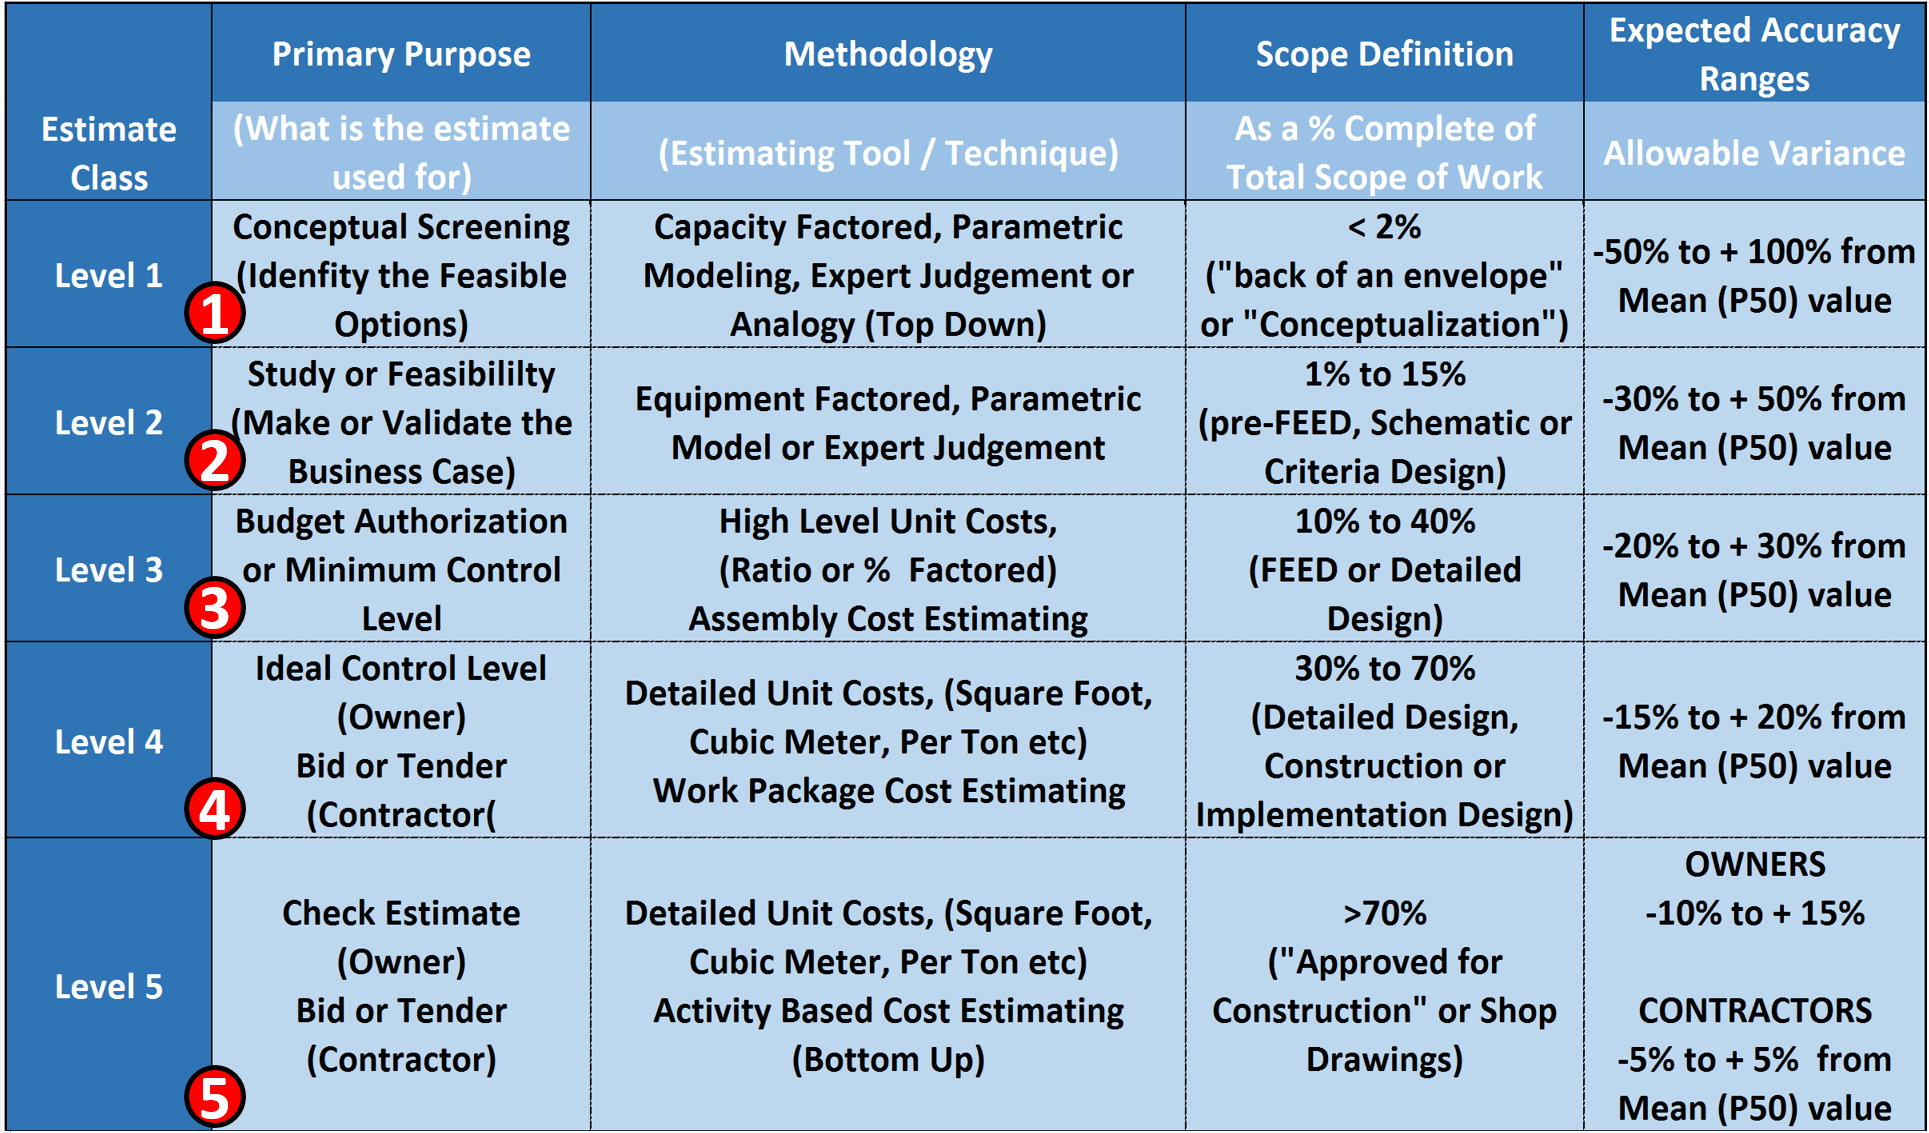
Figure 16 - The Purpose of the Estimate, the Tools & Techniques normally used, appropriate Scope Definition and Expected Accuracy Ranges
Source: Adapted from Adapted from DoE Cost Estimating Guidelines
(1) Level 1 cost estimate is intended to help management decide, of several possible alternative solutions to a problem or opportunity, which ones might be the most cost effective. Generally speaking, costs alone are not the determining factor but some combination of factors. (Multi Attribute Decision Making). For this level of cost estimate, the most commonly used tools/techniques are Capacity Factored, Parametric Modelling, Expert Judgement or other “Top Down” methods. (Analogy). For this level of cost estimate, there is little or no scope defined and the cost estimator needs to be able to document, explain or justify a mean number with an acceptable range of accuracy between +100% to -50%.
(2) Level 2 cost estimate is intended to help management decide from more than one option, to select the single “best” solution to an opportunity or problem. This is based on a calculated business case comparing the top 2-3 options or alternatives. For this level of cost estimate, the most commonly used tools/techniques are Equipment Factored, Parametric Model or Expert Judgement. For this level of cost estimate, the scope is what the oil, gas and mining sector calls “Pre-FEED” design. (FEED = “Front End Engineering and Design”) and is also known in general construction as “Schematic” or “Criteria” design. In a Level 2 cost estimate, the cost estimator needs to be able to document, explain or justify a mean number with an acceptable range of accuracy between +50% to -30%.
(3) Level 3 cost estimate is where an owner organization goes to their shareholders or to the relevant government agency to get approval for the project and to have funds committed or set aside to do this project. In many sectors, this is known as the “AFE” or “Approved for Expenditure”. While this level of cost estimate is normally prepared in house by the OWNER’s project control team, if the owner is outsourcing this work under an “Engineer, Procure and Construct” (EPC), a “Design Build” (DB) or any of the collaborative contract types (i.e. Integrated Project Delivery (IPD), then the owner and the contractor work together to create this cost estimate. Many times this is the level of budget that the owner’s project control team REPORTS against, which means that consistent with our rule of thumb that we TRACK one level deeper than we are reporting and CAPTURE field data 2 Levels lower than we are reporting, means the project control team needs to be TRACKING at Level 4 and capturing cost data at Level 5. For this level of cost estimate, the most commonly used tools/techniques are High Level Unit Costs, (Ratio or % Factored) or Assembly Cost Estimating. For this level of cost estimate, the scope is what the oil, gas and mining sector calls “Front End Engineering and Design” or simply FEED, and is also known in general construction as “Detailed” design. In a Level 3 cost estimate, the cost estimator needs to be able to document, explain or justify a mean value with an acceptable range of accuracy between +30% to -20%.
(4) Level 4 cost estimate is normally NOT prepared by an OWNER but is based on the BIDS RECEIVED as prepared by CONTRACTORS as part of the competitive bidding process. This level of cost estimate is known as a “Bid” or “Tender” or “Committed” cost and for those owners for whom cost is a concern, is the ideal or preferred level to be TRACKING costs at to report one level higher. For this level of cost estimate, the most commonly used tools/techniques are Detailed Unit Costs, (Square Foot, Cubic Meter, Per Ton etc) or Work Package Cost Estimating. For this level of cost estimate, the scope is normally known as “Detailed Design” and comes from the level of detail found in the bid package. In a Level 4 cost estimate, the OWNER’s cost estimator needs to be able to document, explain or justify a mean value with an acceptable range of accuracy between +20% to -15%. Because the CONTRACTORS normally work on single digit EBIT margins, their cost estimating accuracy range needs to be +/- 5%
(5) Level 5 cost estimate is almost always prepared by a Contractor and is often not seen by the owner at all as this is the CONTRACTORS COSTS and not his/her selling price. This level of cost estimate is based the historical cost database which is proprietary and confidential to CONTRACTORS because this is their competitive advantage over their competition. This level of cost estimate is known as a “Bid” or “Tender”” COST. This is the level of detail that the CONTRACTOR will be REPORTING costs which means they will be tracking at the ACTIVITY LEVEL and capturing costs on a daily basis one level deeper. (Labor, Equipment, Materials and Subcontractors) For this level of cost estimate, the most commonly used tools/techniques are Detailed Unit Costs, (Square Foot, Cubic Meter, Per Ton etc) using Activity Based Cost Estimating (Bottom Up) or Work Package Cost Estimating. For this level of cost estimate, the scope is normally known as “Detailed Design” and comes from the level of detail found in the shop drawings or other installation drawings or written instructions. In a Level 2 cost estimate, the OWNER’s cost estimator needs to be able to document, explain or justify a mean value with an acceptable range of accuracy between +15% to -10%. Because the CONTRACTORS normally work on single digit EBIT margins, their cost estimating accuracy range needs to be +/- 5%
08.1.3.5.3 - Cost Estimating Processes (Owners and Contractors)
As projects for an OWNER are investment or cost centers, a project is undertaken to either solve a problem or exploit an opportunity. Thus for an owner, the project is nothing more than the means to an end.
Which explains why an owner is looking not so much at the project but what strategic business outcomes the project was undertaken to achieve or accomplish. Explained another way, OWNER organizations undertake projects as either COST or INVESTMENT centers, for the sole and only purpose of acquiring, creating, updating, expanding, maintaining and eventually disposing of ASSETS while for a CONTRACTOR, a project is a PROFIT CENTER.
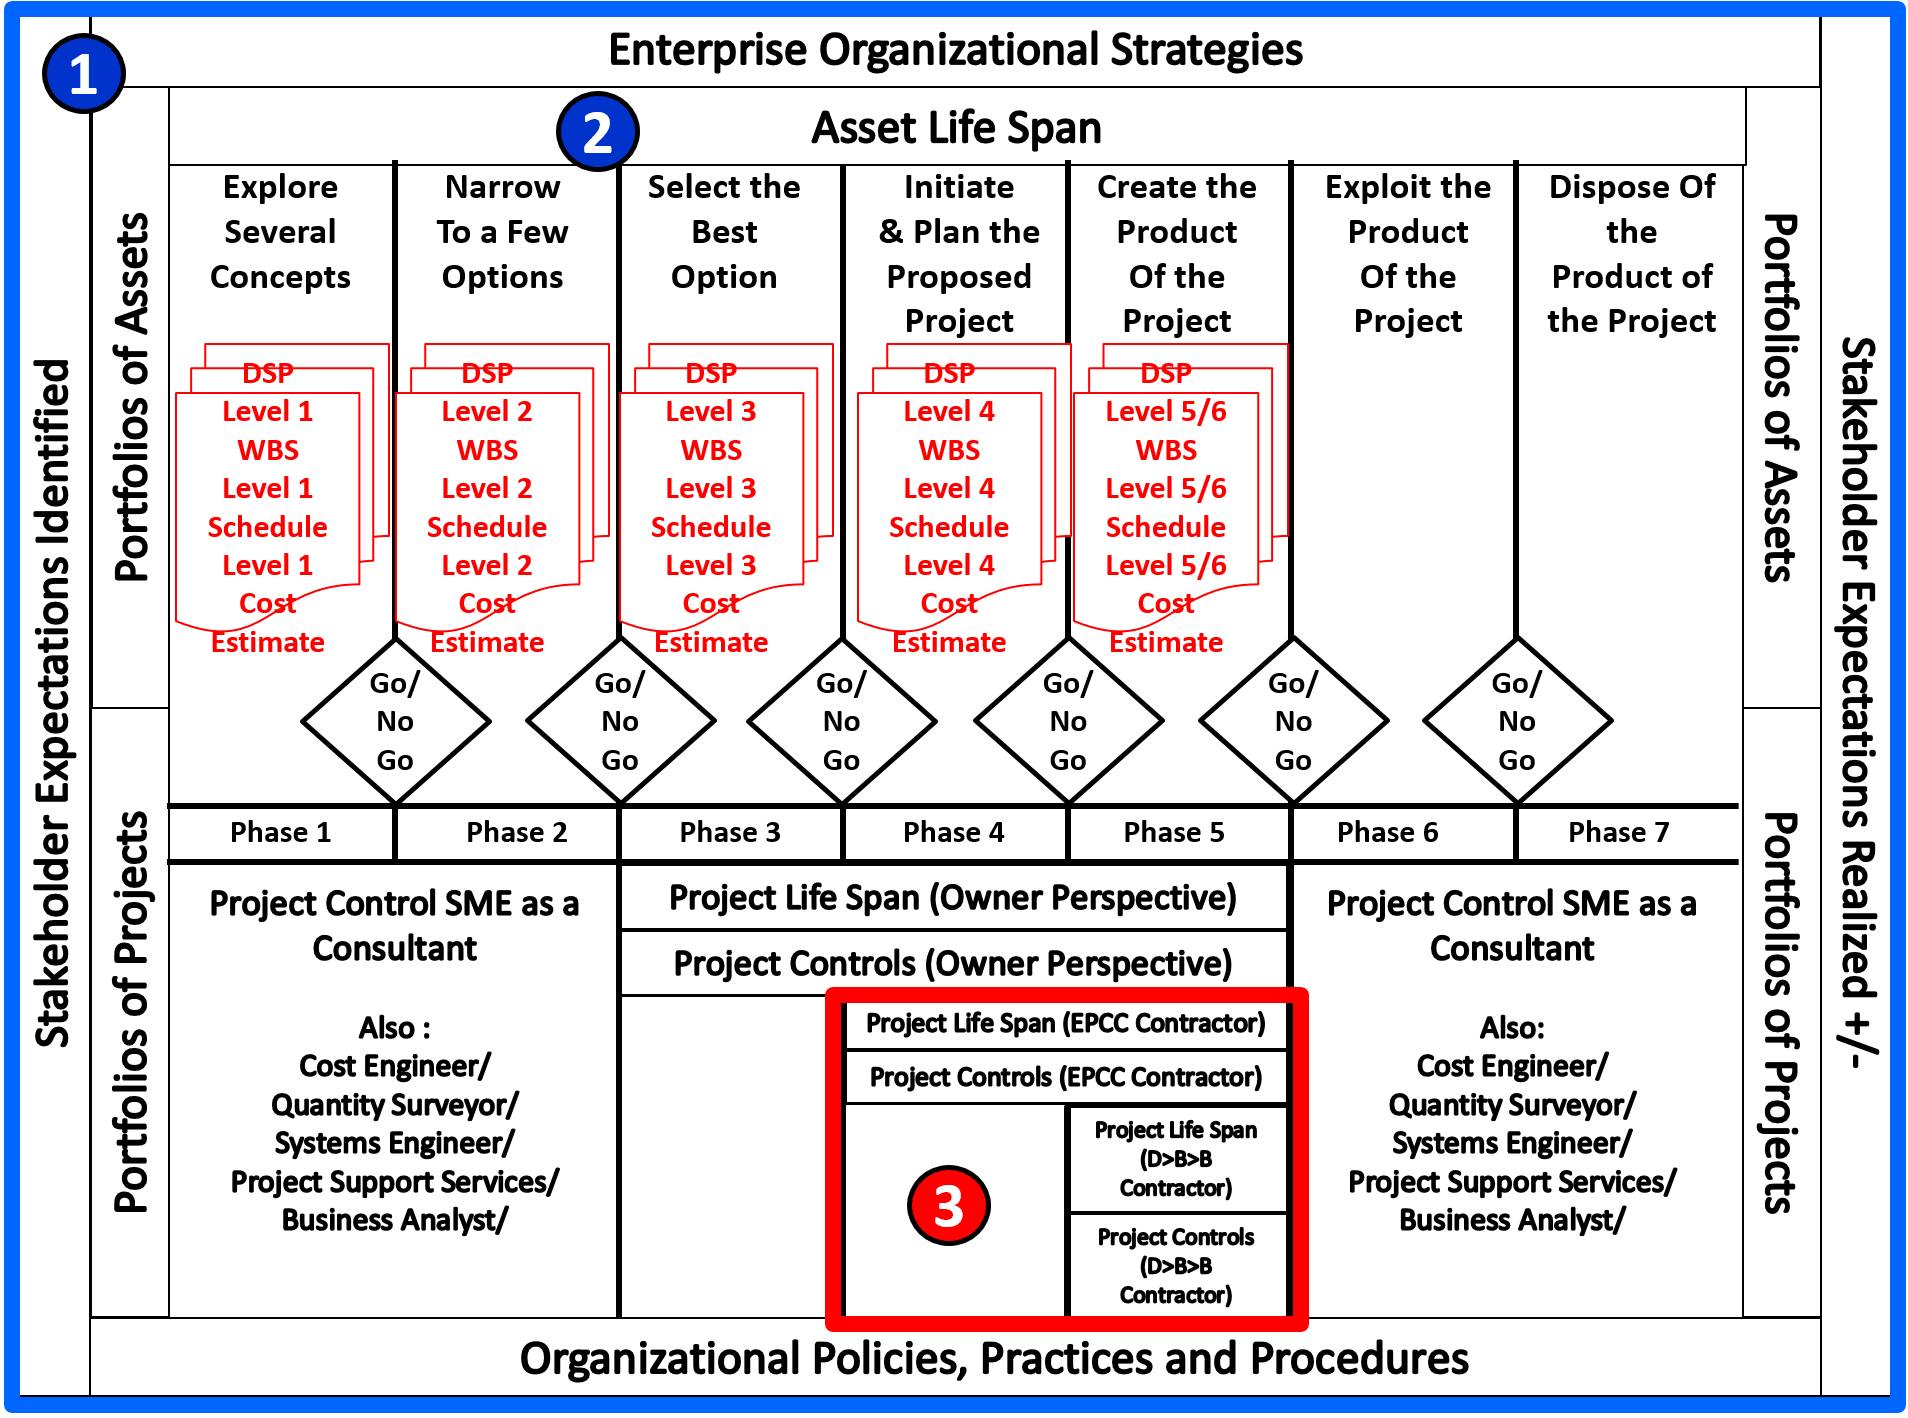
Figure 17 - Owner’s Perspective vs Contractor’s Perspective of a Project (For a more detailed explanation of this graphic, see Module 1)
Source: Giammalvo, Paul D (2015) Course Materials. Contributed Under Creative Commons License BY v 4.0
(1) Owner organizations undertake projects as COST or INVESTMENT centers for the purpose of achieving or realizing strategic business outcomes- either solutions to problems or to exploit new opportunities. Thus for an OWNER organization, projects are nothing more than the “means to the end”. Thus the OWNER’s view of a “project” encompasses everything within the Blue outline. Conversely, the CONTRACTOR’s perspective of a project is most often limited to the area defined by the MAJENTA outline.
(2) In an OWNER organization, what is important is the acquiring, creating, updating, expanding, maintaining and eventually disposing of ORGANIZATIONAL ASSETS, and to do this, owner’s use project management as the delivery system of choice.
(3) For a CONTRACTOR, projects are a potential PROFIT center. That is, CONTRACTORS are in the business of planning, executing, controlling and closing projects for the sole purpose of making money in doing so. Whether the PRODUCT of the project fulfils the Owner’s objectives if of little concern much less within the control of the contractor. Thus the CONTRACTOR’s perspective of a project is most often limited to the area defined by the MAJENTA outline.
Coming from our Risk Analysis, we know that the focus of each phase changes:
- Phase 1- Identify or FEL1 we are focusing on BUSINESS COSTS (the business case)
- Phase 2- Assess or FEL2 we are focused on TECHNICAL COSTS (which process/equipment is the most cost effective to use)
- Phase 3- Select or FEL3 we are focused on PROCUREMENT COSTS (long lead items)
- Phase 4- Define or FEL4 we are focused on CONSTRUCTABILITY COSTS (which is the best or most cost effective way to construct this project?)
- Phase 5- Execution we are focusing on the COSTS OF DOING THE WORK. As this is the world of the contractor and given that the direct costs are substantially the same for all contractors, the only real variable lies in the Project and Home Office Overhead costs. Explained another way, assuming there are no mistakes in the quantity take off, given that the labor, material and equipment costs are substantially the same for all bidders, the only competitive advantage one contractor has over another is how well they can manage and control the project and home office indirect costs.
Given that the Guild of Project Controls is attempting to satisfy the needs of both OWNERS and CONTRACTORS, in Figure 17 above, we are demonstrating from the OWNER’S perspective, what the WBS, Schedule and Cost Estimating Levels need to be developed and included in each Decision Support Package (DSP) as we move from one phase to another.
Figure 17 above illustrates clearly that scope definition (WBS development), and with it the CPM Schedule, Cost Estimates are all progressively elaborated and included in the Decision Support Package (DSP) as the project passes through each phase gate, Along with the schedule and cost estimates, there should be a section in the DSP for risks (See Module 4- Managing Risks & Opportunity) and an analysis of available resources as well.
Figure 18 below, when combined with the high level Asset and Project Life span development graphic above, helps to explain how we can use the Omniclass Table 22, Work Results (CSI’s Masterformat) as the “checklist” to ensure that our WBS contains the elements at the appropriate level of detail as the project evolves and becomes progressively elaborated as it passes each phase gate approval..
For those owner organizations beset by numerous change requests, if you were to take a more structured approach, using a standardized WBS (such as Omniclass or Norzok Z-014) as your scope checklist, you could reduce the number of change orders coming from your contractors AND you would receive bids which fall within a much smaller range, because the less your contractors have to guess what it is you want, the lower the amount of contingency they have to include in their bids.
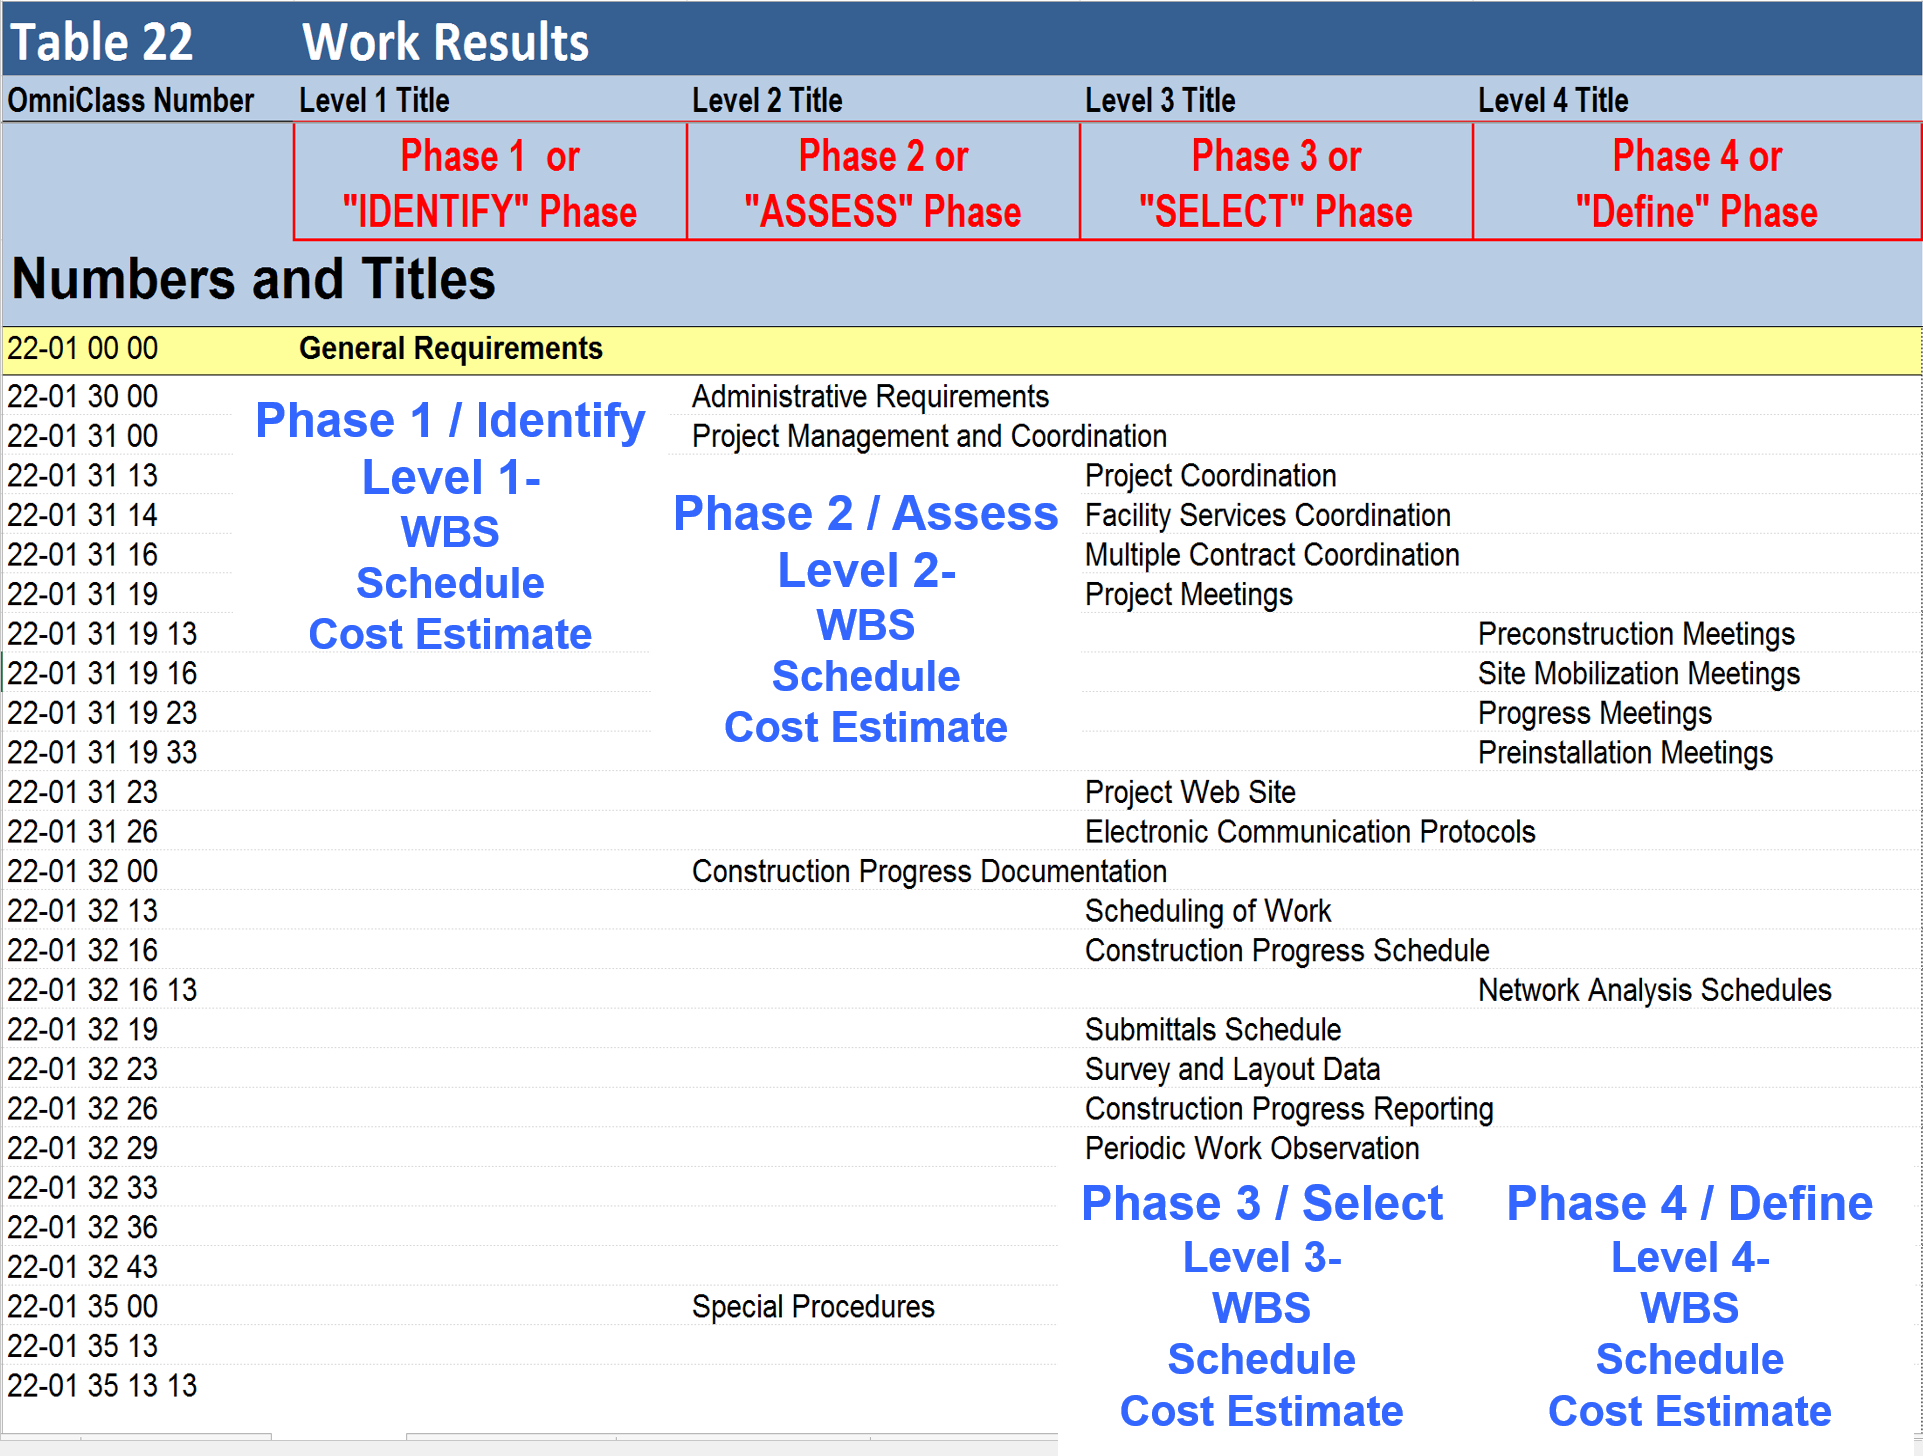
Figure 18 - Showing the PROPOSED numbering conventions mapped against Omniclass Table 22- Work Results
Source: Omniclass Tables (n.d.)
08.1.3.5.3.1 - OWNER PERSPECTIVE
For OWNER organizations, which we have defined to be any entity, be it public or private sector for whom the project is a COST or INVESTMENT center (cash out) and who expects to generate revenue, savings or other benefit not from the project but from whatever product, service or business result the project was undertaken to create, the GPC is advocating that we adopt or adapt the GAO’s model.
In that context, here is the overall process map, understanding that these processes from Module 2.8.1 through 2.8.6 are not a “one time” event, but are applicable to each phase in the asset life span until the start of the Execute Phase, when the “real work” commences, invoking the start of Module 9 - Managing Project Progress; Module 9.2 - Capturing Progress & Updating the Schedule, Module 9.3 - Assessing and Interpreting Progress Data and Module 9.4 - Project Performance Forecasting are applied. They also apply to the “Operate” phase as in an asset centric approach, we need to not only acquire or create the asset, but once the asset is created, we need to update, expand, repair and maintain the asset until such time as we need to dispose, dismantle or decommission it.
The basic process flow for cost estimating and budgeting comes to us from the GAO’s Best Practices in Capital Budgeting. It is an owner’s perspective which means it is a top down process. While the GAO does not specifically require a phased approach, the Guild of Project Controls has expanded upon what the GAO is advocating by applying the same phase gate approach used in Module 7- Managing Planning and Scheduling.
In Figure 19 below, we can see the GAO’s process and this is the same process which we need to apply as part of each Phase Gate, including the approved budget as part of each Phase Gate Decision Support Package.
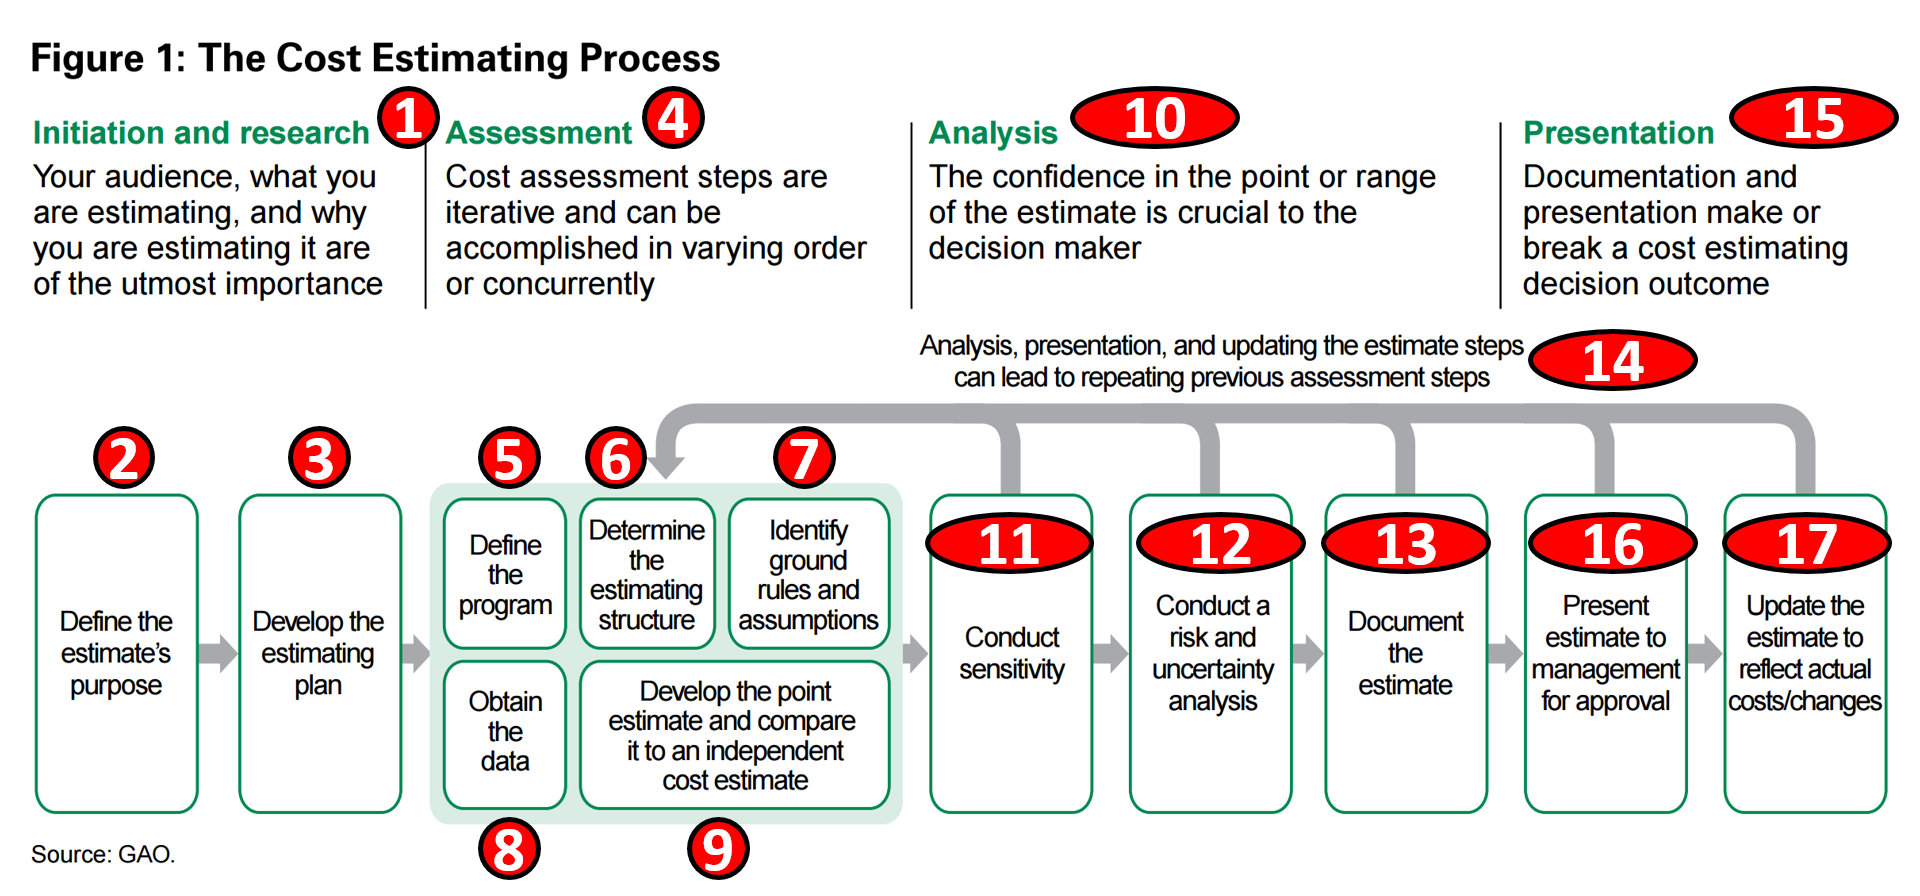
Figure 19 - GAO Process Map Showing a typical OWNERS Cost Estimating Process
Source: GAO Cost Estimating and Assessment Guide Best Practices for Developing and Managing Capital Program Costs (2009)
(1) Step 1- Initiation and Research- this is where you look at the stakeholders, what it is they need and want, and why are you estimating it. This is also where portfolio management becomes important, keeping in mind that for most Owners, projects fall into 4 broad categories:
- Revenue Generating or “Top Line” Projects - Sales and Marketing Initiatives, New Plant Construction (Capital Investment)
- Mergers/Acquisitions/IPO’s (New Market Penetration)
- Cost Containment or “Bottom Line” Projects - Reorganizations, Outsourcing, Enterprise Software Solutions, Process Reengineering, Project/Program/Portfolio Management Offices
- Government Mandated Projects - SOX/BASIL II, Environmental Protection
- Labor Law Compliance
- Community Service or “Good Will” Projects
Given most organizations have limited assets (resources), they need to deploy them where those resources will return the greatest return on assets (RoA) and as these project are all competing for this scarce or limited pool of assets, we need to manage BOTH our portfolios of ASSETS and portfolios of PROJECTS efficiently..
(2) Step 2- Once we know WHAT we are estimating, then we need to understand WHY we are estimating it. Figure 16 Showing the Purpose of the Estimate, the Tools & Techniques normally used, the appropriate Scope Definition and the Expected Accuracy Ranges provides us with what we need to know in the first column.
(3) Step 3- The next step is to develop the estimating plan. Again looking above to Figure 16 Showing the Purpose of the Estimate, the Tools & Techniques normally used, the appropriate Scope Definition and the Expected Accuracy Ranges, we can see in Column 3 that the degree of scope definition tells us what tools and techniques we should be using, as well as what are the acceptable ranges of accuracy we can reasonably expect to deliver to our stakeholders.
(4) Step 4- You now know WHAT you are estimating, WHY you are estimating it and you have a PLAN in place to use the tool/technique appropriate to the level of scope and you know what your accuracy ranges are. Which means you have to VALIDATE that the level of scope definition is appropriate for you to use the chosen tools and techniques. To do this, you need to check the scope of work against a STANDARDIZED WBS structure, such as Omniclass Table 22 Work Results or Norsok Z-014 for offshore oil and gas or any one of a number of sample WBS structures shown in Appendix IX.
(5) Step 5- Define the Program. This is why we advocate using Omniclass sort coding structures as the basis for our SCOPE QUALITY CHECKLIST to see if any scope has been missed.
(6) Step 6- Define the Estimating Coding Structure. This is why it is so important that the owner define the way they want the contractors to code the bid information. By the Parks department standardizing on CSI Uniformat/Omniclass Table 21, they can collect real time cost information which from every project they are running and are able not only to see if the contactors are cheating them by “unbalancing” the bid, but also can run statistical analysis using the data to create regional cost indices as well as spot emerging cost trends. This is the time to decide what those coding structures are going to be, understanding that IF the owner wants to be able to “roll up” the cost information then it is up to us to provide those field names and coding structures to the CONTRACTORS in the bid documents. If we fail to specify what field names and coding structures we want them to use, contractors will opt for their own coding structures.
To provide an example of this, in the example above from the US Parks Department, in their contract documents the Parks Department provide the contractors with the TEMPLATES they want the contractor to use and also specify how the Contractor has to summarize their cost data. In the example above and to the right, they chose CSI’s Uniformat which is now Omniclass Table 21.
(7) Step 7- Identify ground rules (i.e. which databases are valid and which are not) as well as any CONSTRAINTS (i.e. remote site meaning workers have to be housed on site in man camps) and ASSUMPTIONS (i.e. use inflation rate of 3% per annum over the life of the contract) This step is very important as the more closely the stakeholders can define the specific project, where it will be executed, under what conditions, during what time of the year are critically important if we want to ensure that our cost estimators are able to develop accurate, reliable and precise cost estimates.
If we look at Figure 19 GAO illustration showing the Challenges Cost Estimators Face, whether working for Owner or Contractor, it will provide us with a handy checklist of constraints and assumptions which need to be addressed as we develop the cost estimate.
In the figure below, we can see yet another “best in class” example of how an owner has provided the contractor with the allowable constraints and assumptions they expect the contractor to be using in calculating the quote. As this was a “cost plus” contract the owner can get away with this, but if the contract was being let on a “firm fixed price” basis, this template also works very well for a Contractor to use.
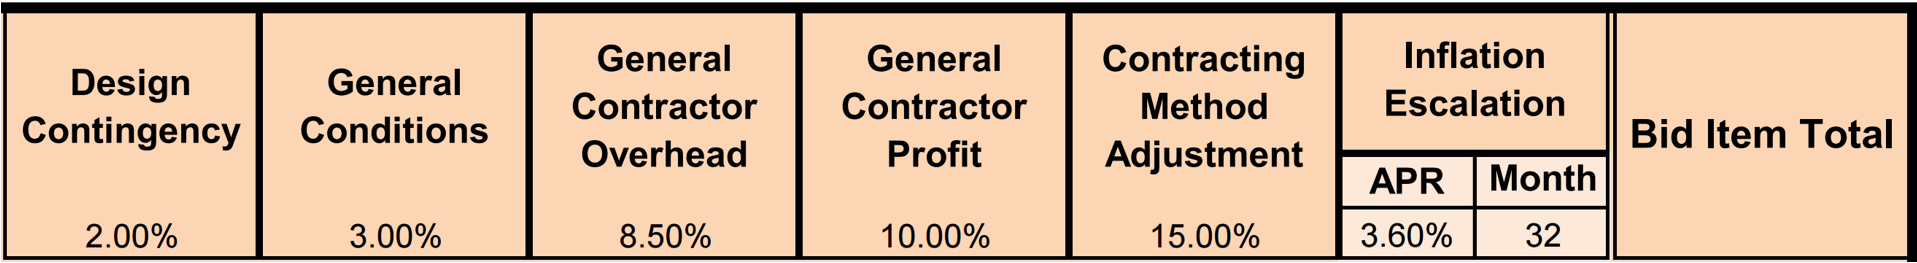
Figure 20 - Showing how the US Parks Department Provided a List of ASSUMPTIONS and CONSTRAINTS
Source: US National Park Service Cost Estimating Handbook (2011)
Whether the owner requires them to be shown or not these are typical “constraints and assumption” that both owners and contractors have to make when creating cost estimates.
(8) Step 8- Obtain the Data. As noted above, ideally, this will information will be available from the owner’s internal database, but if not, then there are many commercial databases available for just about any country or region and for just about any type of project.
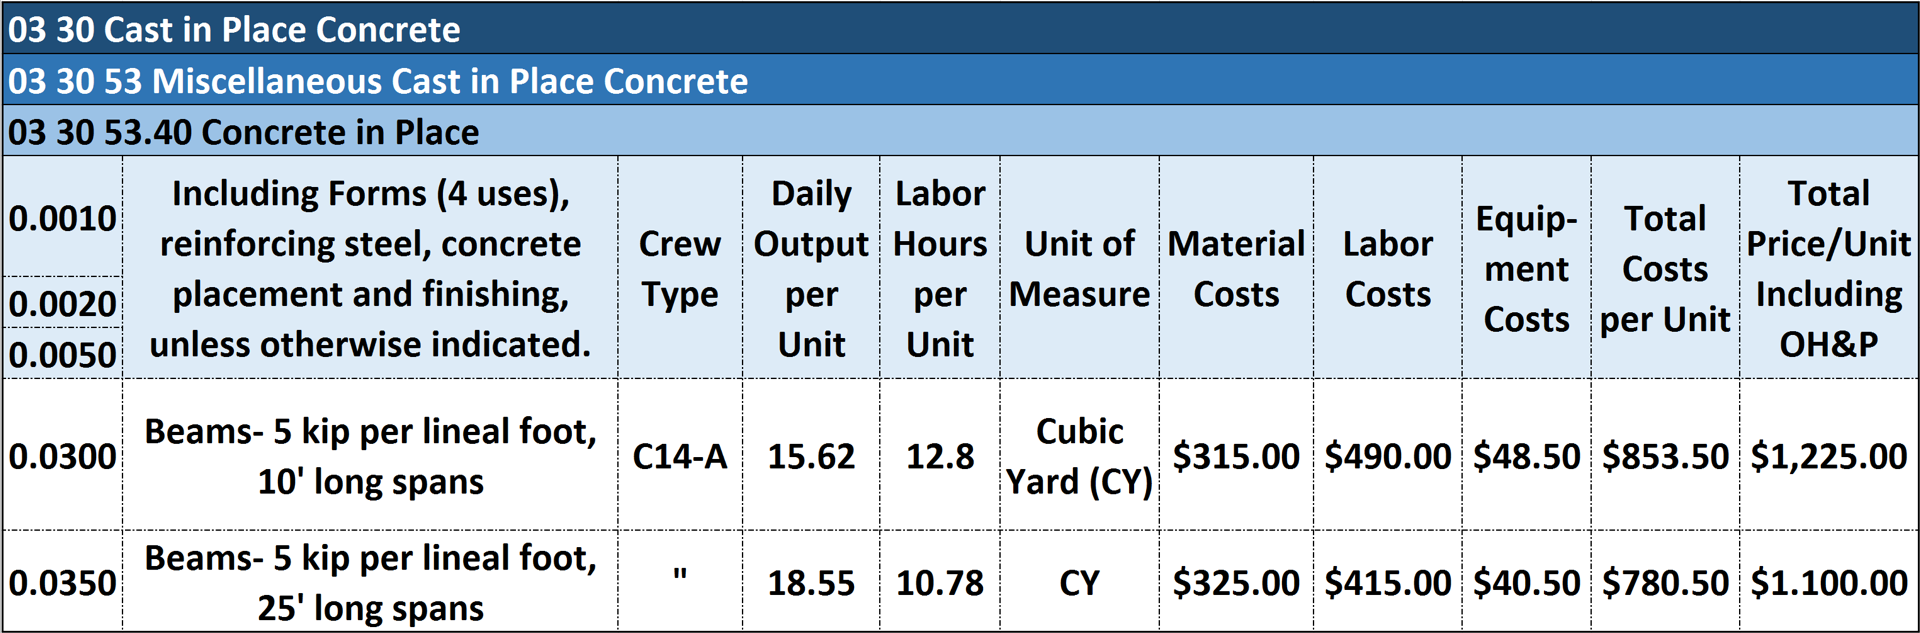
Figure 21 - Illustrating an example of a commercial database
Source: Giammalvo, Paul D (2015) Course Materials. Adapted from R.S. Means 2008 Facility Cost Estimating Database Crew C-14A. Contributed Under Creative Commons License BY v 4.0
The example above will be explained in greater detail under the heading of “Tools & Techniques”, but for now, suffice it to say that this example, which is coming from RS Means, shows the use of CSI’s Masterformat /Omniclass Table 21, down to Level 6 detail.
(9) Step 9- Develop a Point Estimate and Compare it against an Independent Estimate. What this is telling us is that OWNERS we need to develop a single number, usually a P50 or Mean value. HOWEVER, because there is a DANGER that once a single number is published, that it sticks in people minds and eventually becomes fact. To fix or address this, SINGLE VALUES should NOT be used UNLESS they come with a Probability attached. In other words, using the example above, the $1,225.00 number in the first line should also state AVERAGE, MEAN or P50. This is why in the examples above, ranges were shown for each level of estimate.
(10) Step 10- Analysis. This is the step where we run a series of tests or simulations to develop the evidence to support the point estimate as well as the acceptable ranges around that point estimate.
(11) Step 11- Conduct a Sensitivity Analysis. There are many tools and techniques we can use to run sensitivity analysis, with Spider Graphs and Tornado Diagrams being the most common. We will explore each of them later on in the section on Tools and Techniques, but what we are trying to identify is which cost elements have the biggest impact on the costs.
(12) Step 12- Add in Contingency and Buffers. Once we find out which items have the greatest impact on the cost (cost critical) then we need to run simulations and build in the appropriate COST CONTINGENCY or COST BUFFERS. This raises the confidence level or probability from P50 which is what the baseline or target cost is based on to whatever probability or confidence level that management is comfortable with. (Usually P75 to P90)
(13) Step 13- Having run through steps 1-12, we now have enough evidence to BACK UP or SUPPORT our recommended cost estimate to the appropriate decision makers.
(14) Step 14- We also need to understand that Steps 5-17 are ITERATIVE and that at any point in the process we may have to go back and revise the scope, timing, process or other variable to get the costs to within a budget which makes the business case possible. IF we are not able to execute the project for an amount which validates the business case, then the project is cancelled or postponed until such time as one or more of the variables has changed sufficiently to make the project once again viable.
(15) Step 15- There two primary or major decision points where we, as cost estimators, will be expected to present our documented cost estimates for management approval. The first is part of the Decision Support Packages (DSP) which occur at each Phase Gate Review. The final and arguably enough, the most important one, is the support and approval of the Performance Measurement Baseline (PMB) which is shown above in Figure 14 How Project Control Practitioners Normally View Cost BUDGETS. This forms the basis for both owner and contractor progress reports once the project has been approved to commence work. (Notice to Proceed (NTP) for External Projects or Project Charter for Internal Projects)
(16) Step 16- This is where we actually submit the documented cost estimate for approval, rejection or revision to the appropriate level of management. Notice that they too can reject the number in which case, we need to go back to Step 5 and start all over again, understanding that no matter how much management may want to cut costs, in some cases it just may not be possible to achieve what they want in the time frame allowed, in which case as professionals we have to be willing to recommend that the project be cancelled or deferred.
(17) Step 17- Assuming the Performance Measurement Baseline was approved, and the NTP or Project Charter has been issued, work commences and we now update and report as shown in Module 9 - Managing Project Progress.
08.1.3.5.3.2 - CONTRACTOR’S PERSPECTIVE
For Contractors, who we define to be any organization, usually coming from the private sector, for whom projects are PROFIT centers- that is, any organization who derive all or a substantial portion of their annual revenue or other business objectives from planning, executing, controlling and closing projects, the Guild of Project Controls is advocating that they adopt or adapt the ASPE process flow chart as being a “best tested and proven” cost estimating and budgeting process. While we have been focusing on developing a process flow chart for OWNER’s as promised here is a process flow chart for CONTRACTORS as well.
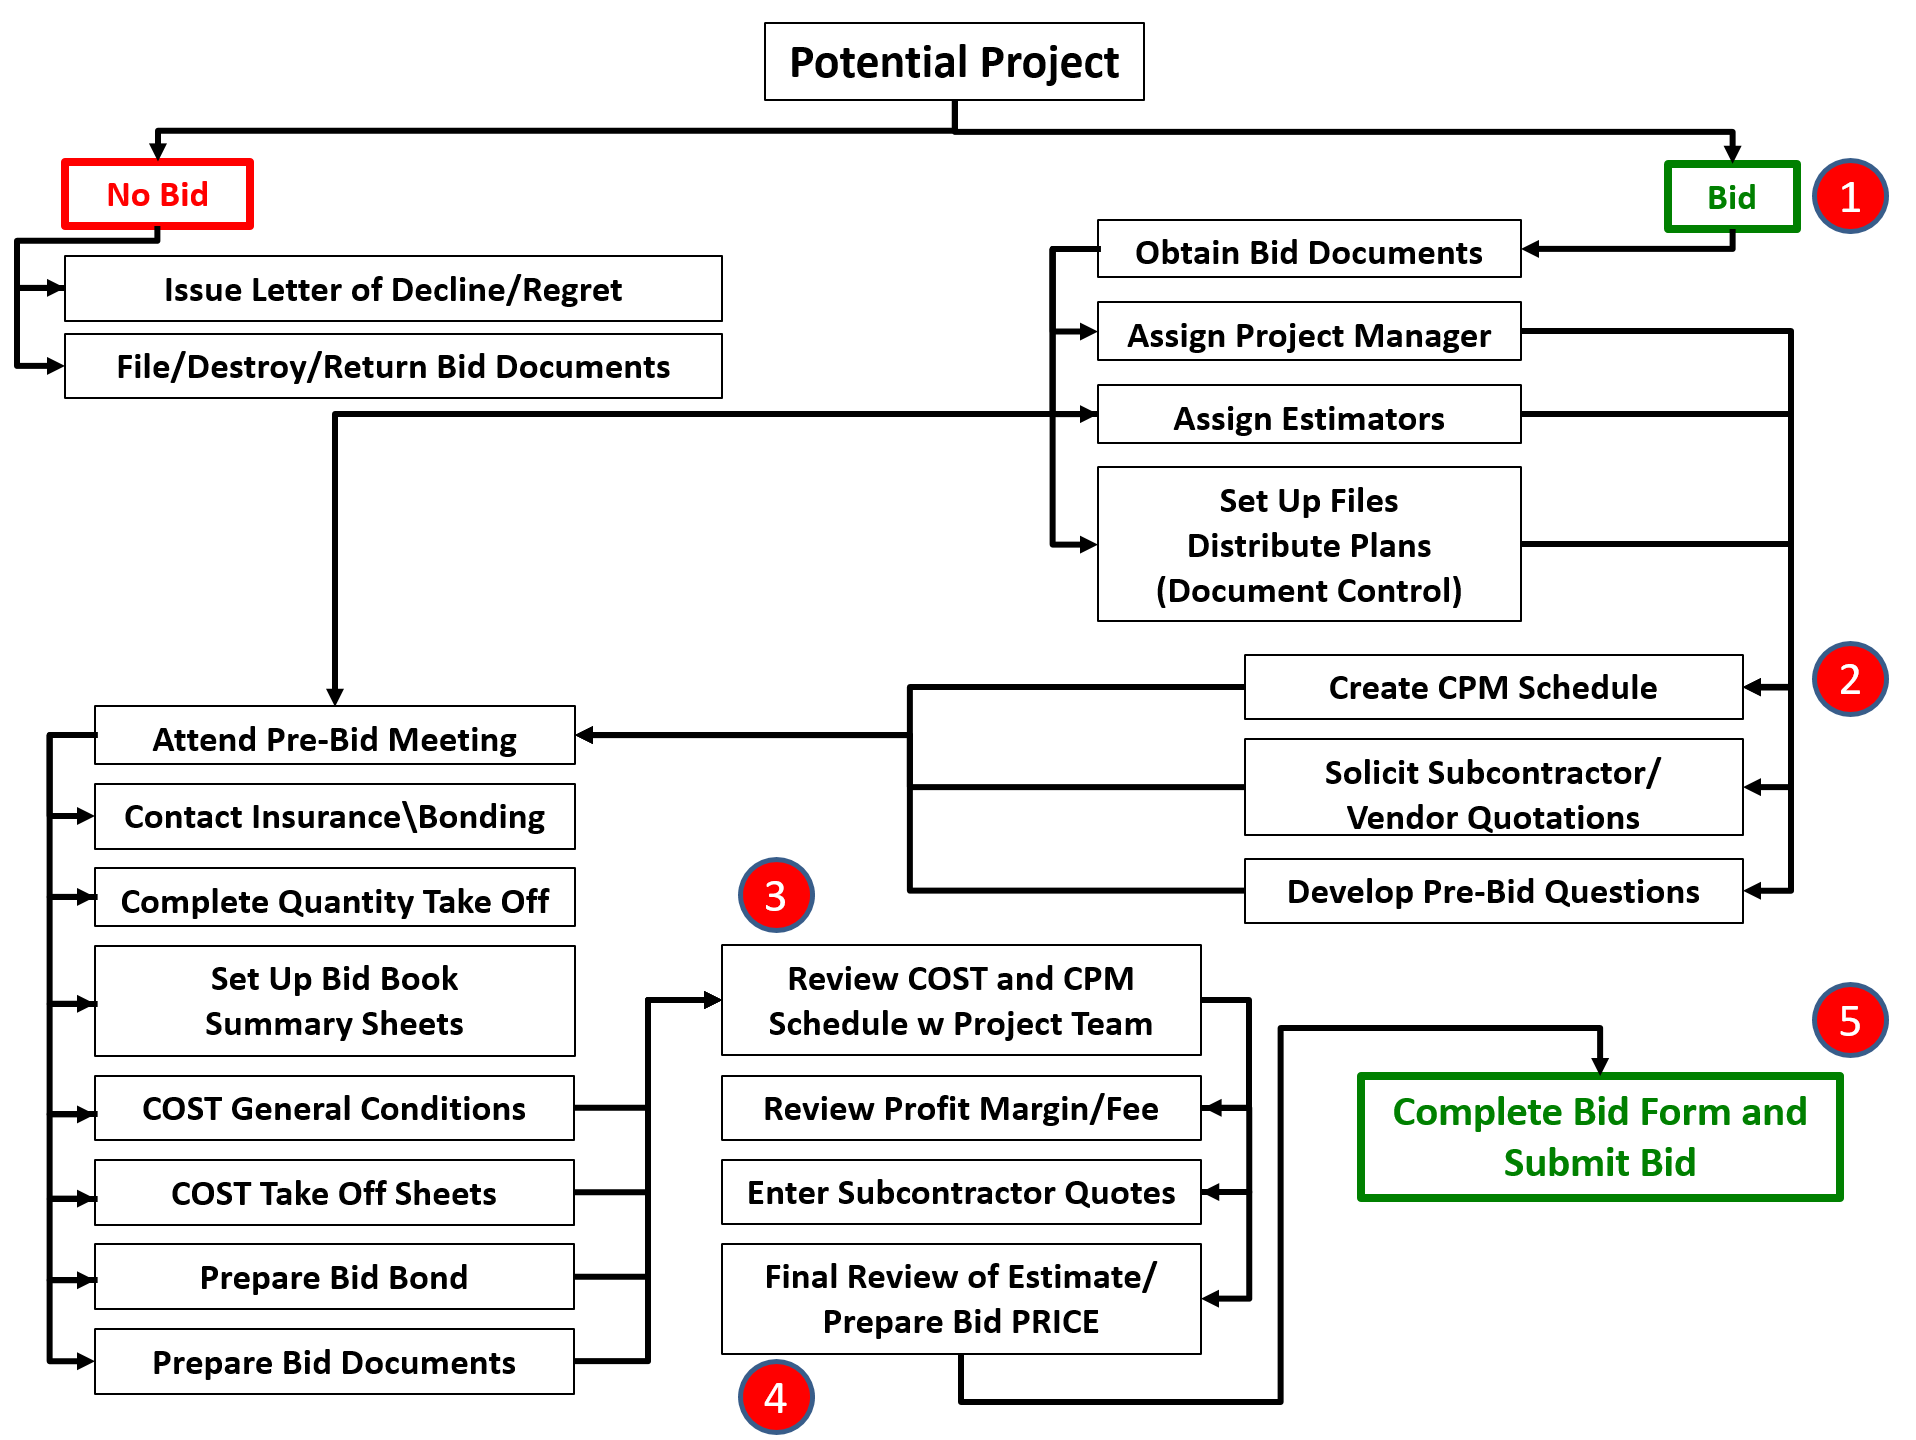
Figure 22 - American Society for Professional Estimators (ASPE) Standard of Practice
Source: Adapted from the American Society for Professional Estimators (ASPE) Standard of Practice
While the model is pretty much self-explanatory, there are several important points worth discussing.
(1) Bid/No Bid decision- Given that contractors by definition are in the contracting business to make money, there has to be a compelling reason why a contractor would choose to NOT to bid on a project. The most common reasons are that:
a. The contractor has too much of a backlog of work and not enough staff to handle the potential additional workload. In this circumstance, the contractor can either opt NOT to bid OR bid a very high price, understanding that in the unlikely event they do win the bid the additional margin will cover hiring more support staff and training them. b. The second is if the contractor knows the client is slow in paying their bills or is known to be a difficult client.
Contracting is an extremely risky business and with only single digit EBIT margins, contractors who want to stay in business tend to be as risk averse as possible.
(2) Creating a CPM Schedule- In most contractor organizations (at least in North America) both the CPM schedule and the Cost Estimate are done simultaneously, often by the same person or team of people. Why is this? Because there are cost and schedule trade-offs which must be taken into account. The best example is the cost of placing concrete in the winter months can easily be 300% more expensive than placing it in the spring, fall or even summer. Meaning the Scheduler and the Cost Estimator need to be working together find that “optimum” point
(3) Review the COSTING and CPM Schedule- This is the final chance for the Contractors project or construction manager to review the COSTS and the SCHEDULE together to see if he/she is still confident that the project can be done in that time frame for the amount of money allocated. Keep in mind that the project/construction manager is obligated to control that over which he/she has reasonable control over, which is the COST of the project to the Contractor. This includes the Project Direct Costs and Project Indirect Costs or what is generally known as “Above the Line” costs or “Costs of Good Sold”. Other costs such as Home Office Overhead, Finance Costs are not within the control of the contractor’s project manager, therefore, he/she is not held accountable for them.
The example coming from the US Parks Service is a classic example of “Activity Based Costing” (ABC) as each and every bid item becomes one or more activities (“work packages”) and each of these bid items in turn, becomes the basis for Activity Based Management (ABM) from both the Owner’s and Contractor’s perspective.
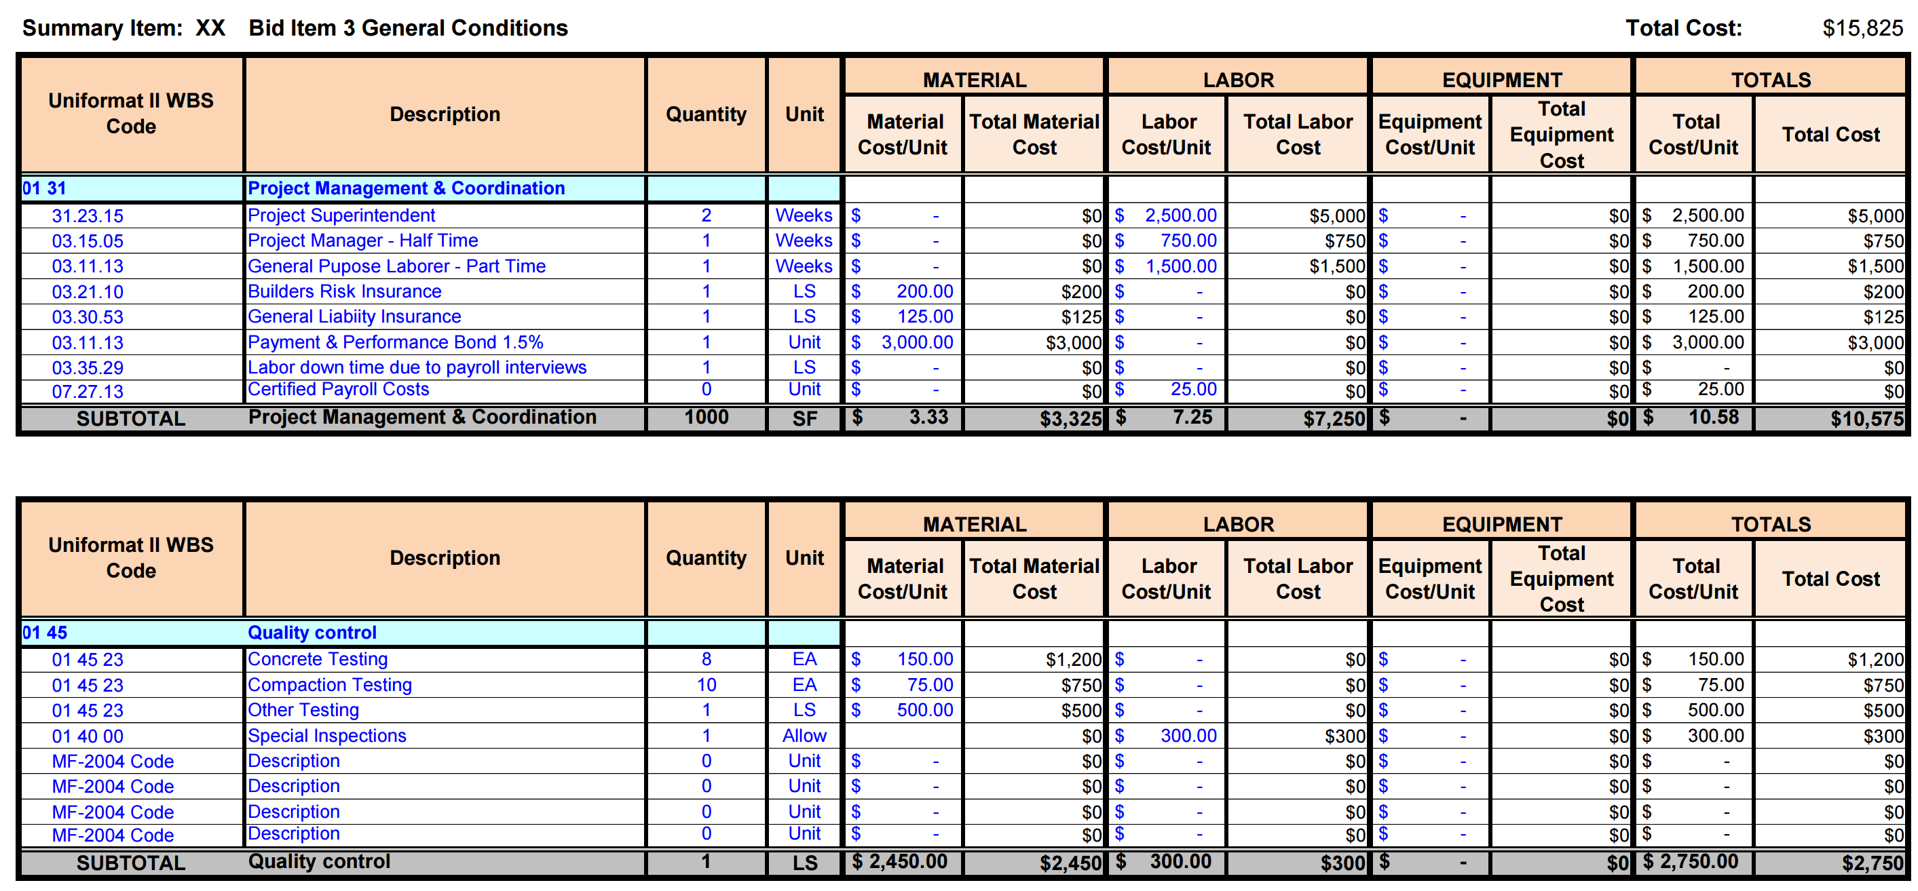
Figure 23 - Example of a COSTING SUMMARY SHEET used by Contractors
Source: US National Park Service Cost Estimating Handbook (2011)
(4) Profit Margin and Fees (Bid PRICE)- Because as a Contractor, we are bidding the project not based on our COST but on our SELLING PRICE, and because profit margin is a business decision to be made by the contractors home office management team, this a decision reserved for the contractor’s senior managers to decide, understanding that each dollar they lower the PRICE (Quote) to the owner, the greater their probability of winning the job is.
(5) Submit the Bid- As one of the first checks an owner performs when they receive bids is to see if they are “responsive” or not. That means not only that a bid was submitted but that it was submitted on the correct forms, and included whatever supporting information was required. (i.e. Certificates of Insurance, Bid or Performance Bonds etc)
08.2 - Module 08-2 - Develop Cost Estimating & Budgeting Policies & Procedures Manual
08.3 - Module 08-3 - Define The Estimates Purpose And Scope Of Work (Owner)
08.4 - Module 08-4 - Creating The Owners Cost Estimate (Top Down)
08.5 - Module 08-5 - Define The Estimates Purpose And Interpret The Scope Of Work (Contractor)
08.6 - Module 08-6 - Developing Contractors Cost Estimate (Bottom Up)
08.7 - Module 08-7 - Validate The Time & Cost Trade-Offs
08.8 - Module 08-8 - Validating Horizontal And Vertical Integration
08.9 - Module 08-9 - Conducting A Cost Risk Analysis
08.10 - Module 08-10 - Baselining And Communicating The Cost Estimate/Cost Budget
GPCCAR M08-1, Revision 1.04