08.0 - MANAGING COST ESTIMATING & BUDGETING
08.1 - Module 08-1 - Introduction to Managing Cost Estimating & Budgeting
08.2 - Module 08-2 - Develop Cost Estimating & Budgeting Policies & Procedures Manual
08.3 - MODULE 08-3 - DEFINE THE ESTIMATES PURPOSE AND SCOPE OF WORK (OWNER)

Figure 1 - Define the Esstimates Purpose & Scope of Work Process Map
Source: Guild of Project Controls
08.3.1 INTRODUCTION
The Purpose of the Estimate, the Tools & Techniques normally used, the appropriate Scope Definition and the Expected Accuracy Ranges can be described as follows:
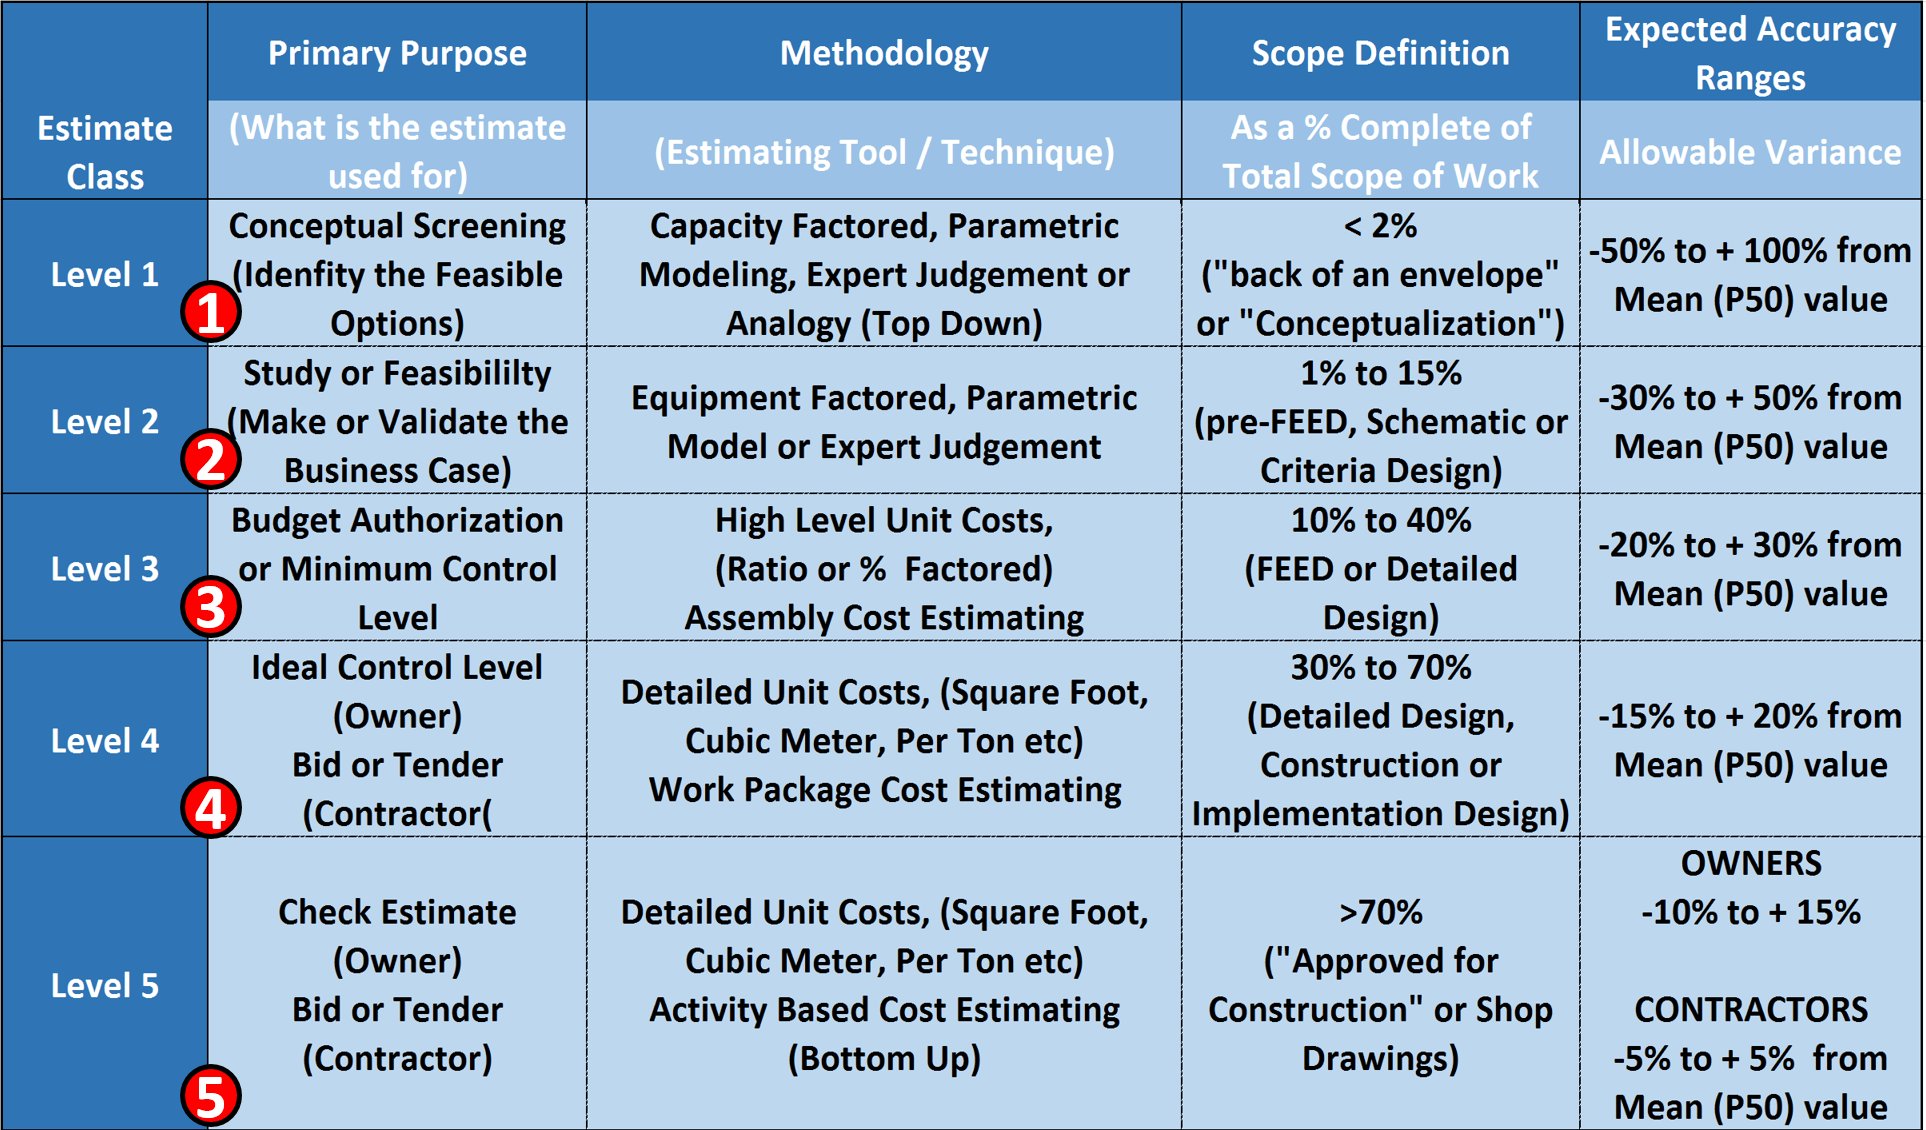
Figure 2 - Showing the Purpose, the Tools & Techniques, appropriate Scope Definition and Expected Accuracy Ranges
Source: Adapted from DoE Cost Estimating Guidelines
(1) Level 1 cost estimate (Cost Estimating Guide and AIA’s IPD Approach) is intended to help management decide, of several possible alternative solutions to a problem or opportunity, which ones might be the most cost effective. Generally speaking, costs alone are not the determining factor but some combination of factors. (Multi Attribute Decision Making). For this level of cost estimate, the most commonly used tools/techniques are Capacity Factored, Parametric Modelling, Expert Judgement or other “Top Down” methods. (Analogy). For this level of cost estimate, there is little or no scope defined and the cost estimator needs to be able to document, explain or justify a mean number with an acceptable range of accuracy between +100% to -50%.
(2) Level 2 cost estimate is intended to help management decide from more than one option, to select the single “best” solution to an opportunity or problem. This is based on a calculated business case comparing the top 2-3 options or alternatives. For this level of cost estimate, the most commonly used tools/techniques are Equipment Factored, Parametric Model or Expert Judgement. For this level of cost estimate, the scope is what the oil, gas and mining sector calls “Pre-FEED” design. (FEED = “Front End Engineering and Design”) and is also known in general construction as “Schematic” or “Criteria” design. In a Level 2 cost estimate, the cost estimator needs to be able to document, explain or justify a mean number with an acceptable range of accuracy between +50% to -30%.
(3) Level 3 cost estimate is where an owner organization goes to their shareholders or to the relevant government agency to get approval for the project and to have funds committed or set aside to do this project. In many sectors, this is known as the “AFE” or “Approved for Expenditure”. While this level of cost estimate is normally prepared in house by the OWNER’s project control team, if the owner is outsourcing this work under an “Engineer, Procure and Construct” (EPC), a “Design Build” (DB) or any of the collaborative contract types (i.e. Integrated Project Delivery (IPD), then the owner and the contractor work together to create this cost estimate. Many times this is the level of budget that the owner’s project control team REPORTS against, which means that consistent with our rule of thumb that we TRACK one level deeper than we are reporting and CAPTURE field data 2 Levels lower than we are reporting, means the project control team needs to be TRACKING at Level 4 and capturing cost data at Level 5. For this level of cost estimate, the most commonly used tools/techniques are High Level Unit Costs, (Ratio or % Factored) or Assembly Cost Estimating. For this level of cost estimate, the scope is what the oil, gas and mining sector calls “Front End Engineering and Design” or simply FEED, and is also known in general construction as “Detailed” design. In a Level 3 cost estimate, the cost estimator needs to be able to document, explain or justify a mean value with an acceptable range of accuracy between +30% to -20%.
(4) Level 4 cost estimate is normally NOT prepared by an OWNER but is based on the BIDS RECEIVED as prepared by CONTRACTORS as part of the competitive bidding process. This level of cost estimate is known as a “Bid” or “Tender” or “Committed” cost and for those owners for whom cost is a concern, is the ideal or preferred level to be TRACKING costs at to report one level higher. For this level of cost estimate, the most commonly used tools/techniques are Detailed Unit Costs, (Square Foot, Cubic Meter, Per Ton etc) or Work Package Cost Estimating. For this level of cost estimate, the scope is normally known as “Detailed Design” and comes from the level of detail found in the bid package. In a Level 4 cost estimate, the OWNER’s cost estimator needs to be able to document, explain or justify a mean value with an acceptable range of accuracy between +20% to -15%. Because the CONTRACTORS normally work on single digit EBIT margins, their cost estimating accuracy range needs to be +/- 5%
(5) Level 5 cost estimate is almost always prepared by a Contractor and is often not seen by the owner at all as this is the CONTRACTORS COSTS and not his/her selling price. This level of cost estimate is based the historical cost database which is proprietary and confidential to CONTRACTORS because this is their competitive advantage over their competition. This level of cost estimate is known as a “Bid” or “Tender”” COST. This is the level of detail that the CONTRACTOR will be REPORTING costs which means they will be tracking at the ACTIVITY LEVEL and capturing costs on a daily basis one level deeper. (Labor, Equipment, Materials and Subcontractors) For this level of cost estimate, the most commonly used tools/techniques are Detailed Unit Costs, (Square Foot, Cubic Meter, Per Ton etc) using Activity Based Cost Estimating (Bottom Up) or Work Package Cost Estimating. For this level of cost estimate, the scope is normally known as “Detailed Design” and comes from the level of detail found in the shop drawings or other installation drawings or written instructions. In a Level 2 cost estimate, the OWNER’s cost estimator needs to be able to document, explain or justify a mean value with an acceptable range of accuracy between +15% to -10%. Because the CONTRACTORS normally work on single digit EBIT margins, their cost estimating accuracy range needs to be +/- 5%
08.3.2 INPUTS
- Prior Decision Support Package (DSP)
- Work Breakdown Structure
- CPM Schedule
- Cost Estimate
- Risk Analysis
- Contract Documents
08.3.3 TOOLS & TECHNIQUES
08.3.3.1 Team Cost and Scheduling Meetings
The best way to engage the stakeholders in the development of the project schedule or programme is through the use of a Schedule Development or Planning Session. This session is dedicated to involving the project management team and major stakeholders in the development of the schedule.
The key being to determine the purpose of the schedule before the content of the schedule is detailed or listed.
These stakeholders must include the major trade subcontractors or subconsultants to ensure that they participate in discussions about the sequencing required to execute the project plan. These stakeholders generally will have needs that must be met for a successful project including procurement limitations, delivery and subproject completion limitations, and resource limitations. If these limitations are not accommodated in the schedule, it will not be followed and those stakeholders will not actively participate. This would create a situation where the schedule or programme is little more than a hypothetical approach to the project plan and is likely to fail. It also opens the door to additional cost claims from the stakeholders who were not included and did not provide approval of the overall plan.
Often the Schedule Development Session will result in a high level summary schedule that captures the project management team’s plan for sequencing and phasing for the project. Once this Session is complete, the participants should approve the overall summary schedule to allow the full detailed development to proceed without continuous participation of the stakeholders. This then provides direction and limits for the full detailed development of the programme or schedule.
The stakeholders must be allowed an opportunity to review the final product before benchmarking it for use. These two steps will ensure that the stakeholders and the project management team have confidence in the schedule and view the schedule as one that they were instrumental in development. They will be more likely to cooperate and use the schedule for a management and analysis tool.
This is particularly important in construction projects where the Contractor is using a small in-house team to perform the work and instead acting more as a broker or management contractor using independent contractors to perform the work. In this case, the Contractor may know little about the subcontractors’ plans and thus any schedule developed without their involvement will likely not be accurately reflect the sub-contractors plans and is unlikely to succeed.
One of the most accurate and reliable (albeit most time consuming) methods of developing schedules is what is known as the “sticky note” method. The example below shows how the Network Diagram View was used on a large project:
- WHICH IS WHERE YOU GET THE PEOPLE WHO ARE ACTUALLY GOING TO BE DOING THE WORK AND HAVE THEM WALK THROUGH HOW THEY ARE GOING TO DO IT. THIS ESPECIALLY POWERFUL WHEN YOU HAVE TO INTEGRATE THE WORK OF MULTIPLE SUBCONTRACTORS, DIFFERENT TRADES OR DIFFERENT DEPARTMENTS.
As we can see, from the example below (Figure 3) which was a multi-billion US dollar telecommunications project, there was no one person in the organization who could possibly know all the interactions between each department and surely no scheduler could possibly know how the organization worked.Thus the only way to approach this was to work with each department and groups of departments to have them explain to the scheduler what their workflow was and how their department interfaced with other departments, (See different coloured sticky notes)
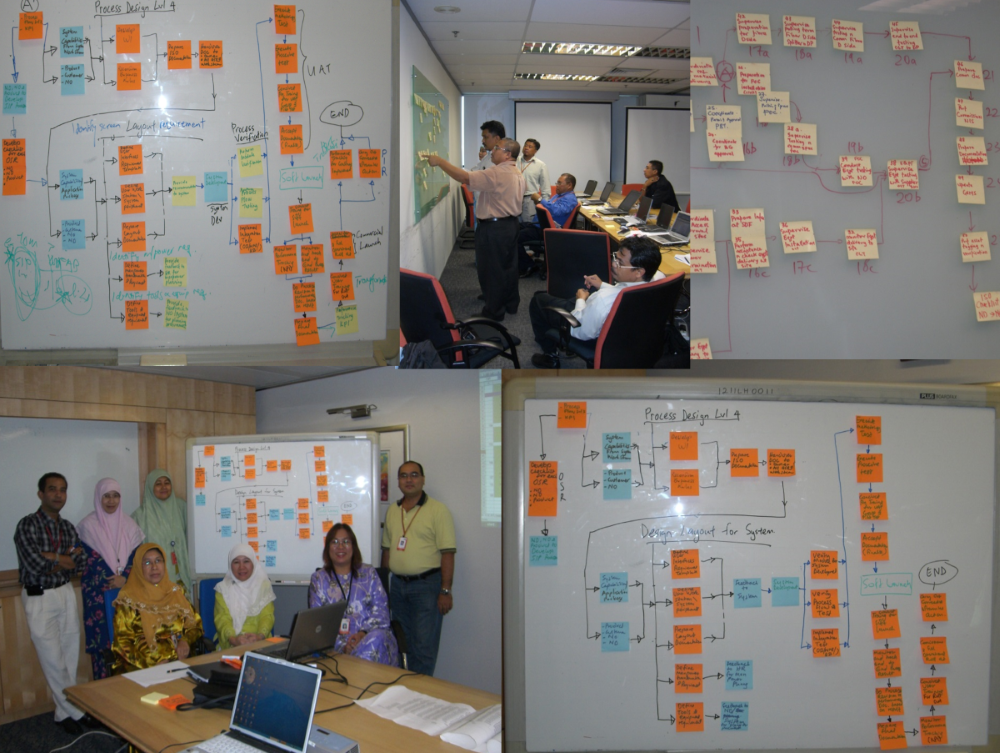
Figure 3 - Team Collaborating to Develop the Model (Part 1)
Source: Giammalvo, Paul D (2015) Course Materials. Contributed Under Creative Commons License BY v 4.0
In this example, the Cost Estimator/Project Controllers worked as facilitators gathering this information and entering it and the logical relationships into the scheduling software.
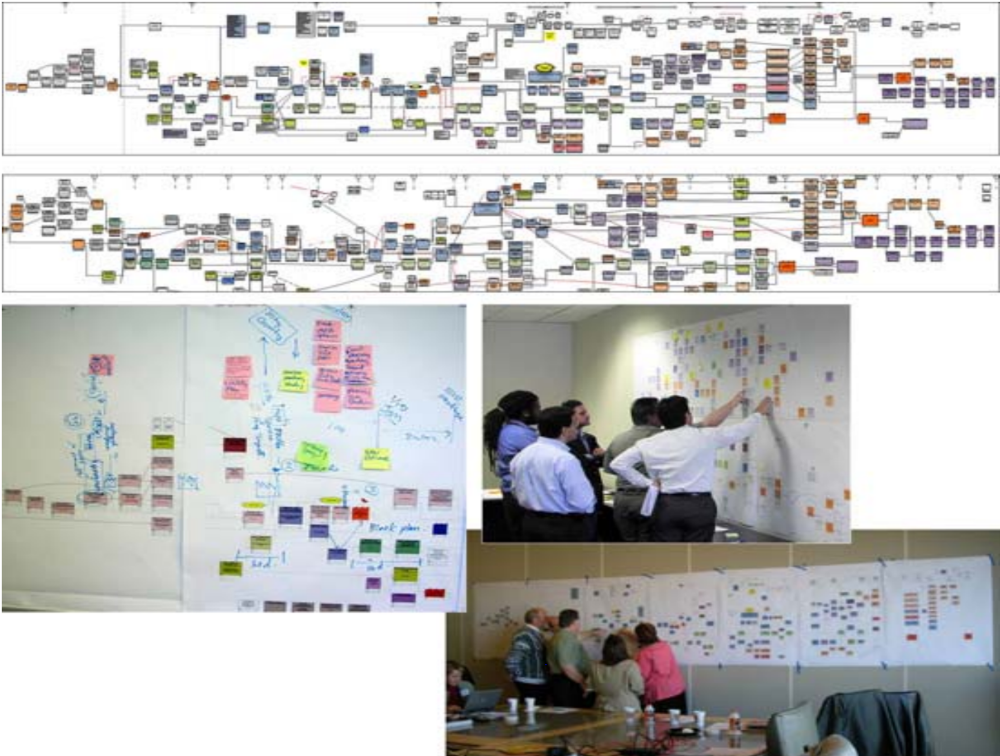
Figure 4 - Team collaborating to develop the Model (Part 2)
Source: Giammalvo, Paul D (2015) Course Materials. Contributed Under Creative Commons License BY v 4.0
For those involved with Building Information Modelling, the process is exactly the same. Regardless of what the computer model shows, at the point when execution is being planned (usually a Level 3 or Level 4, 5 or even Level 6 schedule) the people who are responsible to execute the work have to review the schedule and validate the work flow and resource assignments. The example shown in Figures 3 & 4 above is taken from an actual BIM project and illustrates how important it is that regardless of whether the schedule is created manually or through the use of BIM modeling, cost estimators/project controllers need to work as facilitators with the project team to ensure that the schedule being used represents what those doing the work actually plan on doing and NOT what the scheduler or the BIM program THINKS they should be doing.
For those planner / schedulers who complain that they create all these great schedules, stick them on the wall and then no one ever bothers to look at them, and / or what is actually happening in the field is coincidental to the schedule rather than being driven by the schedule, changing the process used to develop the schedule to a more participative one will definitely generate more ownership in the schedules and people may actually start to follow them on their own rather being beaten into submission to do so.
On the other hand, this is a time consuming process and it only appropriate for complex projects where the work flow is not reasonably known or understood by the Cost Estimator/Project Controller. Regardless even for the simple projects the savvy Cost Estimator/Project Controller involves the people who are going to be doing the work as much as possible to generate ownership and buy in.
When the data collection phase was done, the Pure Network Diagram view was used to walk top management through each of the processes before obtaining their sign off.
This is also an excellent place to discuss final closeout processes that should be modelled. In a construction project, for example, there are requirements for building and mechanical systems commissioning. These commissioning system requirements often can have a very large impact on the amount of time needed to close the project and require detailed planning to allow enough time to provide quality implementation of the closeout and warranty effort
In addition to this planning session, it is important to hold routine scheduling meetings with the major stakeholders, especially the client / owner, to ensure that their feedback is incorporated and their needs are accommodated. This is very useful although care must be taken that the feedback does not require additional scope of work or tend to increase or prolong time required to perform the scope by making changes that should be handled with the formal change management process.
08.3.3.2 Determine Level of Detail, Project Phasing, Weather & Other Constraints
In order to be able to ensure that all elements are “captured” or “identified” the following need to be considered and finalised if not already determined:
- DETERMINE LEVEL OF SCHEDULE DETAIL
- DETERMINE SEQUENCING OF PHASING
- DETERMINE WEATHER PLANNING & OTHER MAJOR CONSTRAINTS
08.3.3.3 Finalise Work Breakdown Structure & Control Accounts
The WBS is a scope (product or deliverable) oriented, hierarchical structure that defines all work required for the project at any given point in time and describes planned outcomes instead of planned actions. Explained another way, the WBS tells us WHAT needs to be produced, not HOW or WHEN.
It (WBS) provides a structured framework that divides the scope into manageable parts and each ‘deeper’ or descending level provides a more detailed look at the scope that its parent represents. It helps to ensure that all work scope is included in the plan and promotes an objective structuring of the schedule. All WBSs have an associated WBS Dictionary which is essentially a description or definition of each WBS element.
The WBS also provides a comprehensive, consistent tool for collecting and reporting project status. It is the basis for measuring progress against the plan and essentially is the foundation for reporting status to management.
In Figure 4 below, we have provided an example of an Aircraft System WBS, understanding that as the Guild of Project Controls is supporting both owners and contractors, any project which is undertaken to “create, update, expand, repair and eventually dispose of an organizational ASSET(S)”, is relevant to incorporate as an example in our GPCCAR.
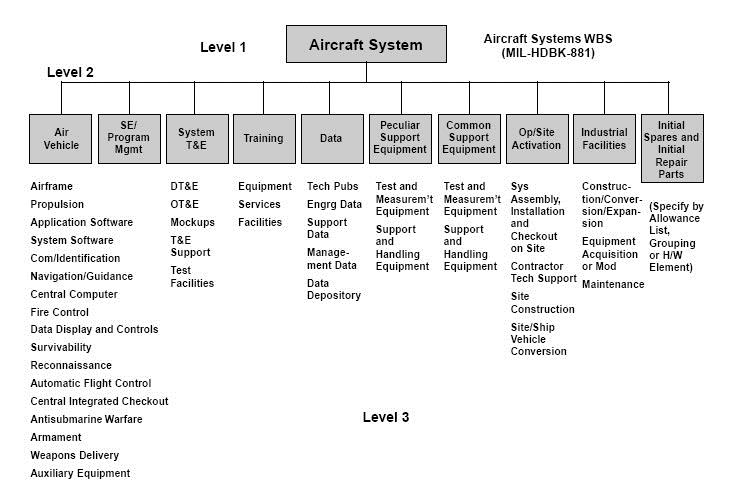
Figure 5 - WBS for an Aircraft System
Source: [being identified and will be updated once identified]
For those seeking additional sample WBS structures, turn to the GAO’s “Best Practices in Capital Budgeting” Appendix IX, page 328.
- TO CREATE A WBS, THE COST ESTIMATOR OR PROJECT CONTROLLER NEEDS TO IDENTIFY ALL SECTIONS, ELEMENTS AND PHASES OF THE PROJECT AND THEN ORGANIZE THIS SCOPE INTO A HIERARCHICAL STRUCTURE WITH EACH LOWER LEVEL OF THE STRUCTURE DEFINING ELEMENTS OF THE SCOPE OF WORKS ABOVE IT.
At the low levels of the WBS (often referred to as Work Packages or Planning Packages) the structure is finalized by attributing its scope to a uniquely identified Control Account (often referred to as Cost Accounts) usually taken from the cost management or Code of Accounts system. This allows the project management team is able to produce a hierarchical summation of the three core components; the schedule, the cost and the resource and allows the management team to have ‘control points’ or ‘management points’ where they can compare essential related items such as planned scope, actual work done, allocated budget, actual cost and all of the interrelated reporting metrics associated with earned value.
It can be said that schedule activities represent actions, while work packages represent project deliverables and so define project scope.
The recognized rule is that a Control Account can include (or summarise) several Work Packages but logically each Work Package can only be assigned to one Control Account (to prevent double counting).
This graphic demonstrates the integration of the elements which need to be managed:
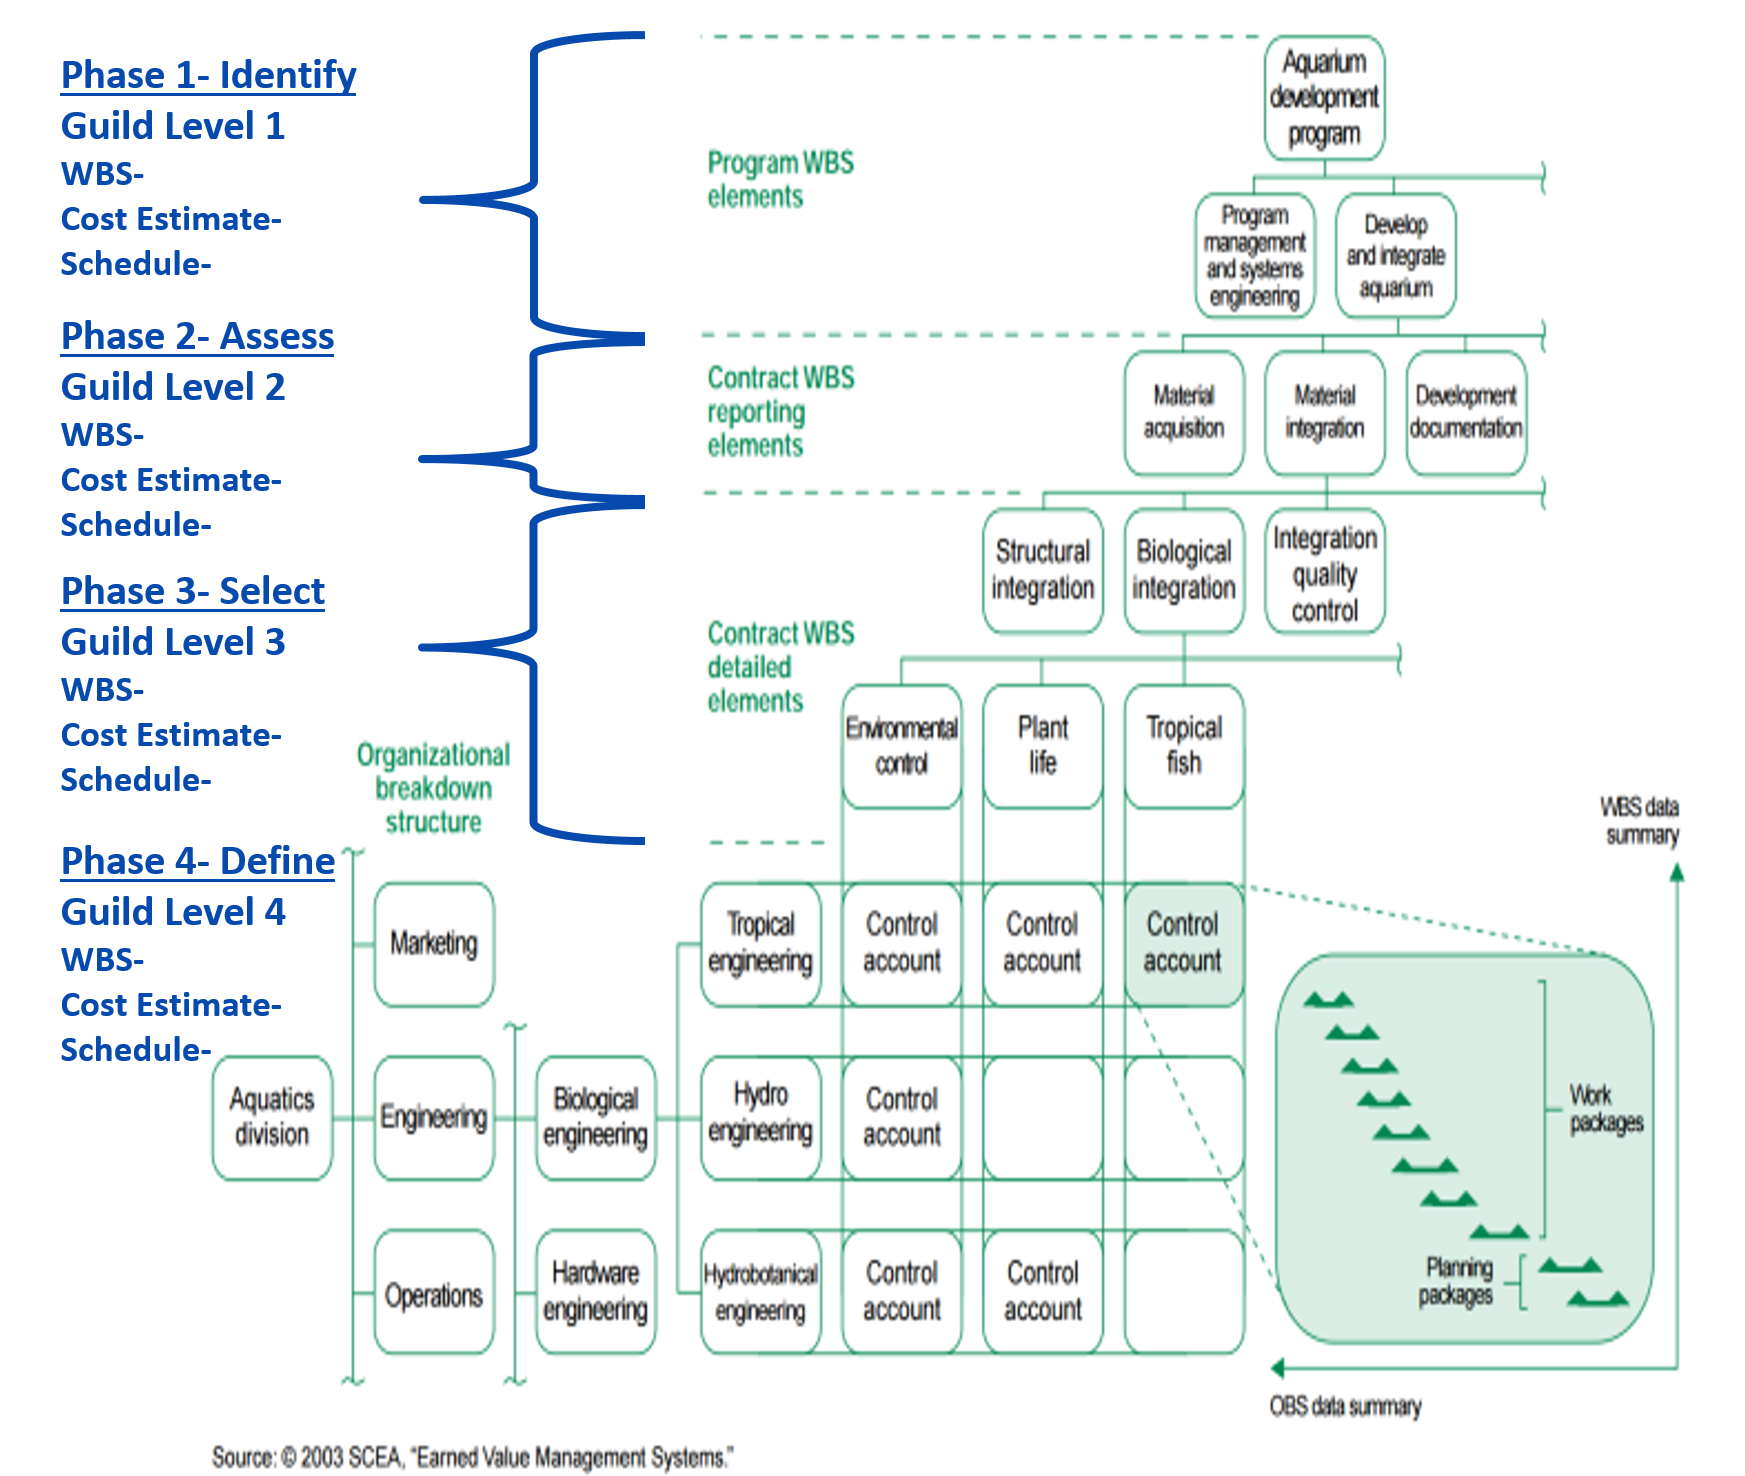
Figure 6 - Illustrating the concept of the Control Account and Work Package Activities
Source: GAO Cost Estimating and Assessment Guide Best Practices for Developing and Managing Capital Program Costs (2009)
- EACH ACTIVITY OF THE SCHEDULE IS ASSIGNED TO A WBS ELEMENT
Most scheduling software packages will arrange and display the activity listings grouped and sorted by the WBS structure, in fact, many packages now treat this structure as the default organizational structure for the schedule.
One of the most important work breakdown structure design principles is called the 100% rule. It states that:
- The structure is to include 100% of the work defined by the project scope and captures all deliverables in terms of the work to be completed, including project management.
- The rule applies at all levels within the structure hierarchy: the sum of the work at the “child” level must equal 100% of the work represented by the “parent”, where one or more “child” levels are subsets of the “parent” level.
- The structure should not include any work that falls outside the actual scope of the project, that is, it cannot include more than 100% of the work.
It is important to note that the same 100% rule also applies to the activity level which sits below the lowest level of the breakdown structure; namely that work represented by the activities in each work package must add up to 100% of the work required to complete that work package.
For more on this refer to Module 3 - Managing Scope but more specifically, Module 3.3 - Creating the WBS.
08.3.3.4 Responsibility Assignment Matrix
The Responsibility Assignment Matrix (RAM) is a chart used in clarifying roles and responsibilities in cross-functional / department projects or processes. It goes beyond the Responsibility Breakdown Structure (RBS) in correlating the responsibilities and roles with the Work Packages.
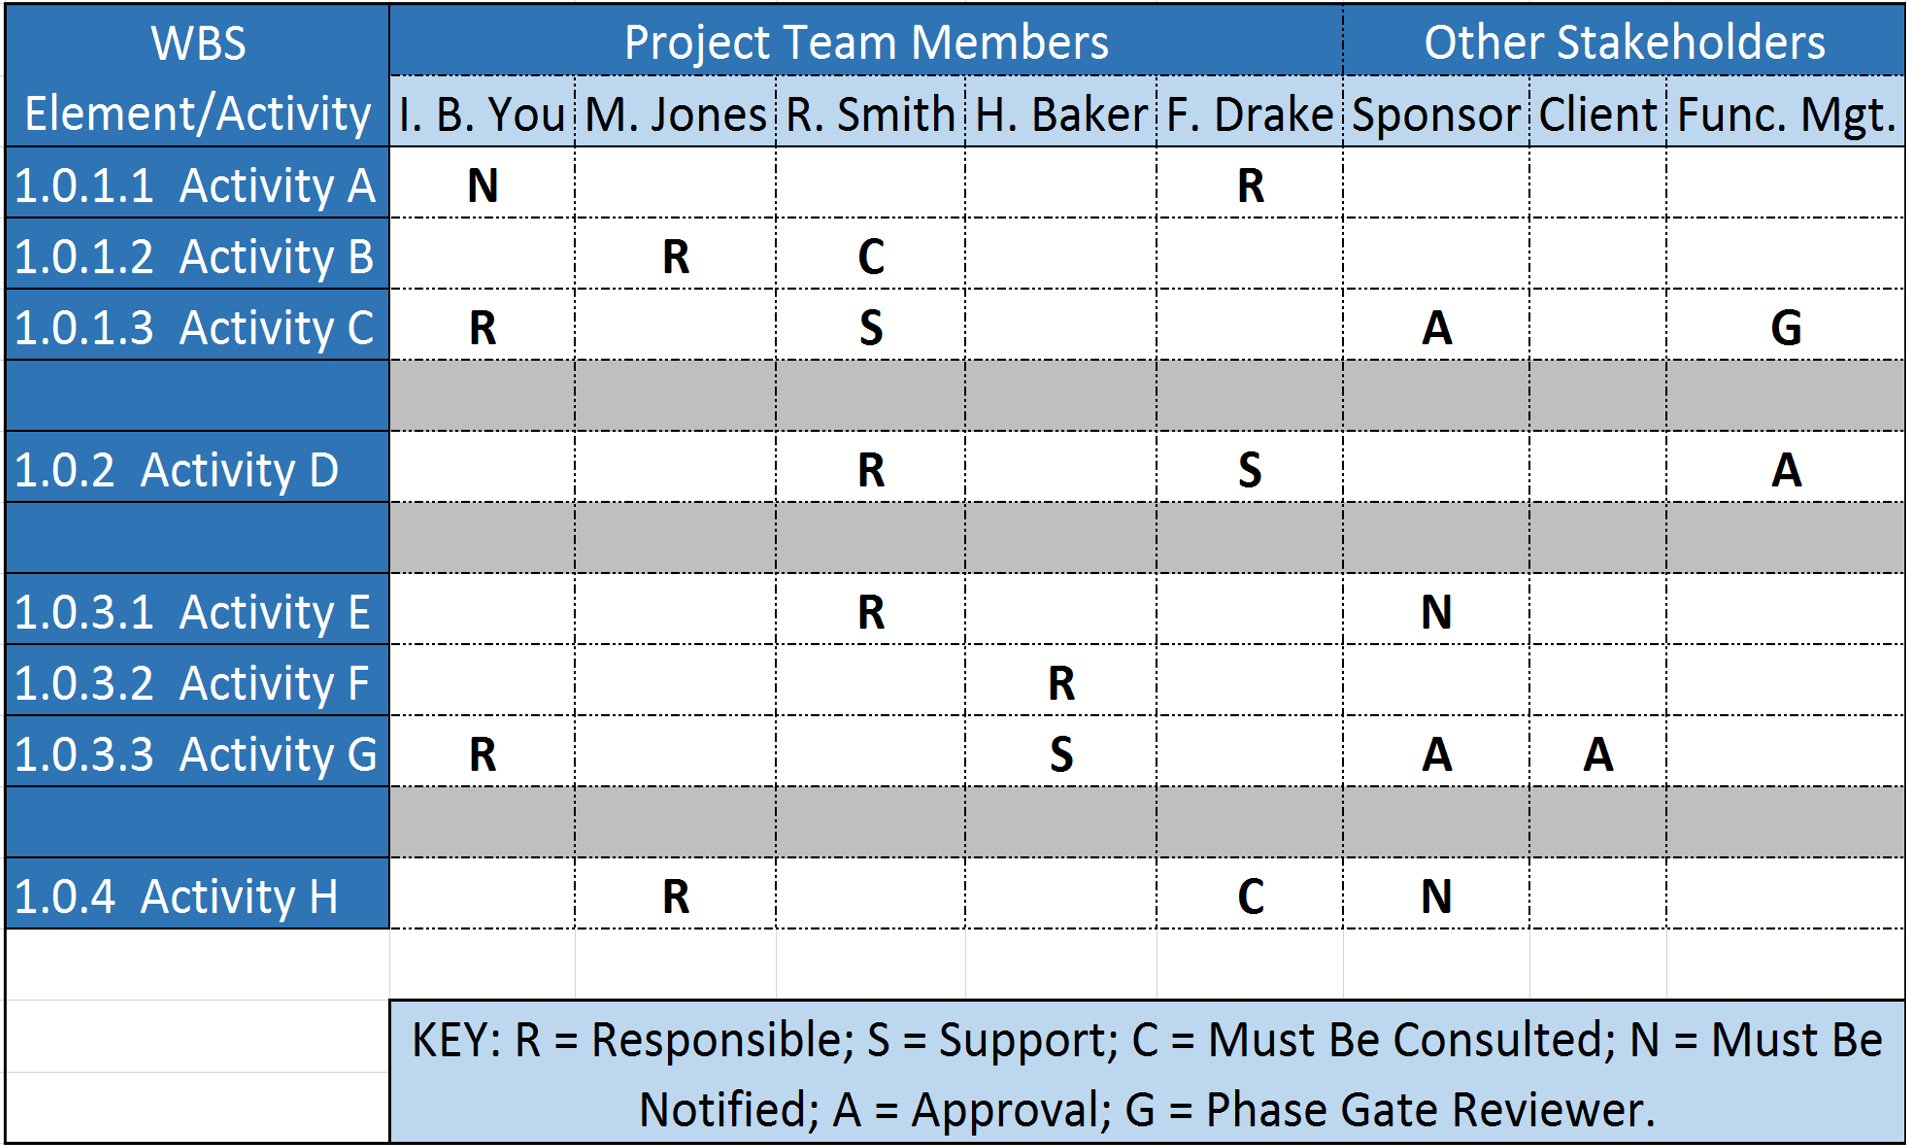
Figure 7 - Responsibility Assignment Matrix (RAM)
Source: Giammalvo, Paul D (2015) Course Materials. Contributed Under Creative Commons License BY v 4.0
In some organizations, a RAM is also called a “RACI Chart” (Responsible, Accountable, Consulted or Informed).
For more on the topic of RAM and RACI documents refer to Module 2- Managing People
- BY MERGING THE WBS AND OBS, THE COST ESTIMATOR OR PROJECT CONTROLLER CREATES A RESPONSIBILITY ASSIGNMENT MATRIX OR RESPONSIBILITY BREAKDOWN STRUCTURE (RBS)
The RAM displays the lowest level of both the WBS and the RBS. The integration identifies specific responsibility (i.e. people) for specific project tasks (i.e. activities). In the Responsibility Assignment Matrix project work packages are associated with responsible persons (not departments) and each work packages shall have only one responsible person.
08.3.3.5 Cost Estimating Templates (Owners)
There are any number of cost estimating templates for both owners and contractors available, either in “hard copy” (paper based) or more commonly, spreadsheets.
The best examples for both owner and contractor that the Guild has been able to locate in our research are the templates provided at no cost and under open source licensing are those offered by the US Parks Department.
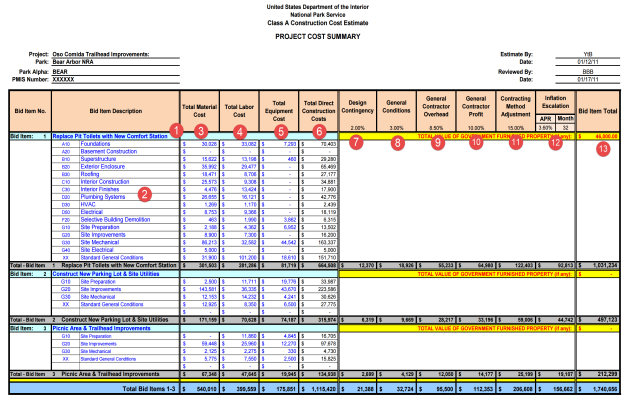
Figure 8 - Summary Level Cost Estimating Template (Owners)
Source: US National Park Service Cost Estimating Handbook (2011)
The example above shows what any cost estimating database should contain for information, whether Owner or Contractor:
(1) Activity Name- Below are some examples of well-written Activity Names:
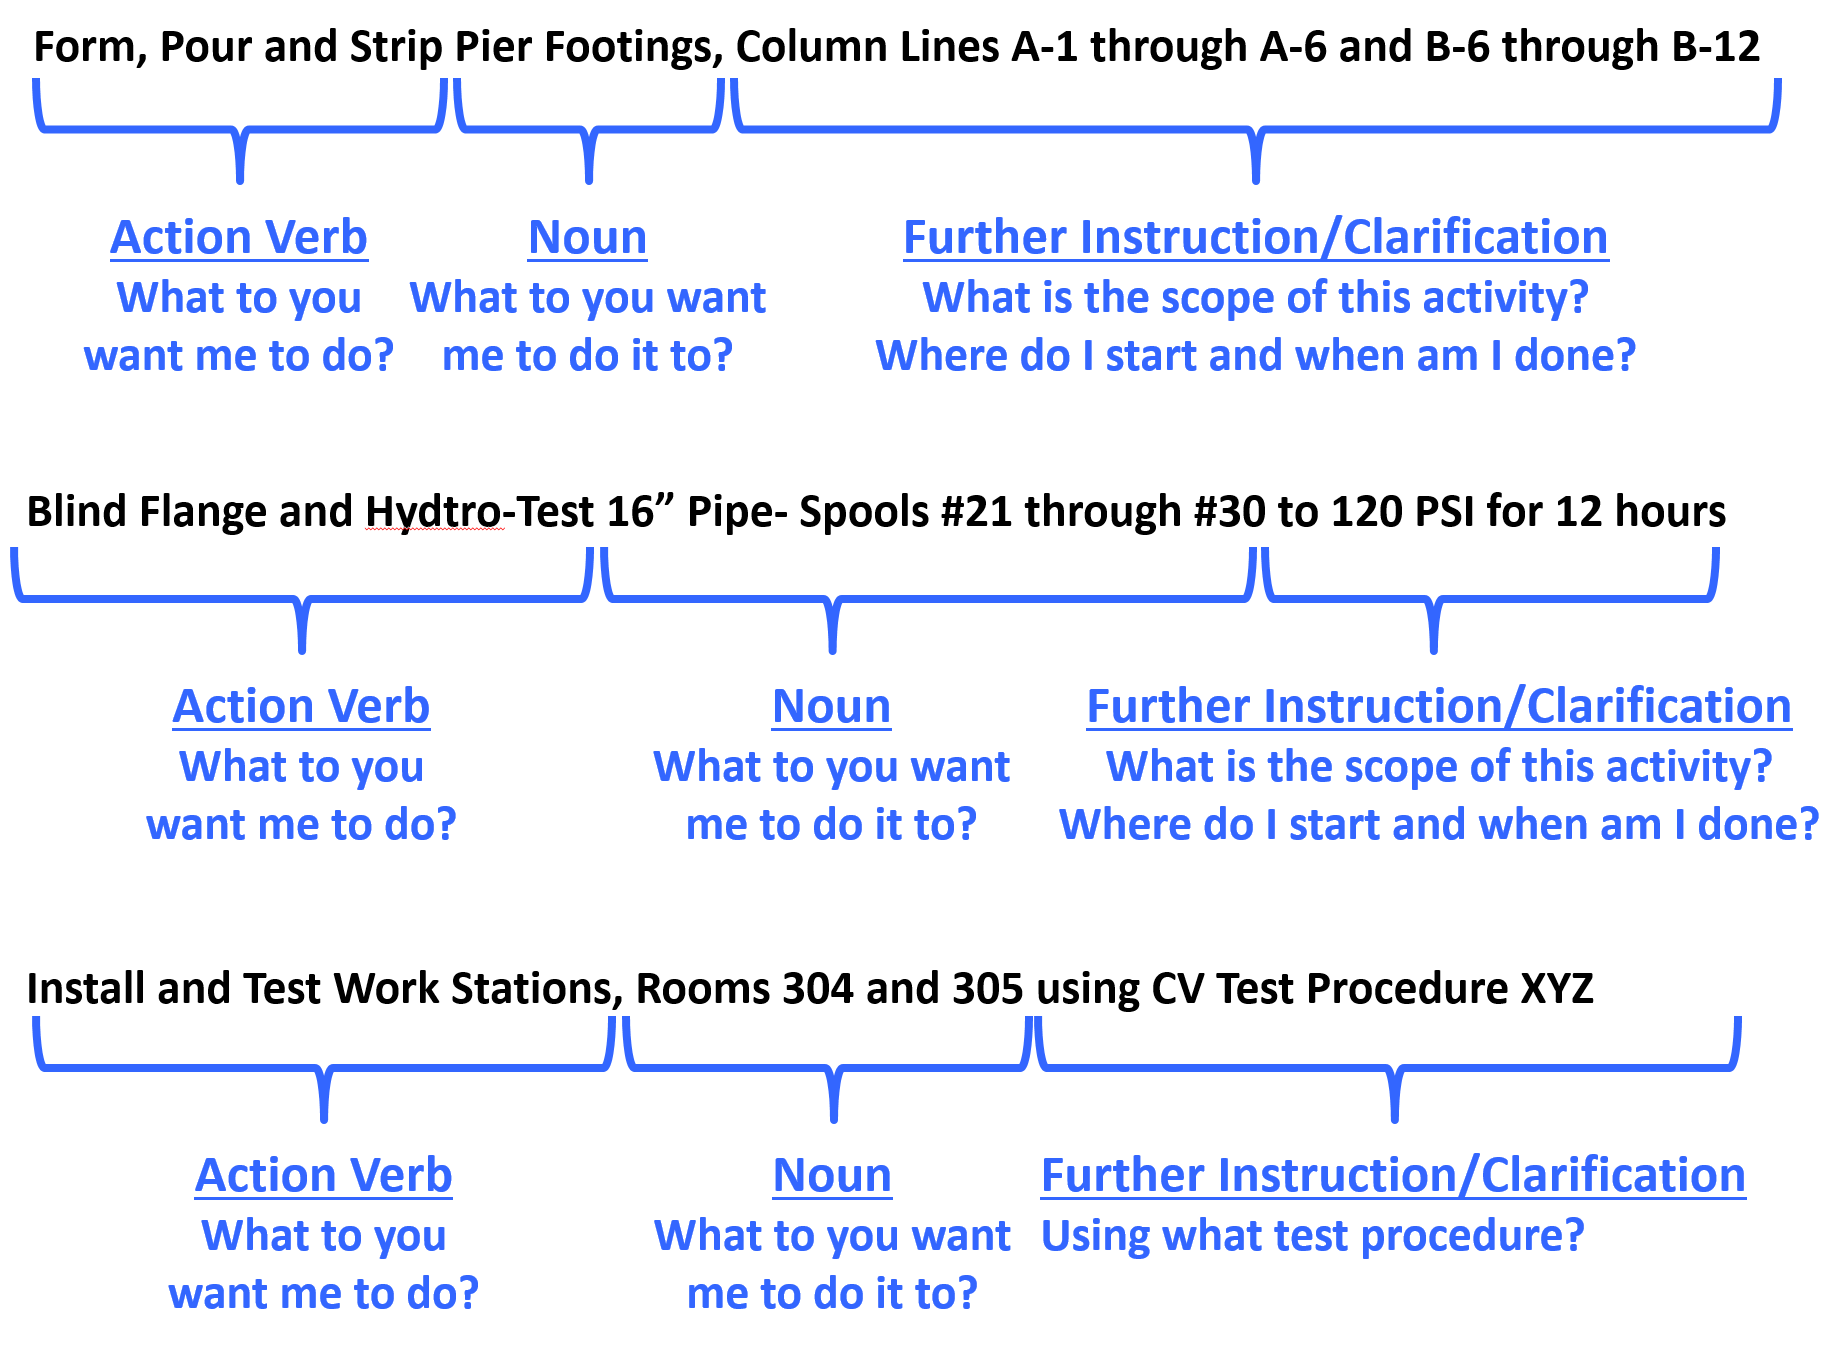
Figure 9 - Well Written Activity Names
Source: Giammalvo, Paul D (2015) Course Materials. Contributed Under Creative Commons License BY v 4.0
However, in the example shown above because this is an owner’s cost summary, they rolled it up by bid items rather than by the more detailed activity names likely to be used by contractors or owners for any “self-performed” work.
(2) Coding Structure Sub Sort- In this case, the US Parks Department has opted to use CSI’s Uniformat as the basis to “roll up” their project costs. For more examples of CSI Uniformat download this reference http://tinyurl.com/pwqofee which takes you to Level 3 of Uniformat for each of the main headings or you can download the Omniclass Table 21, http://tinyurl.com/pyk38jd which takes you to Level 5 for all headings.
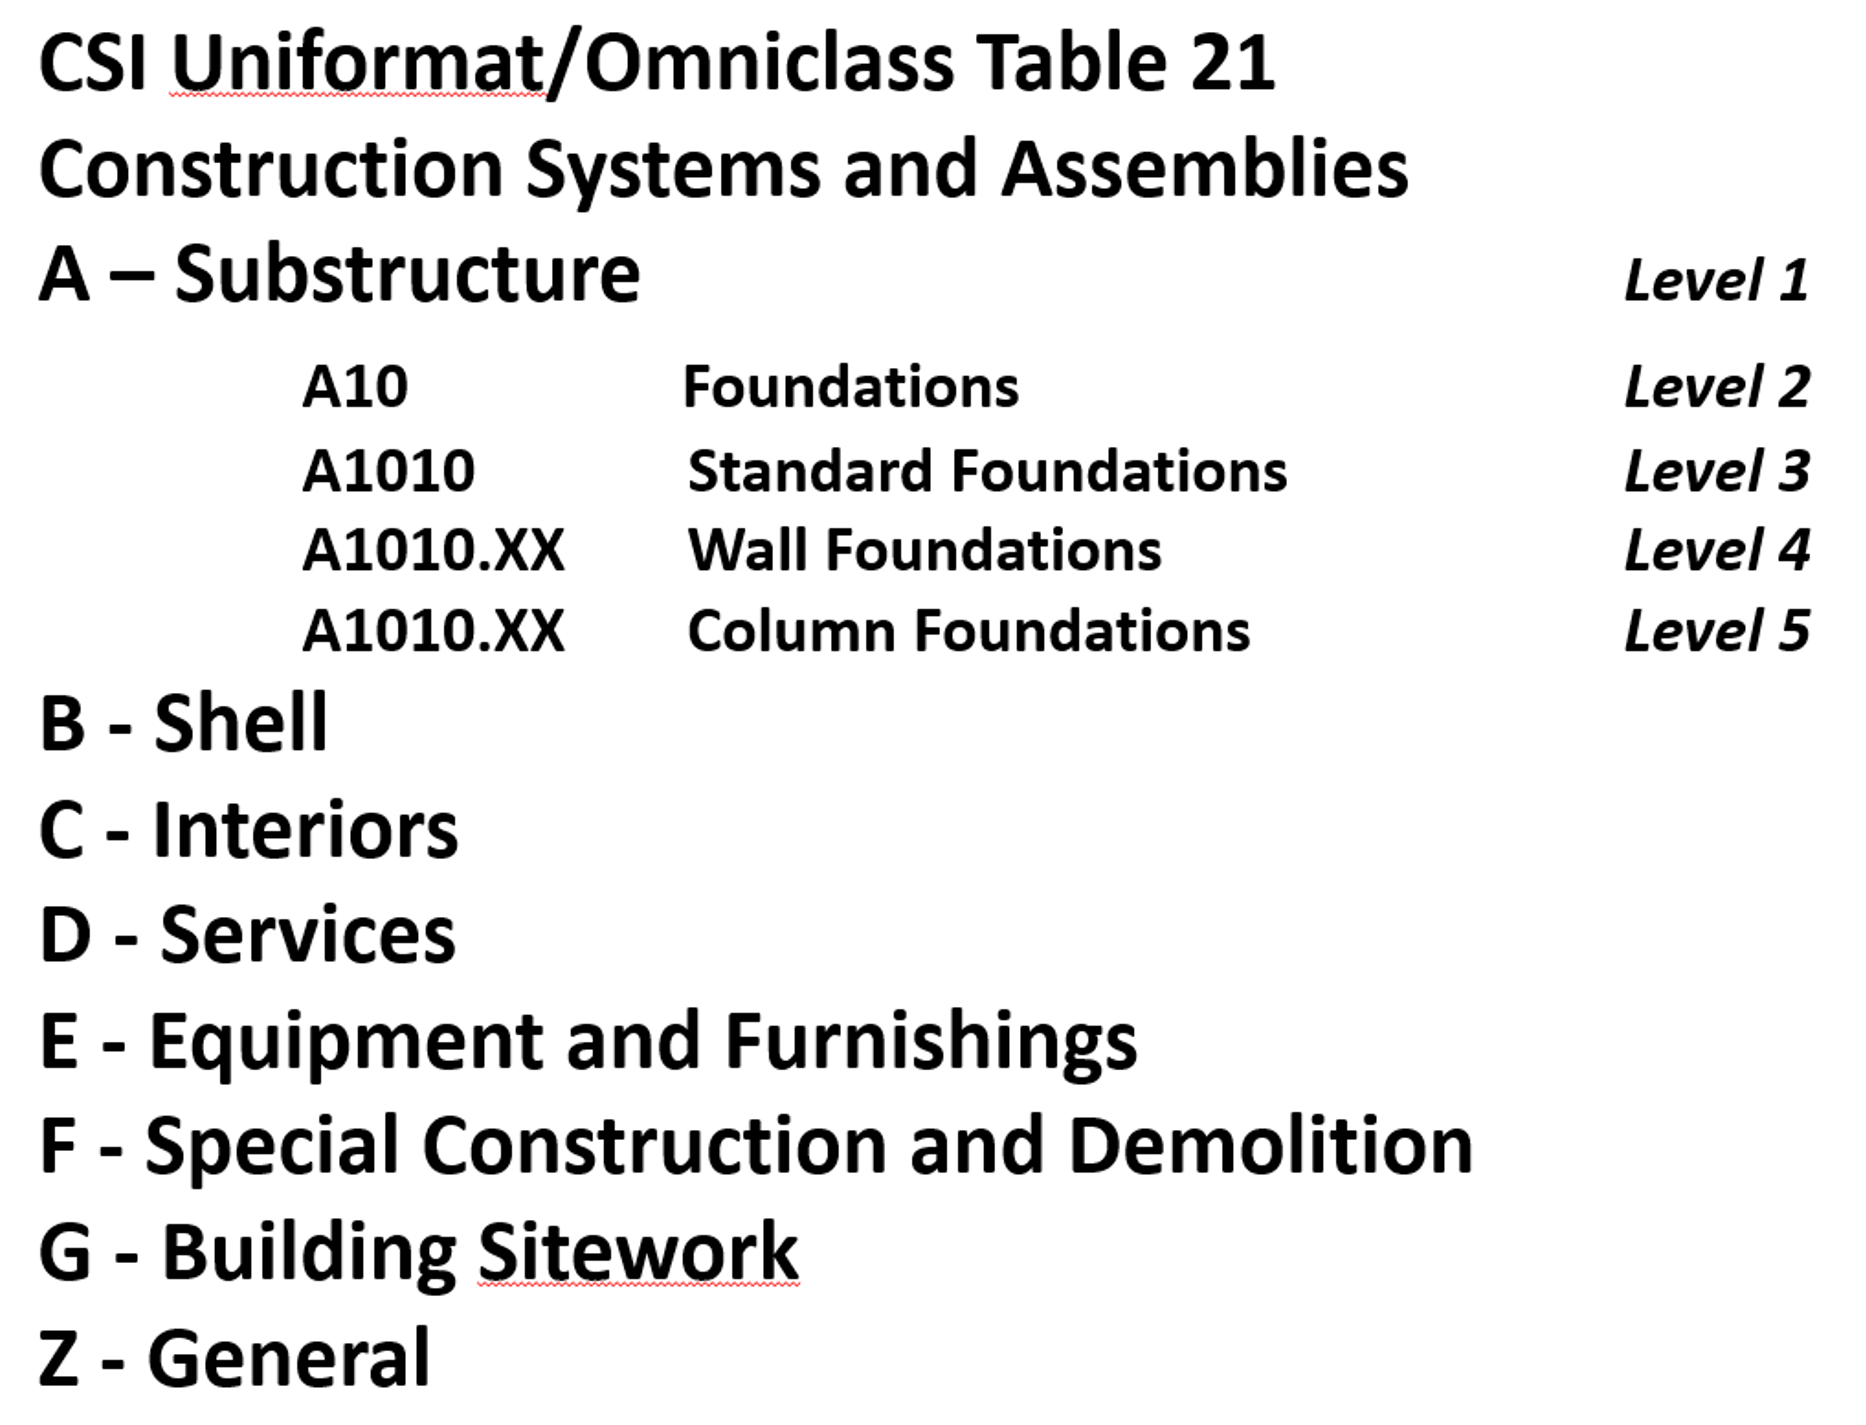
Figure 10 - Omniclass Table 21
Source: Omniclass Tables (n.d.)
Worth noting is that OWNER’s generally like using Uniformat/CSI Table 21 as it enables them to develop databases which are useful in the early phases of the project to develop cost estimates, while on the other hand, contractors tend to prefer using Masterformat/CSI Table 22 as it provides for much greater level of detail than does Uniformat.
(3) Material Cost- This should be self-explanatory but for cost estimators we need to be sure to check as materials prices vary significantly depending on location. The more remote the site, generally the more expensive materials are, because of shipping and storage costs.
(4) Labor Costs- Another largely self-explanatory heading but again, there are many factors which go into calculating labor costs, not the least of which is the actual productivity.
(5) Equipment Costs- Self-explanatory with the note that getting equipment to and from any given site (mobilization and demobilization costs) can often be significant and that has to be factored into the equipment costs along with the daily or hourly rental fee or cost of ownership.
(6) Total Direct Costs- Simply the sum of 3, 4 and 5 above. Now in this example above, because the contract is a cost plus type, the owner has every right to ask for and receive this information. However, if the contract was being let on a “firm fixed price” basis, then the owner would never see this level of detail. However, the contractor should have gone through the same process.
(7) Design Contingency- This is a RISK ALLOWANCE to cover the probability of design changes.
(8) General Conditions- This is what is known as the “Project Indirect” costs and covers things like the fencing/hoarding around the project, the site offices, electricity, fuel, QA/QC, Safety, Protective Equipment etc and other items identified in CSI Division 1/CSI Table 22 “General Conditions”.
(9) Contractors Home Office Overhead- This is a very real yet often contentious expense, which covers the salaries and facilities associated with the contractor’s home office. As this is generally considered a fixed expense, the percentage allocated to any project can vary, depending on the volume of work.
(10) Contractors Profit Margin- As noted previously, single digit EBIT margins are the norm for contractors around the world. So even if you go in with 10% target every mistake, error or omission the contractor makes comes out of that amount. Which is why we explain that for a contractor, his/her profit margin is the “Management Reserve”.
(11) Contracting Method Adjustment- This too is a “risk contingency” adjustment applied at the project level (as opposed to activity level) which covers such risk events as remote site construction, labor shortages/inefficiencies or working in adverse climates, either very hot and/or humid or very cold and dry. Again while it is unusual to see an owner organization recognizing this, if you are an owner’s project control professional then you need to recognize that this adjustment is or should be made by your contractors in putting together their cost estimate for bidding.
(12) Inflation Adjustment Factor- Again, self-explanatory with the caution that we tend to under-estimate what it really is. Given most governments lie about what the real or true inflation rate is in their country (the US underestimates inflation by a factor of 50%) the competent cost or project controls practitioner will take material and labor prices over a period of time and use those to project into the future what the real or true inflation rate is likely to be. Also for those who are working on International projects, don’t forget to factor in the exchange rate fluctuations. Many times those have a far worse impact than does inflation, especially in today’s global marketplace.
(13) Marked Up “Selling” price- This is a summation of the direct costs (6) plus the adjustments (7-11) to give us the CONTRACTORS SELLING PRICE which, when the work has been done and is billed by the contractor, becomes the OWNERS ACTUAL COST OF the WORK PERORMED (ACWP or AC)
08.3.3.6 Activity Codes
- ASSIGN ANY NECESSARY ACTIVITY CODES TO HELP SORT AND FILTER THE SCHEDULE
Activity Codes are a fundamental component of any schedule and should not be used in place of the core hierarchical breakdown structures (refer below), but can be used to supplement the capability of the hierarchical breakdown structures for organizing, sorting and filtering of the schedule.
Activity codes answer the question “How do we want to see or view our activities?”
While it appears as though “Omniclass” is going to be the dominant coding structure for the future, whether Building Information Modelling (BIM) prevails or not the Guild of Project Controls is advocating the use of STANDARDIZED coding structures rather than “ad hoc” structures unique to each company.
Explained another way, instead of every company, be it owner or contractor, “reinventing the wheel” by creating their own Activity codes, as project control professionals we owe it to the professionalization of our craft to play a leadership role by supporting and incorporating standardized WBS, Cost and similar breakdown structures.
Important to note is that if and when BIM is used by your organization that the Omniclass coding structures will come preloaded into every “object” meaning that the Cost Estimator/Project Controller will not have to ADD these codes. They will come with the object when the designer places it in the design.
This means is if we as practitioners don’t adopt these coding structures it will mean we have to write translator programs to modify our existing cost, productivity and frag net activities to conform to the Omniclass codes.
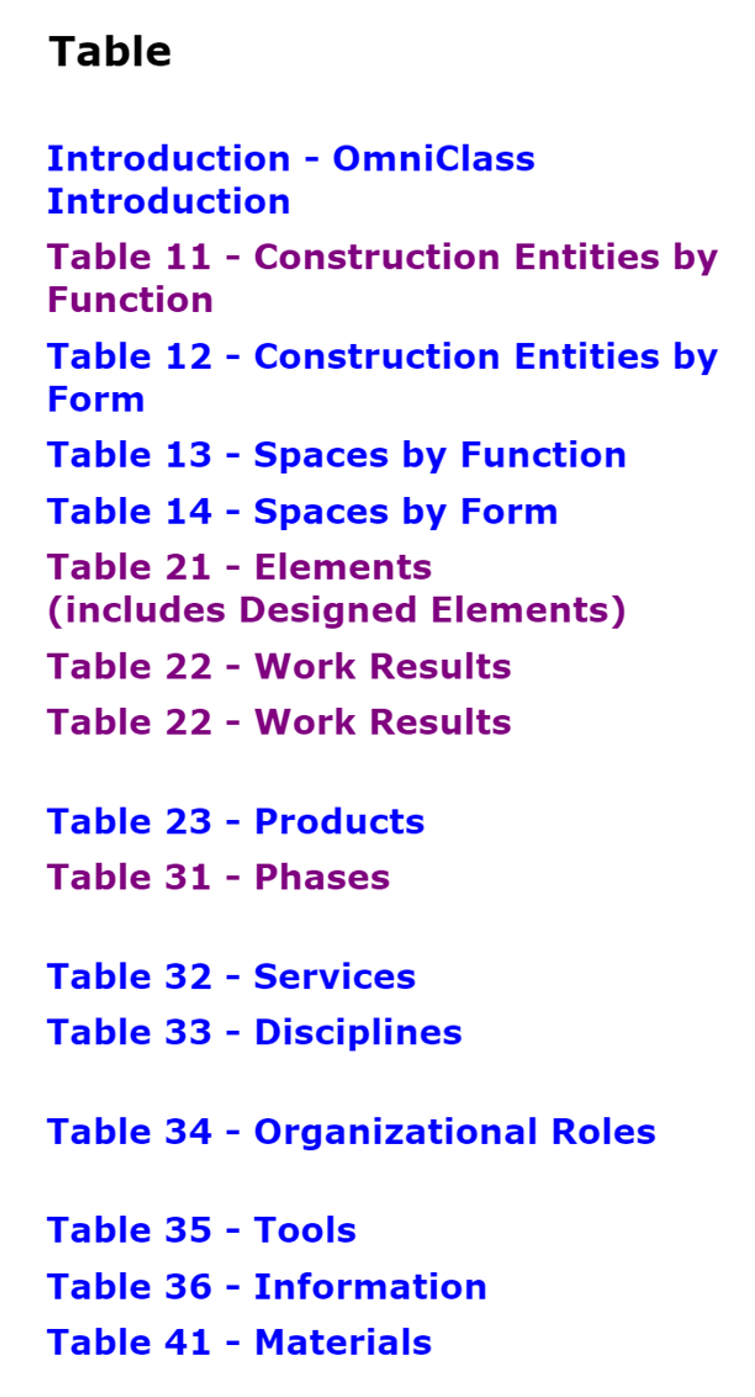
Figure 11 - Omniclass 15 Table Coding Structures
Source: Source: Omniclass Tables (n.d.)
As you can see from the Omniclass Tables, there are 15 different ways we can view or sort our project activities, depending on the needs of each stakeholder. But even if we standardize on these codes, does not stop us from creating new ones. We can also see that there are 4 which are most commonly used by Owners and Contractors. Owners tend to prefer Table 21- Components (Uniformat) and Table 31- Phases, while contractors tend to prefer Table 22 Work Results (Activities) and Table 33 Disciplines. (e.g. Carpenters, Electricians, Welders, Structural Engineers, Mechanical Engineers etc)
For those preparing for any of the GPC Exams you are expected to be familiar with all 15 Omniclass tables, understanding what they show and how a project control professional, cost estimator or planner/scheduler might use them.
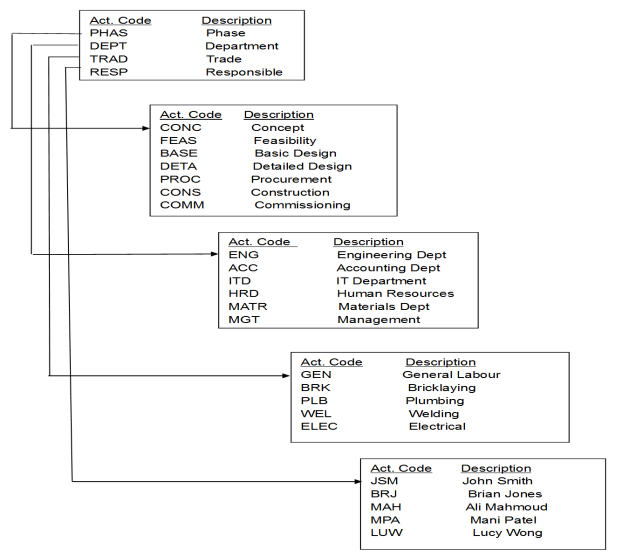
Figure 12 - Examples of Common Activity Code Structures
Source: [being identified and will be updated once identified]
Figure 12 above is an example of a commonly used “ad hoc” set of codes which is consistent with what Omniclass is providing us with, EXCEPT that instead of having to enter them manually the BIM software already has these coding structures embedded in each object, and thus transferable into the cost estimating or CPM scheduling program.
Activity codes thus have three basic functions in a schedule:
- to organize the schedule into groups and sub-groups;
- to sort within each group or sub-group; and
- to filter specific activities from the layout view.
They may be also used for activity identification where activity descriptions cannot specifically identify works. If an activity is “pouring concrete” or “final design” a lot of activities in the schedule may have the same name and such an activity code may identify the work represented by this activity. In repetitive projects, this is very helpful because a large group of identical activities can be copied and pasted back into the schedule with a different Activity Code, for example, in duplicating Floor 4 to create Floor 5 activities.
Activity Codes are provided with fields in the schedule software database and form an essential part of all schedules. The values for each of the Activity Codes are associated with and are part of the records of the activities. Activity Codes are comprised of values which take the form of alpha-numeric digits which can be assigned to activities to organize, group and filter them as required by the user.
Typical ‘construction’ type projects are often divided up into Activity Codes such as Phases, Locations, Responsibilities, Disciplines, and these can be organized in a hierarchical manner in the same way that a Work Breakdown Structure is automatically developed. So under Phase there would likely be a subset of Codes representing Design, Procurement, Construction (for example), and under Discipline another subset representing electrical, mechanical, civil, structural disciplines (for example).
As with WBS, such codes can be standardised across organisations and, owners and projects with obvious coordination benefits.
There is a difference between Activity ID and Activity Codes which needs to be clear. The Activity ID is a unique number identifying each and every activity. Activity ID’s are mutually exclusive- there cannot be two identical Activity ID’s. In Microsoft Project the software program automatically assigns an Activity ID. The problem with this is as you add more activities, the Activity ID number changes. Meaning what was Activity #10 today may be Activity #15 after you add more activities. Oracle Primavera does a better job on this by requiring you to enter in Activity ID’s however, a lot of people try to make the Activity ID complicated by including all kinds of “intelligence” into the Activity ID when that would be best handled using the User Defined fields, also known as Activity Codes, in any of the major software packages.
What is important is that the structure is matched accurately to the nature and needs of the project. It can be very difficult to change the coding structure once the schedule is in circulation so some thought needs to be applied to this at the start of the project.
08.3.3.7 Additional Schedule Coding Structures
Without a means of organising the schedule activities the schedule would be presented as simply a very long list of tasks and as a result it would be difficult to understand, utilise or explain.
There are multiple ways that a project can be broken down so it is possible to have a need for more than one breakdown structure, or put another way, more than one way of breaking the project scope down into various levels of detail. For example, the project might be broken down by phase, function or even discipline.
- USE / ADOPT MULTIPLE PROJECT BREAKDOWN STRUCTURES
Generically termed as “work” breakdown structures, these allow the scheduler to obtain and present multiple performance plans and performance reports and to therefore present or analyse the project plan, and its progress, from different perspectives.
To supplement the WBS there is an array of hierarchical breakdown structures that the scheduler can adopt to organise and present the activities that reside within the schedule. Some examples are:
While these are the most common breakdown structures, we can also create user defined sort fields, such as Area, Funding Source, Stadia Distances or anything else that makes it easier for our stakeholders to see and understand the project plan and progress against that plan.
- Cost Breakdown Structure – a hierarchical structure that contains all direct costs, indirect costs and other administrative costs for the project and allows for information exchange between the project and accounting, and may interface with other departments such as procurement or finance
- Responsibility Breakdown Structure - a hierarchical structure that contains names of staff, or alternatively staff type for the project and allows for the assignment of “staff to project scope” (refer Responsibility Assignment Matric below)
- Contract Breakdown Structure - a hierarchical structure that contains details of the contracts and sub-contracts relating to a project. This is often achieved by using Activity Codes on smaller projects.
- Risk Breakdown Structure - a hierarchical representation of risks, starting from higher levels and going down to finer level risks. For instance, at the top level you could split your risk into technical risk, management risk, scheduling risk and external risks (Level 1), then go on to finer levels such as design risks, funding risk etc (Level 2) and so on. You can keep subdividing the risks into deeper levels as long it makes sense.
With Omniclass being the most likely standardized multi-dimensional coding structures, and given these coding structures will come embedded in each object, the professional Cost Estimator/Project Controller needs to be familiar with these coding structures and understand how they are used by both owner and contractor.

Ultimately, the cost and resource loaded schedule, along with the supporting documents (i.e. Decision Support Packages and Contract documents) which went into creating it, should enable the project control team to identify or answer or support answers to the following 8 questions about the project if asked by our stakeholders:
- Who
- What
- Where
- When
- Why
- How
- How Much
- For What Purpose
When designing a coding structure for your project, if you keep these 8 elements in mind it should help you decide which coding are necessary and appropriate. (Figure 13 - The 8 Questions for Stakeholders to the right based on research by Garrett Lisi adapted to project management by Moine, Jean Yves, Leynaud, Xavier, Giammalvo, Paul)
08.3.4 OUTPUTS
- Appropriately Detailed Planning Packages With The Associated Activities Down To Level 3 Minimum/4 Preferable By Owners
- Standardized WBS Coding Structures Defined By Owner And Specified In Contract Documents
- Standardized Activity Coding Structures Defined By Owner And Specified In Contract Documents
- Cost Estimating Templates Created By Owner And Specified In Contract Documents
08.3.5 REFERENCES & TEMPLATES
- GAO “Best Practices in Scheduling” http://www.gao.gov/assets/600/591240.pdf best practice 1 pages 10-24
- GAO Cost Estimating and Assessment Guide Best Practices for Developing and Managing Capital Program Costs http://www.gao.gov/new.items/d093sp.pdf
- CSI's Project Resource Manual, 5th edition http://www.amazon.com/project-resource-manual-csi-practice/dp/007137004…
- Omniclass Tables- http://www.omniclass.org/
- US Park Services Templates- http://www.nps.gov/dscw/publicforms.htm
08.4 - Module 08-4 - Creating The Owners Cost Estimate (Top Down)
08.5 - Module 08-5 - Define The Estimates Purpose And Interpret The Scope Of Work (Contractor)
08.6 - Module 08-6 - Developing Contractors Cost Estimate (Bottom Up)
08.7 - Module 08-7 - Validate The Time & Cost Trade-Offs
08.8 - Module 08-8 - Validating Horizontal And Vertical Integration
08.9 - Module 08-9 - Conducting A Cost Risk Analysis
08.10 - Module 08-10 - Baselining And Communicating The Cost Estimate/Cost Budget
GPCCAR M08-3, Revision 1.01