8.0 - MANAGING COST ESTIMATING & BUDGETING
08.1 - Module 08-1 - Introduction to Managing Cost Estimating & Budgeting
08.2 - Module 08-2 - Develop Cost Estimating & Budgeting Policies & Procedures Manual
08.3 - Module 08-3 - Define The Estimates Purpose And Scope Of Work (Owner)
08.4 - MODULE 08-4 - CREATING THE OWNERS COST ESTIMATE (TOP DOWN)
 Figure 1 - Creating the Owners Cost Estimate Process Map
Source: Guild of Project Controls
08.4.1 INTRODUCTION
We know there are two separate and distinct functions that both Owner and Contractor cost estimators/project controllers are responsible for.
- The first is to create the Cost Estimate and the second it is to create the budget which we do by allocating the costs over time by cost loading the activities at whatever level is appropriate given the phase the project evolution is in.
In this module we will be following the development of a cost estimate from Level 1-4 from the Owner’s perspective using common “top down” cost estimating approaches, then in the following Module we will be continuing down to a Level 5 estimate from the Contractor’s perspective using a “bottom up” method known as Activity Based Costing (ABC).
- Important to keep in mind is that a cost ESTIMATE doesn’t become a BUDGET until someone with the appropriate level of authority has approved or accepted it. What this means is a Level 1 estimate doesn’t become a Level 1 budget until such time as it has been included in the Level 1 Decision Support Package (DSP) and been signed off by the appropriate project sponsor (In many cases, it is not a single person who signs off on a decision support package but a team of people, often known as a “steering committee”).
- For a contractor, the cost ESTIMATE doesn’t become a BUDGET until approved by the contractor’s management and submitted as a BID. If there are any negotiations between the owner and contractor after the bid was submitted but before the contract was awarded, the cost estimator needs to be sure the cost estimate is adjusted accordingly. Once the contract is signed, then the value contained in the contract documents becomes the contractor’s budget.
Defining the estimates purpose is of critical importance as the purpose determines not only which tool/technique is appropriate, but the level of detail, how much time and money should be budgeted to be able to produce an estimate which is “fit for purpose”. As we know from Module 3 - Managing Scope and Module 7- Managing Planning and Scheduling, the Guild of Project Controls has adopted a standardized classification system, modified from AACE’s RP 18R-97 and RP 17R-97, which maps to the typical Phase Gate levels:
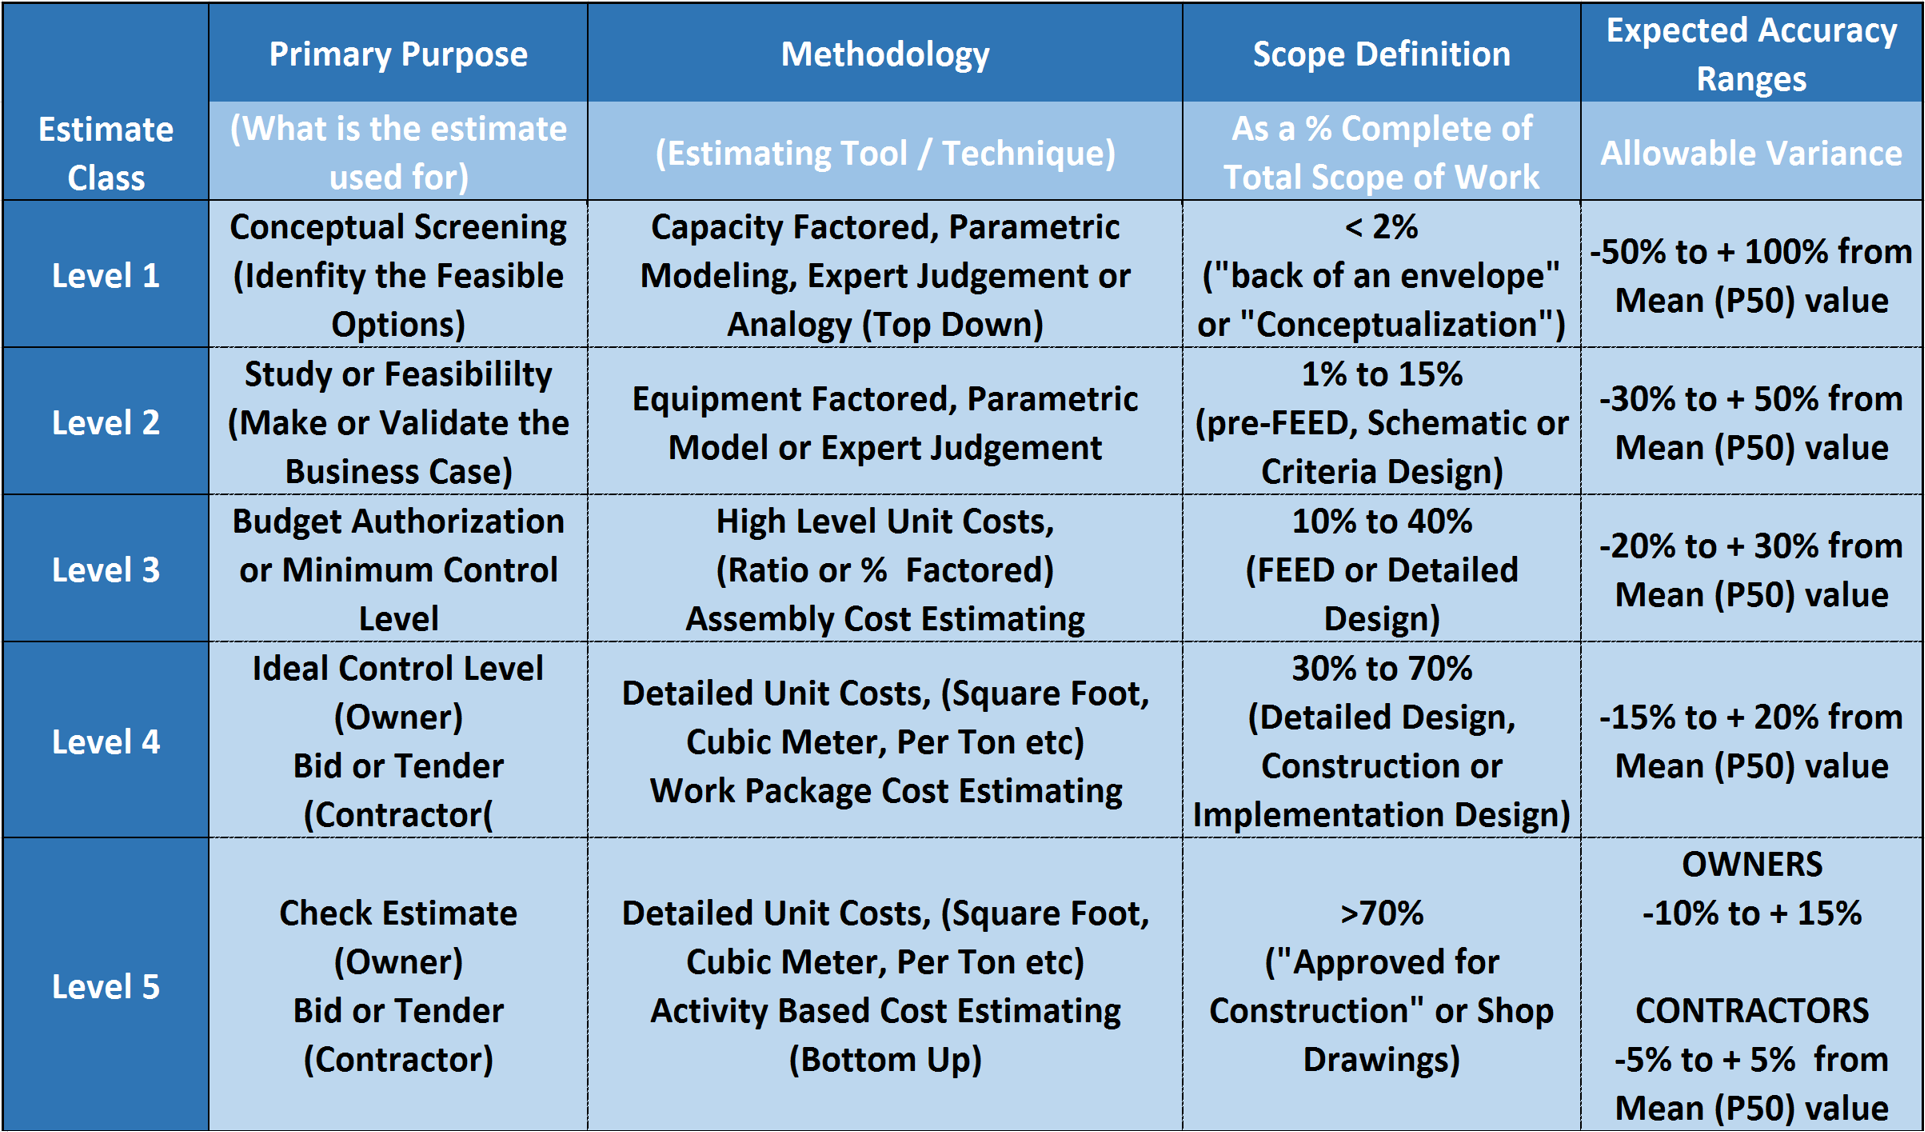
Figure 2 - Adapted from AACE’s RP 18R-97 and RP 17R-97
Source: Adapted from DoE Cost Estimating Guidelines
As we can see from Figure 2, we have now ADDED the end usage (primary purpose) and the appropriate estimating method the cost estimator would be likely to use. In this module we will explore what tools/techniques are appropriate for each level.
At this point, we also need to know how many resources and what competencies we need for each level of estimate as well as how long each level of estimate should take given a limited or constrained pool of resources.
As we can see from AACE’s RP 18R-97 and RP 18R-97, the estimating method (the tools & techniques we need to use) are very different from one another and more importantly, vary considerably not only in their accuracy, precision and reliability but also in the level of effort required to create them.
- One of the biggest challenges to owners and contractors alike is how long should it take to develop a “accurate, reliable and precise” cost estimate?
Owner’s in particular have a tendency to allow a very short time frame for contractors to bid work and because of this, contractors end up being too rushed and thus a lot of mistakes and errors are made. This is not good for either owners or contractors and thus the GPC wants to provide owners especially with some guidelines, which are based on AACE’s RP 18R-97 and 17R-97
Below is an example for a $30,000,000 (Thirty million USD) project:
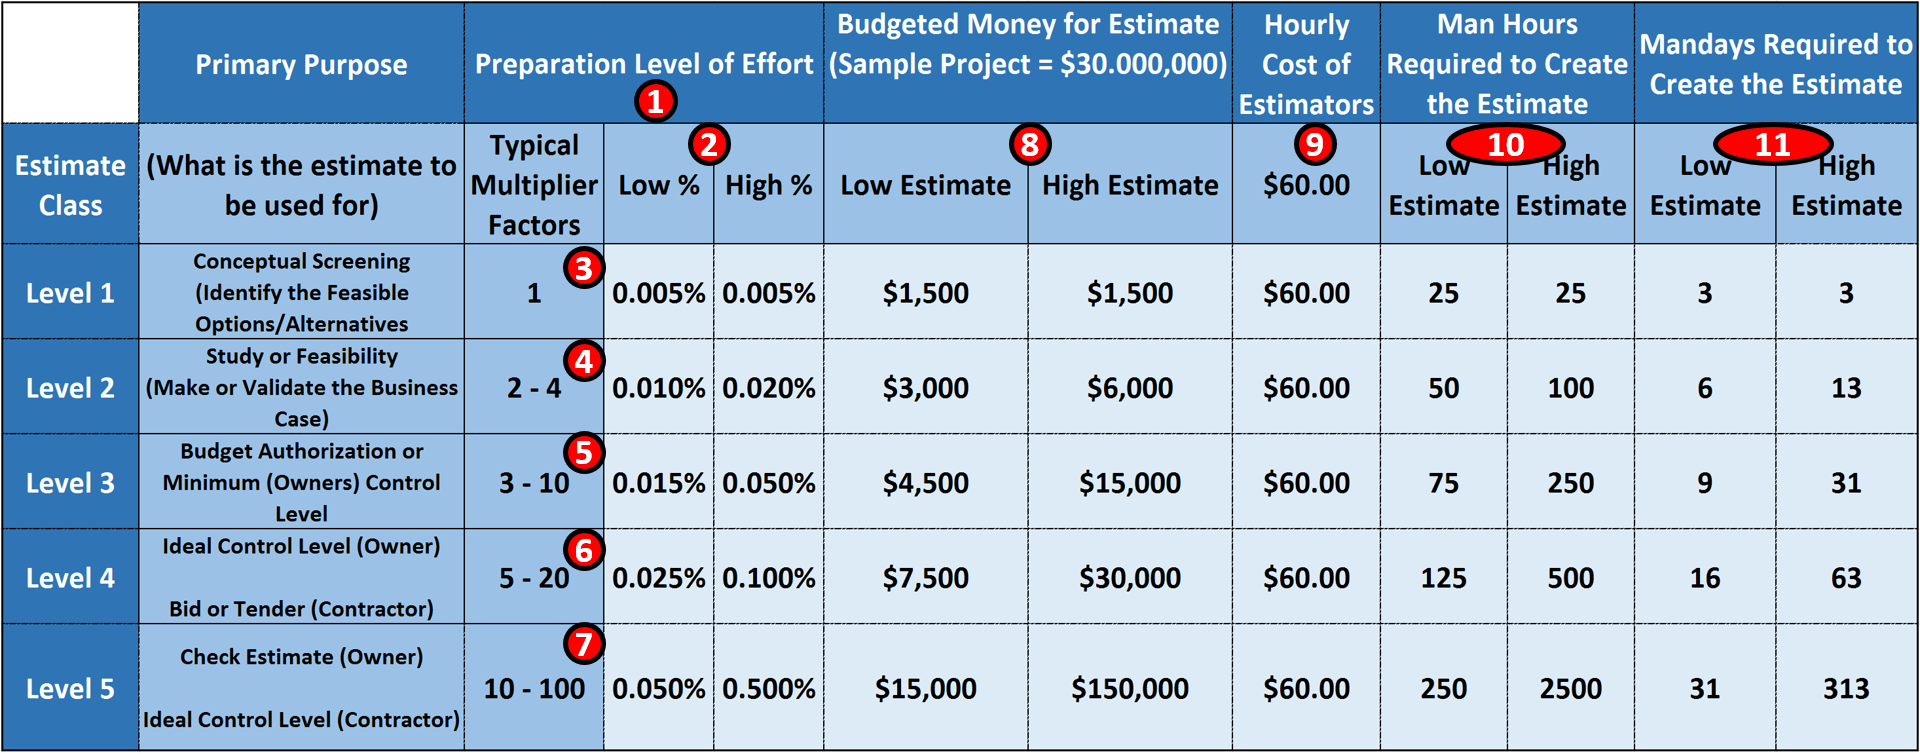
Figure 3 - How to Estimate How Long to Allow for a Cost Estimate to be done
Source: Giammalvo, Paul D (2015) Course Materials. Contributed Under Creative Commons License BY v 4.0
In the example above start with the GPC’s levels and their purpose as we have shown previously. But this time we have added columns showing:
(1) Preparation Level of Effort which is based on the ASSUMPTION that a Level 1 Cost Estimate takes 0,005% of the estimated project budget.
(2) The ASSUMPTION (which you will need to validate for your location and industry) is 0.005% of a project budget is required to create an accurate, reliable and precise Class 1 Cost Estimate.
(3) The Factor for a Class 1 Cost Estimate is 1 meaning 1 times 0.005% = 0.005%.
(4) A Class 2 Cost Estimate takes beween 2 to 4 times as much work effort, meaning 2 X 0.005% = 0.010% and 4 X 0.005% = 0.020%
(5) Class 3 takes 3 to 10 times as much effort as a Class 1 Estimate
(6) Class 4 Cost Estimate takes 5 to 20 times as many man hours or man days as a Class 1
(7) Lastly a Class 5 Cost Estimate takes 10 to 100 times as much effort as a Class 1 estimate. While it is unlikely that an owner would produce a Class 5 estimate, it is important that they have some undersanding of how long it takes to create one as owners have a terrible track record for putting 100 million dollar projects out to bid and only giving the contractor 5 days to prepare a bid.
Contractors don’t need to use this calculation because they are continually preparing cost estimates for bids, they have developed rules of thumb which tells them how many days it take to put together a bid for any particular size or type of project.
(8) Multiplying across we can see that the DOLLAR BUDGET for a Class 1 Estimate is $1,500
(9) If we are paying our Cost Estimators $60.00/hour and we divide $1,500/$60….
(10) We get $1,500/$60 = 25 = 25 man hours to create a Class 1 Estimate and
(11) Dividing 25 Man Hours/8 hour day = ~3 man days to create a class 1 cost estimate which is Accurate, Reliable and Precise with the appropriate ranges. If we look now to the Class 5 Cost Estimate, using the same formulas we can see that a Class 5 Cost Estimate can cost anywhere between $15,000 to $150,000 and take 250 man hours/31 man days to 2500 man hours or 313 man days. Which means assuming a contractor has a 5 person estimating team to produce a Class 5 Cost Estimate takes anywhere between 6 to 60 days. Owners need to keep that in mind when you are calculating how long to allow contractors to put together an accurate, reliable and precise cost estimate for your project.
This module is where, knowing the PURPOSE of the cost estimate, knowing the COMPETENCIES we have and the NUMBER of qualified professional estimators and a reasonable DURATION, we simply follow the process defined in the Process and Procedures Manual, we actually create the initial “neat” or “clean” estimate- an estimate using P50 values. Once we know what the “clean” or “neat” costs are for each Work Package or Activity, then we can start to analyze those numbers and test them, making appropriate adjustments.
Below are some selected screen shots from an excellent example of a well-constructed cost estimate which is coming to us from the US Park Service.
As you can see Figure 4 below:
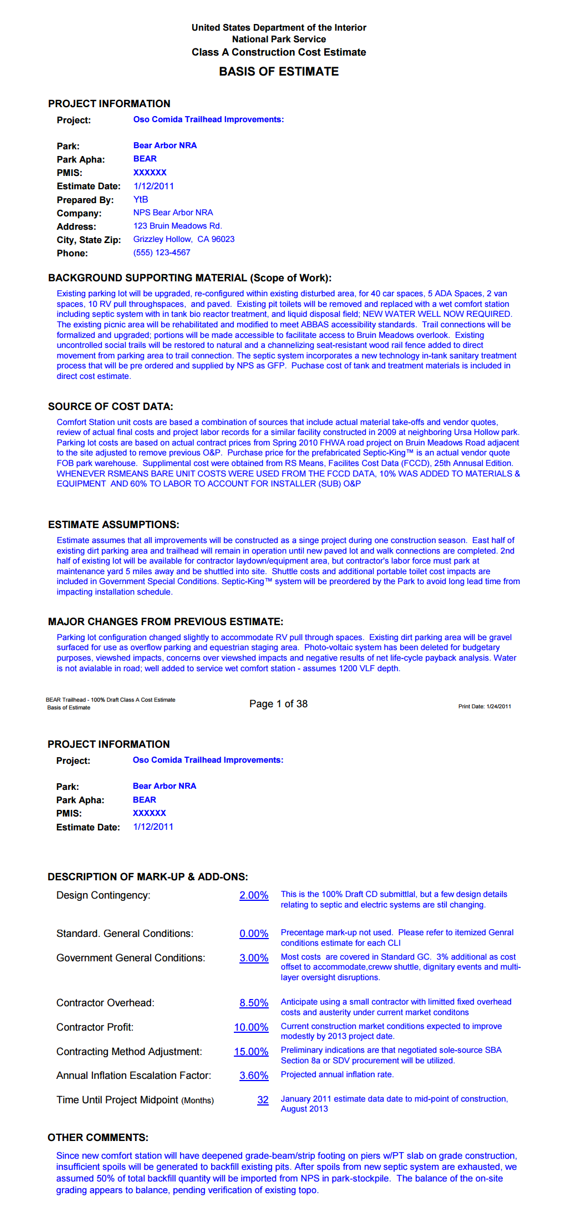
Figure 4 - The Basis for the Estimate
Source: US National Park Service Cost Estimating Handbook (2011)
Background Source of the Cost Data Assumptions/Constraints Major Changes Project Information Description of Mark Ups and Contingency (Cost Reimbursable Contract) Other comments.
This Excel based template is made available free of charge by the US Park Service. You can download it here. For those preparing for the various GPC certification exams, it would be in your best interests to download both the case study and the Excel template and familiarize yourself with how a well-constructed cost estimate is put together, paying close attention to the coding structures, as those are the key to integrating our costs to our schedule, both as an owner and as a contractor.
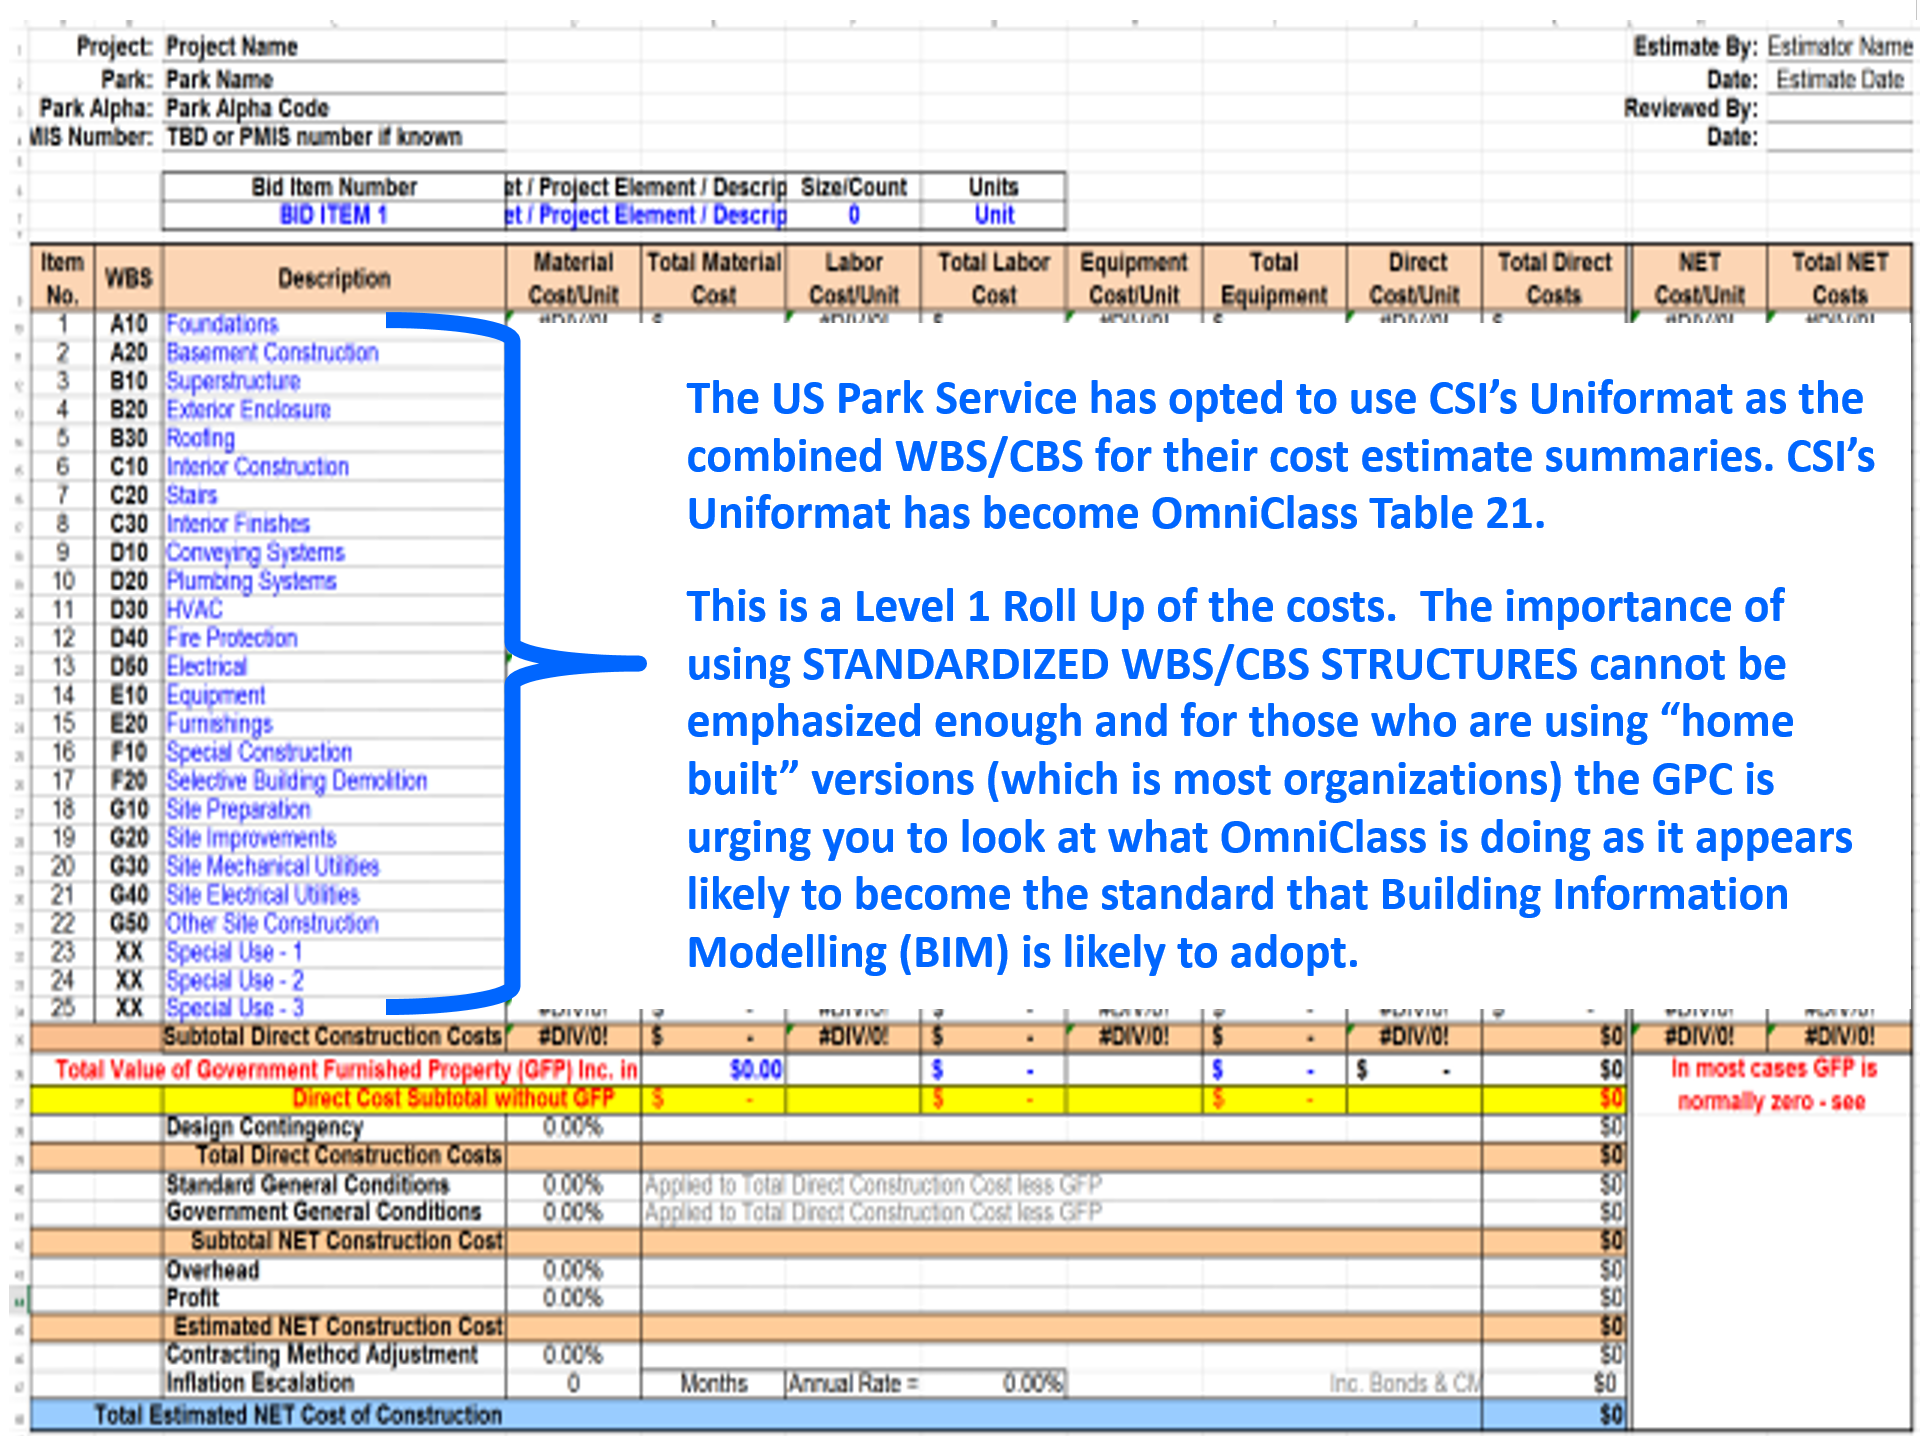
Figure 5 - Level 1 Roll Up of Costs Using CSI Uniformat/Omniclass Table 21
Source: US National Park Service Cost Estimating Handbook (2011)
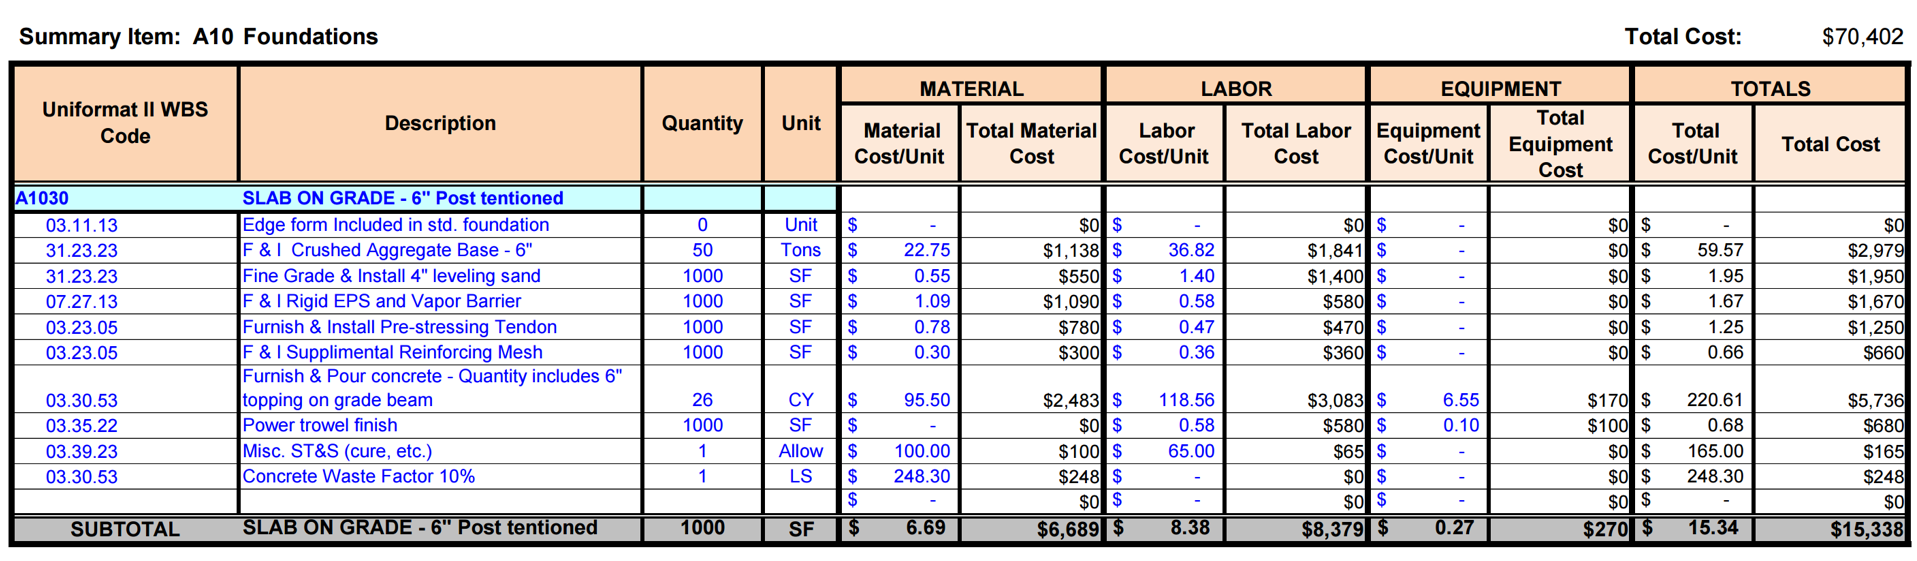
Figure 6 - Level 2 Roll Up of Costs Using CSI Uniformat/Omniclass Table 21
Source: US National Park Service Cost Estimating Handbook (2011)
Figure 6 above shows us a screen shot from the same Excel template above, but this time showing the Level 2 estimate.
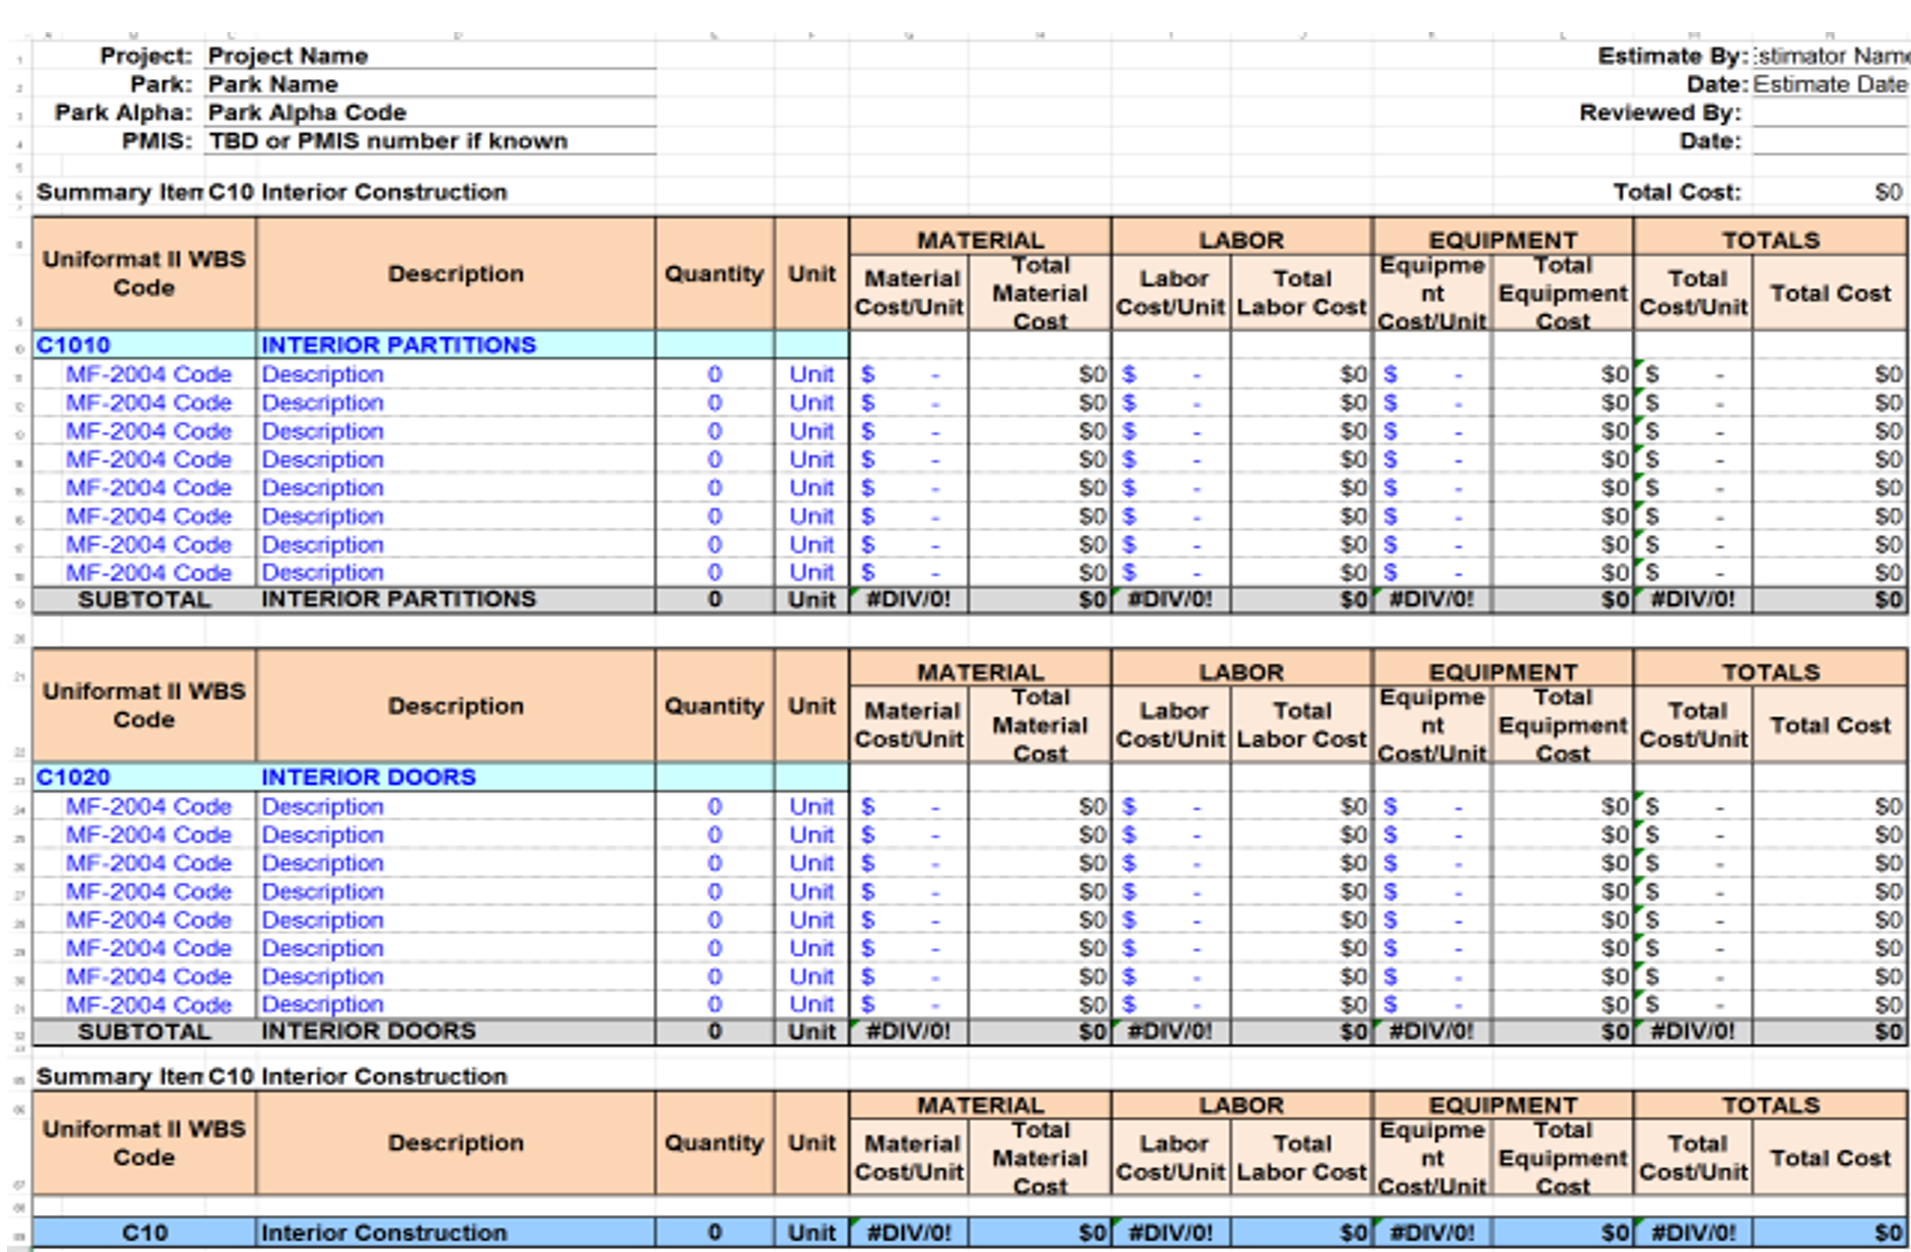
Figure 7 - Level 3 Cost Estimate for the same Project but now using CSI’s Masterformat/OmniClass Table 22
Source: US National Park Service Cost Estimating Handbook (2011)
And lastly, here is a screen shot of the same Excel template, but this time showing the Level 3 cost estimate, which even though is has been SUMMARIZED using CSI Unformat/OmniClass Table 21, the coding structure being used is CSI Masterformat/OmniClass Table 22
08.4.2 INPUTS
- Decision Support Package (DSP) From The Preceding Phase Gate Review Process
- Standardized WBS, Cost and Resource Coding Structures Agreed To
- Cost Estimating Templates
08.4.3 TOOLS & TECHNIQUES
08.4.3.1 Standardized WBS Structures
We know from Module 3 - Managing Scope that the three most well established STANDARDIZED WBS structures are:
(1) CSI’s Master and Uniformat for Facilities
- Master Format- http://www.csinet.org/Home-Page-Category/Formats/MasterFormat/About-MF/…
- Uniformat
(2) Norsok Z-014 for offshore Oil & Gas
(3) OmniClass Tables
- Masterformat Table 22 http://www.omniclass.org/pdf.asp?id=17&table=Table%2022
- Uniformat Table 2- http://www.omniclass.org/pdf.asp?id=6&table=Table%2021
08.4.3.2 Source of the Cost Data
For no other reason that R.S Means is probably the oldest (100+ years) and arguably has the largest or most complete databases, we have been using R.S. Means for our examples. (With their permission of course)
However, here are many other organizations who offer both general and specialized cost databases:
- SPONS- http://www.franklinandrews.com/publications/spons/
- Hutchins- http://www.franklinandrews.com/publications/hutchins/
- Griffiths- http://www.franklinandrews.com/publications/griffiths/
- Richardson’s- http://www.costdataonline.com/
- Compass- http://www.compassinternational.net/
- Marshal & Swift- https://www.marshallswift.com/faq-43.aspx
From the perspective of practicality, instead of “reinventing the wheel” it is often preferable to purchase one of these commercial databases just for the structure and coding, and then modify the numbers to fit your area of operations than it is to try to create your own from scratch.
08.4.3.3 Assumptions / Constraints
Our Business Dictionary defines “Assumptions” to be “Accepted cause and effect relationships, or estimates of the existence of a fact from the known existence of other fact(s). Although useful in providing basis for action and in creating "what if" scenarios to simulate different realities or possible situations, assumptions are dangerous when accepted as reality without thorough examination.
As cost estimators, we need to be asking “what assumptions are being made as the basis for this project moving forward? Examples of some common “assumptions” made in the evolution of projects in an owner’s organization are:
(1) Market Conditions- That the market will improve (or decline) resulting in favorable conditions for the project to produce a favorable return on assets or return on investment. For contractors, in times of little work (recessionary periods) they will often bid “at cost”, foregoing profits just to pay for their overhead and to keep their key employees working rather than laying them off. Owners need to keep this in mind as slow periods are the best time to perform CAPEX or OPEX funded projects as the bids will tend to be lower and the probability of manpower shortages will be reduced. Conversely, when times are good (non-recessionary periods) contractors can get away with increasing their profit margins and still winning bids but the risk is that manpower shortages result in them having to use less skilled/less productive trade professionals.
(2) Technology- That by the time this project is actually implemented, the technology selected for the project will not be technically obsolete.
(3) Resources- That there are there sufficient resources available (People, Machines, Money) to do this project. These are but a few examples of common assumptions which must be continuously challenged, tested and validated.
Constraints are defined to be an “Element, factor, or subsystem that works as a bottleneck. It restricts an entity, project, or system (such as a manufacturing or decision making process) from achieving its potential (or higher level of output) with reference to its goal."
In the context of cost estimating and budgeting, a constraint is something which has been imposed upon us, either by a management decision or a reality that we have to accept. Some common examples of constraints which impact project controls professionals are unrealistic time durations- i.e. you cannot deliver a healthy baby in 9 months by impregnating 9 women and expecting a healthy baby in one month. Another common constraint is not recognizing and accepting that trying to shorten the time frame can be done at less costs. There is an optimum time to do every project and to try to do it very far from that optimum has cost impacts. Another very common constraint is the actual or real number of resources available to do the job who are competent.
08.4.3.4 Major Changes
Changes do not only happen during the Execution Phase of a project. Often change happens between one Phase Gate and the next- scope is added or deleted, equipment specifications change and thus we need to be tracking changes as the project evolves and this information needs to be captured in the Decision Support Package (DSP) which is the approval document to move from one phase gate to the next. Project Control professionals need to have access to these DSP’s as they contain a wealth of information that we need to know and understand.
While most standardized contract documents (i.e. FIDIC, AIA, EJCDC, Consensus Docs etc) have clearly defined process for contractors to follow in the event of a change, rarely do owners put in place anywhere near as robust a change control system internally. This will be covered in more detail in Module 14- Managing Project Change.
08.4.3.5 Project Information
Project Information from the owner’s perspective comes from the Decision Support Packages which eventually evolves into the contract documents. For a contractor, the contract documents are the basis for his/her project information. Important to know and understand is the better and more complete job the owner’s project management team can do in defining what it is they want and converting that into clear project documents, the better pricing contractors will be able to provide and the fewer change orders, claims and disputes are likely to occur.
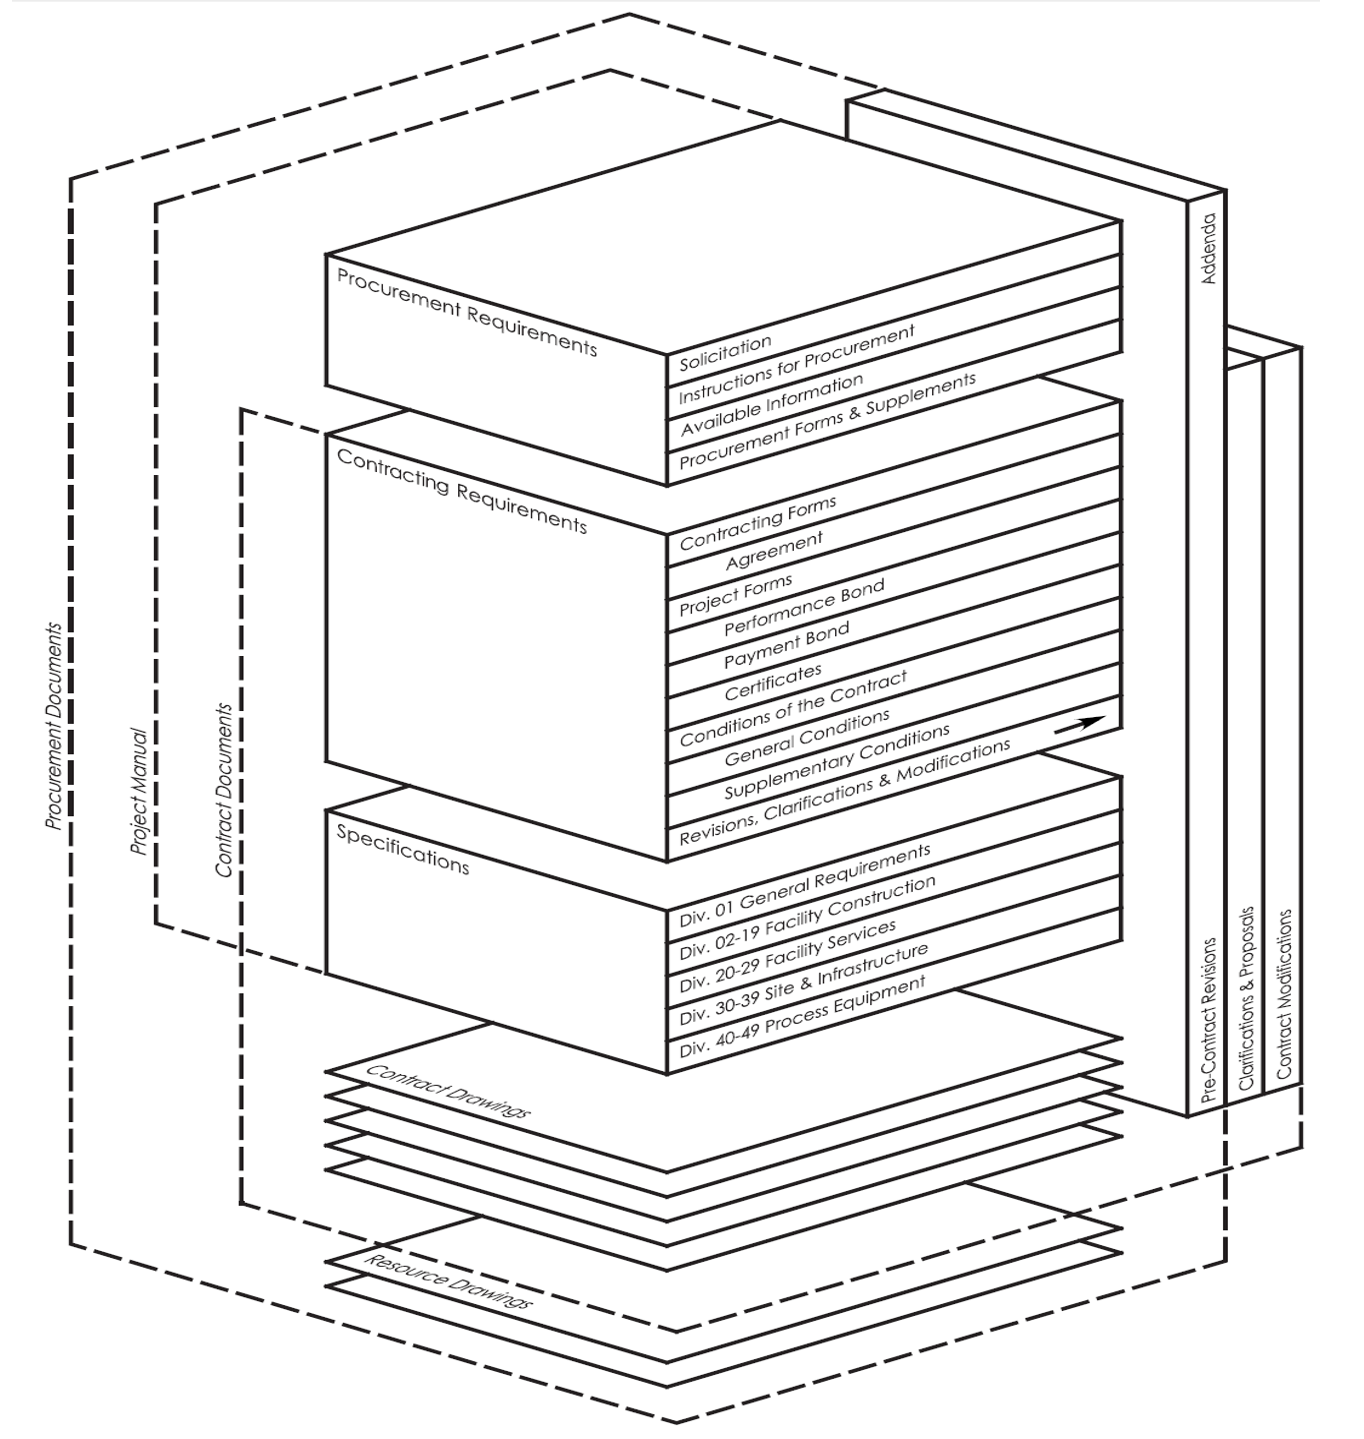
Figure 8 - Construction Specifications Institute Manual of Practice (Figure 5.1-A)
Source: Construction Specifications Institute’s Manual Of Practice 5th Edition
Showing the names of the Different Packages of Documents which the owner, directly or through their hired consultants, are responsible to prepare. The more complete and less ambiguous or conflicting the scope of work that the owner can provided to the contractor in the procurement package:
1) The more accurate, reliable and precise the contractors bids will be 2) The fewer change orders and claims owners are likely to see 3) The faster the project will be completed, as there will be less rework due to changes
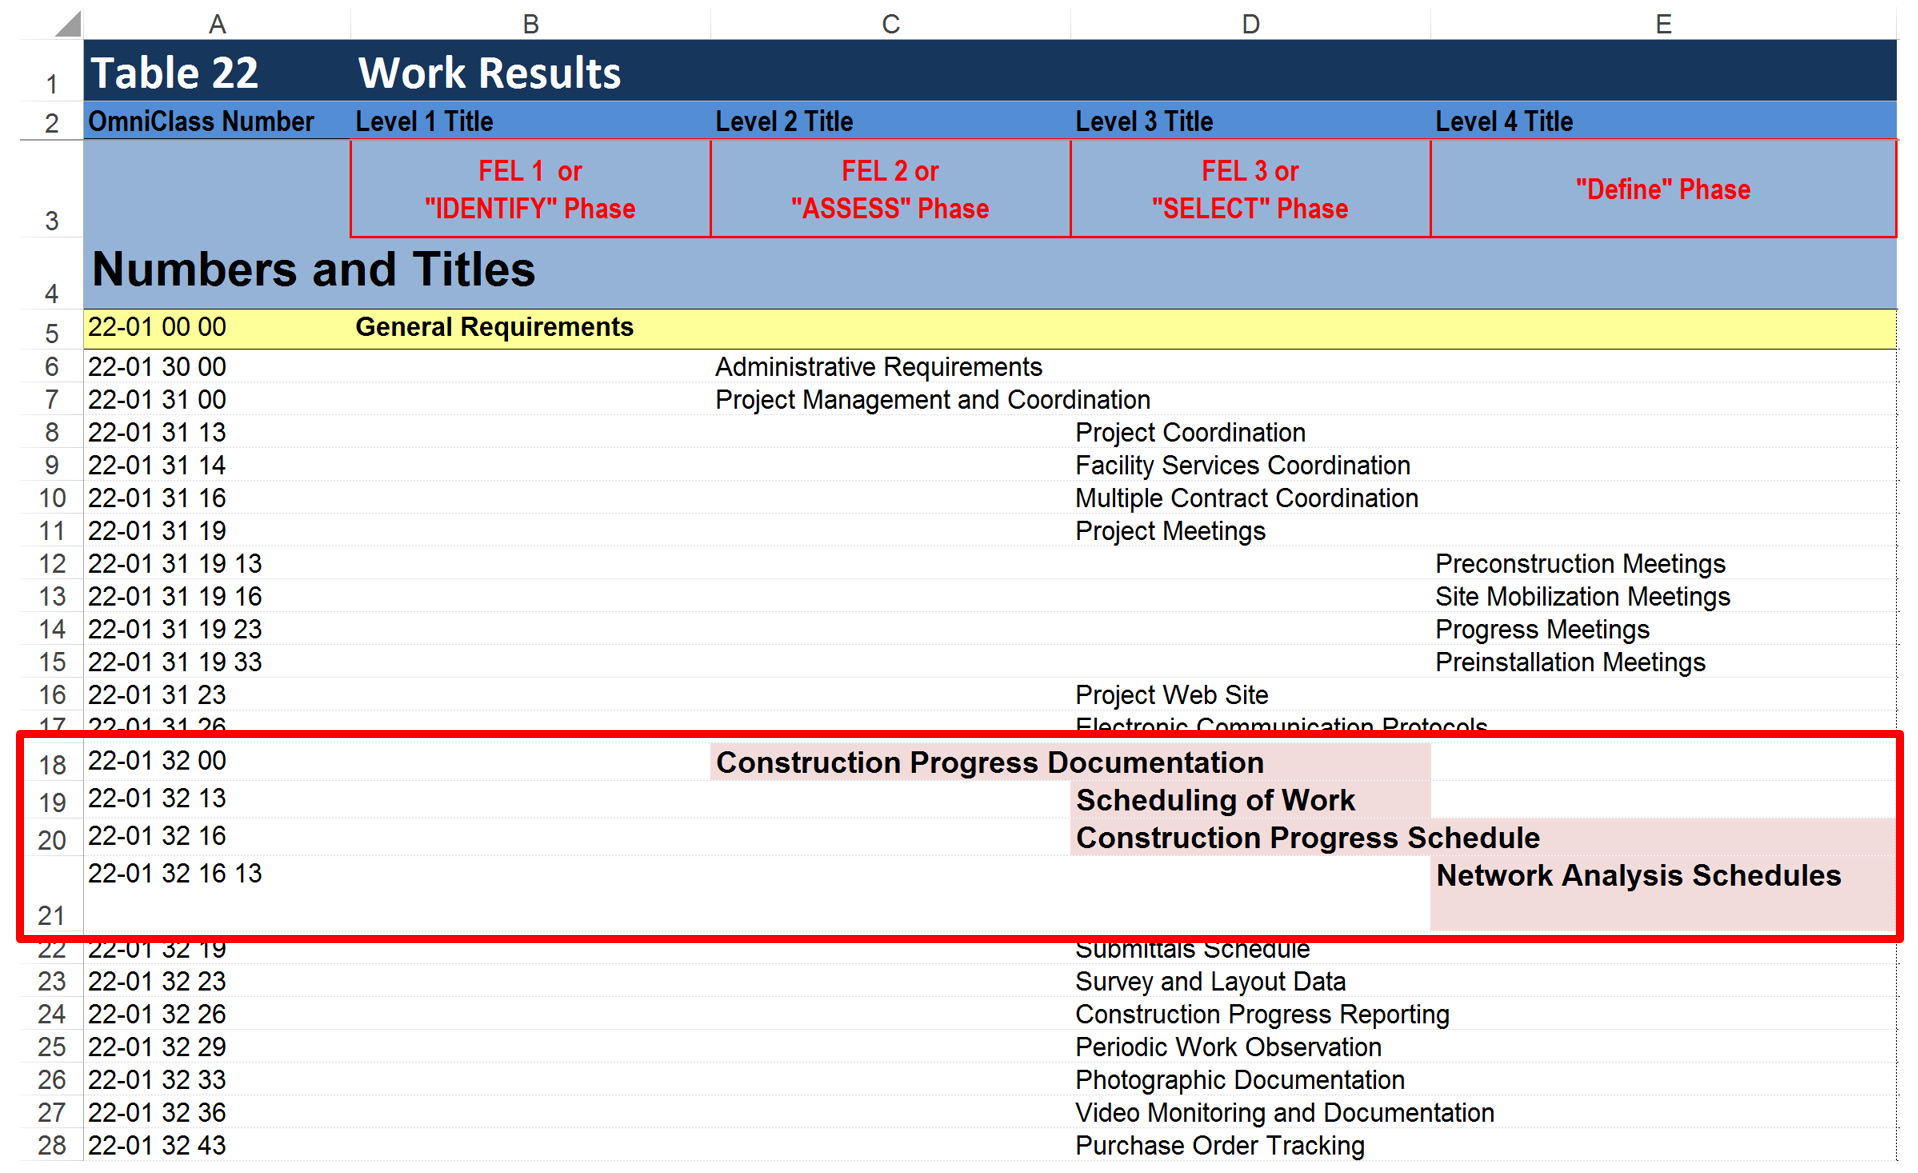
Figure 9 - Omniclass Table 22
Source: Omniclass Tables (n.d.)
Showing where the Specifications for Contract Progress Reporting can be found
08.4.3.6 Cost Estimating Software
While it would be inappropriate for the Guild of Project Controls to endorse any single cost estimating or scheduling software package, as a service to our member/owners of the organization, we will try to keep you updated as to what independent reviewers are saying about the various software packages. At the time of publication (Q4, 2015), here are three current software reviews of cost estimating software:
(1) Software Advice (2015) Compare Construction Cost Estimating Software http://www.softwareadvice.com/construction/cost-estimating-software-com…
(2) Captera (2015) Top Construction Estimating Software Products http://www.capterra.com/construction-estimating-software/
(3) Commercial Estimating Software Review (2015) http://commercial-estimating-software-review.toptenreviews.com/
08.4.3.7 Conceptual Screening- (GPC Level 1 Cost Estimate)
As we know, there is little or no standardization in the terminology used in project management and the chances of any sector, region or even company changing their terminology voluntarily is close to zero. For that reason we have to describe the PURPOSE of each estimate and you will have to find out what the name for the estimate to fulfill that purpose is called in your sector business.
Thus the purpose of the conceptual screening estimate is to serve as input to the business case. IF the cost of the project is too high, it will lower the return on investment, understanding that if the return on investment is below either the Weighted Average Cost of Capital (WACC) or the Minimum Attractive Rate of Return (MARR) the project will not be funded and will be killed off. For this reason, as cost estimators we need to be appropriately conservative- like Goldilocks and the three bear story, we cannot be too high nor too low, but “just right”. What is “appropriately conservative” defined to be? Taking a P50 value of similar projects, we should be providing our top management with a RANGE ESTIMATE that falls within +100% of the mean and -50%. Why the imbalance? Because as human beings, we tend to be overly optimistic to start with, and given between 69% of projects exceed their budgets by 10% or more, indicates that 100% at the conceptual stage is not an unreasonable assumption. Management will then use your ranges of costs as the basis to conduct the business case analysis.
As the first phase is where we make the initial business case, we need a cost estimate to serve as the basis to determine how much of an INVESTMENT we need. There are 3 methods we can use which will give us the appropriate accuracy range of +100 to -50%. They are:
08.4.3.7.1 Capacity Factored Method
The Capacity Factored Method is used when enough historical data are available from similar work based on the capacity of that work. The method uses the capacity relationship of existing work data to that of the capacity of similar new work. It accounts for economies of scale, but not location or timing of the work.
For example, consider a known power plant that produces 250 MW(t)/hour and costs $150,000,000 to construct.
A new plant will produce 300 MW(t)/hour.
From historical data, 0.75 is the appropriate capacity factor.
Using the equation Cost (new) = Cost (known) (Capacity (new)/ Capacity (known)e
Where: e = capacity factor derived from historical data Cost (new) = $150,000,000 (300/250).75 Cost (new) = $172,000,000 (rounded).
08.4.3.7.2 Parametric Modelling or Parametric Estimate
Parametric estimating requires historical data bases on similar systems or subsystems. Data is derived from the historical information or is developed from building a model scenario. Statistical analysis is performed on the data to find correlations between cost drivers and other system parameters, such as design or performance parameters. The analysis produces cost equations or cost estimating relationships that can be used individually or grouped into more complex models. This technique is useful when the information available is not very detailed. The Parametric model takes the Capacity Factored model one step further by adjusting for time and location.
Case Study-
You constructed a high speed broadband rollout in India in 2012 for 500,000 subscribers at a cost of $100,000,000 USD. You are doing exactly the same project in Brazil in 2015, but for 1,000,000 subscribers. How much do you predict the cost will be in 2015 in Brazil?
FORMULA: C2 = C1 (Q2/Q1)X
Where:
- C1 = Known Cost in baseline location (Bombay)
- C2 = Unknown Cost in new location (Brazil)
- Q1 = Size in baseline location (Bombay)
- Q2 = Size in proposed location (Brazil)
- X = YOUR HISTORICAL Scale of Operations factor (0.65 – 0.70 is common)
- CI1 = Cost Index in baseline location (Bombay) (1850 in 2012)
- CI2 = Cost Index in proposed location (Brazil) (2475 in 2015)
First calculate size factor: $100,000,000 X (1,000,000/500,000)0.7 = $162,450,000
Then adjust for location and time: $162,450,000 X (2475/1850) = $217,332,000 Estimate for Brazil Project
Another type of Parametric Estimate is known as the Analogy or Cost Estimating Relationship (CER) or Cost Estimating Model (CEM)
08.4.3.7.3 Analogy or Cost Estimate Relationship (CER) or Cost Estimating Model (CEM)
Specific analogies depend upon the known cost of an item used in prior systems as the basis for the cost of a similar item in a new system. Adjustments are made to known costs to account for differences in relative complexities of performance, design, and operational characteristics. This is often developed creating a regression model. (Linear or “Best Fit”).
Cost estimating relationships (CERs), also known as cost models, are developed from historical data for similar systems or subsystems.
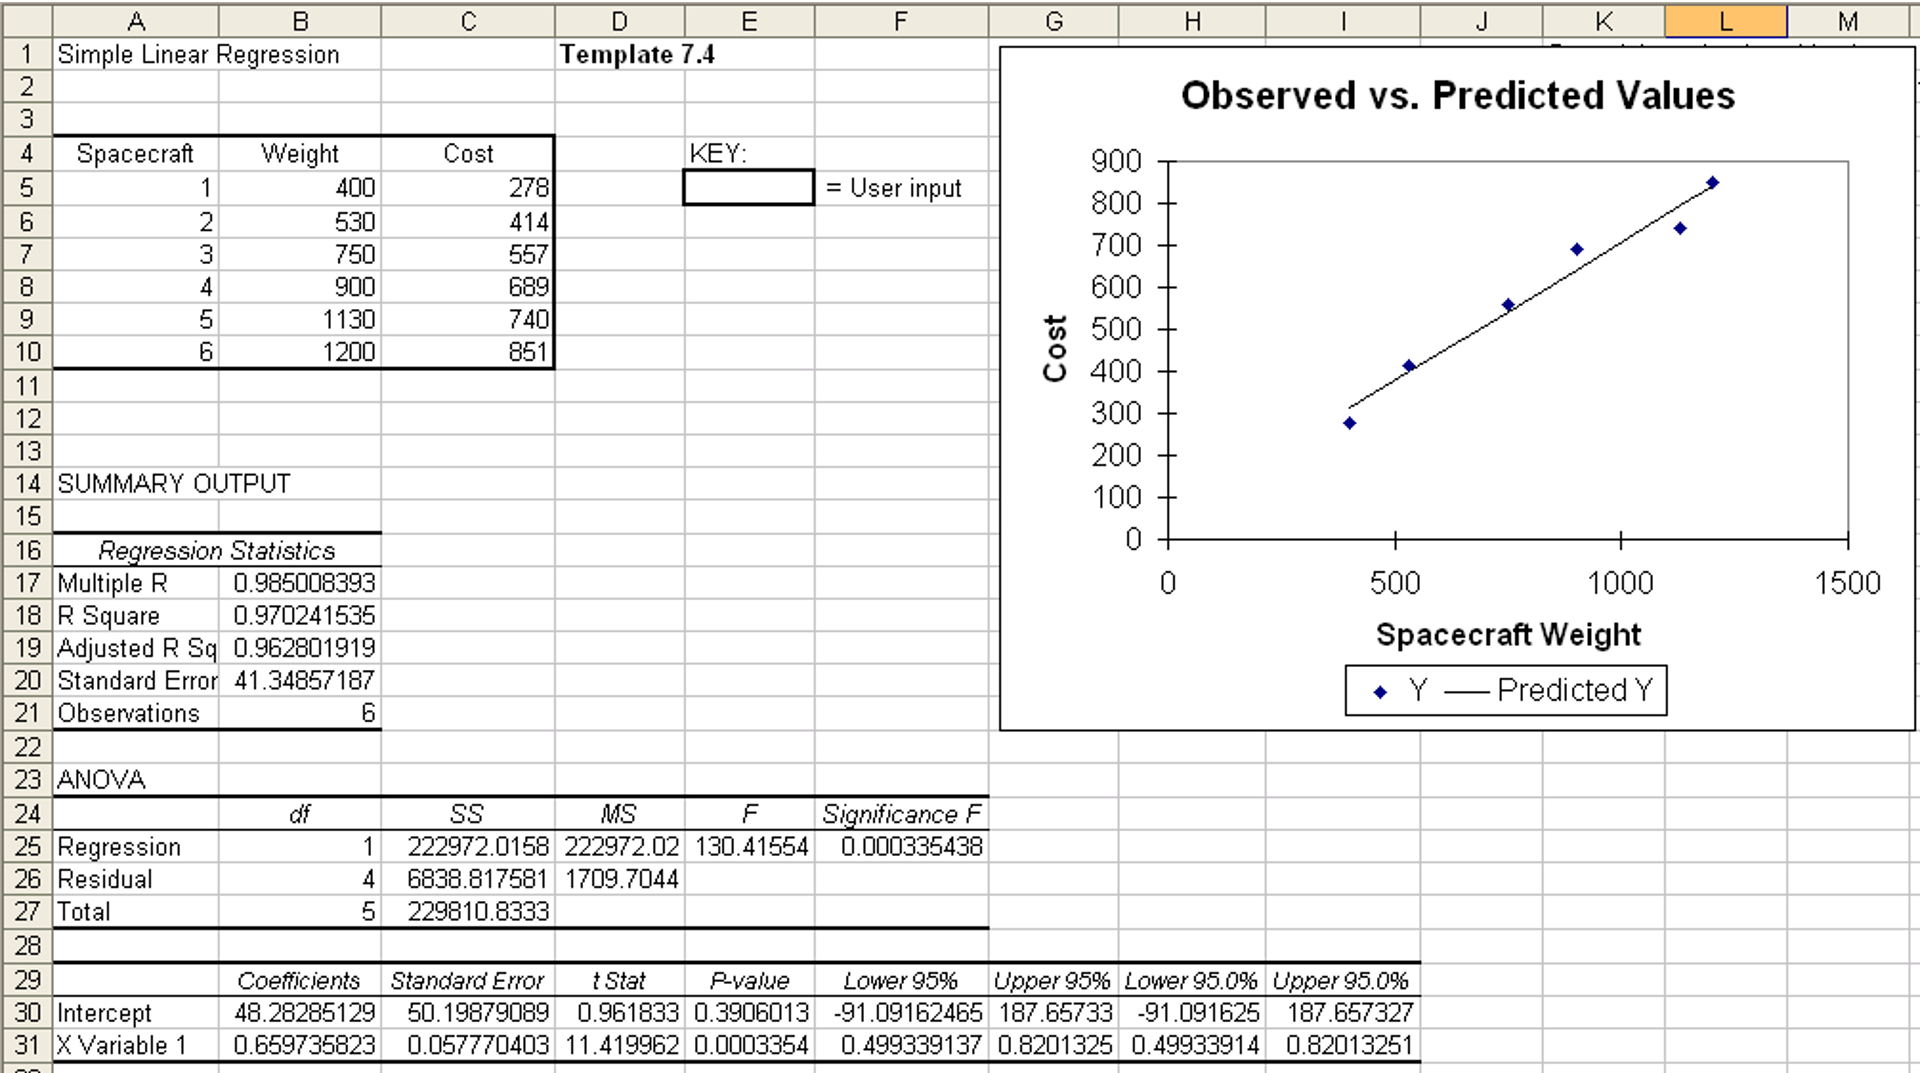
Figure 10 - Cost estimating relationships (CERs)).
Source: Sullivan, Wickes & Kroelling (2014) Engineering Economics 15th Edition
The example above is taken from NASA, showing the relationship between cost and spacecraft weight. A CER is used to estimate a particular cost or price by using an established relationship with an independent variable. For example, a CER of design hours per drawing may be applied to the estimated number of drawings to determine total design hours. Identifying an independent variable (driver) that demonstrates a measurable relationship with contract cost or price develops a CER. That CER may be mathematically simple in nature (e.g., a simple ratio), or it may involve a complex equation. The regression model may be linear or it may involve “best fit” curves.
There are several advantages to parametric cost estimating. Among them are:
- Versatility—if the data are available, parametric relationships can be derived at any level (system, subsystem component, etc.). As the design changes, CERs can be quickly modified and used to answer “what-if” questions about design alternatives.
- Sensitivity—Simply varying input parameters and recording the resulting changes in cost will produce a sensitivity analysis
- Statistical output—parametric relationships derived through statistical analysis will generally have both objective measures of validity (statistical significance of each estimated coefficient and of the model as a whole) and a calculated standard error that can be used in risk analysis. This information can be used to provide a confidence level for the estimate based on the CERs predictive capability.
There are also disadvantages to parametric estimating techniques, including:
- Database requirements— the underlying data must be consistent and reliable. In addition, it may be time-consuming to normalize the data or to ensure that the data were normalized correctly. Without understanding how data were normalized, the estimator is accepting the database on faith, thereby increasing the estimate’s risk.
- Currency—CERs must represent the “state-of-the-art;” that is, they must be periodically updated to capture the most current cost, technical, and programmatic data.
- Relevancy—using data outside the CER range may cause errors because the CER loses its predictive capability for data outside the development range.
- Complexity—Complicated CERs (e.g., non-linear CERs) may be difficult for others to readily understand the relationship between cost and its independent variables.
Below are two “real life” examples of creating a cost estimating relationship using ounces of gold rather than US dollars, one for oil and gas and the other for telecommunications. The reason for using gold equivalency was to address the problem above of currency fluctuations.
- Oil & Gas example - Asmoro, Trian Hendro (2013) http://pmworldjournal.net/article/exploring-gold-equivalency-for-foreca…
- Telecommunications example - Sellapan, Hari Kumar, (2015) http://pmworldjournal.net/?article=exploring-gold-as-alternative-curren…
In both these case studies, the authors chose to create a model using “best fit” curve feature in Excel. To learn more about this powerful cost estimating tool, here are several references:
- Extend Office (2013) http://www.extendoffice.com/documents/excel/2642-excel-best-fit-line-cu…
- Lee, William (n.d.) http://www.cpp.edu/~seskandari/documents/Curve_Fitting_William_Lee.pdf Thomas, Randy (2013) https://www.youtube.com/watch?v=0ienbLvFddQ
For the purposes of your GPC certification exams, keep in mind that you should not be using a cost model to extrapolate costs into the future unless you can generate a model with an R^2 value of >0.90.
08.4.3.8 Expert Opinion Technique
When other techniques or data are not available, this method may be used. Several specialists can be consulted repeatedly until a consensus cost estimate is established. This method is also known as the PERT FORMULA and was covered in great detail in Module 2.3- Managing Risks/Opportunities. This method utilizes the Delphi or Nominal Group Technique to gather the data then applies the PERT FORMUAL ((Best Case + (4 X Most Likely) + Worst Case)/6 = Weighted Mean or Weighted Average value)
Referring back to Module 4 - Managing Risk & Opportinity and Module 7 - Managing Planning and Scheduling, we know there are two ways to build risk contingency into our schedules or budgets.
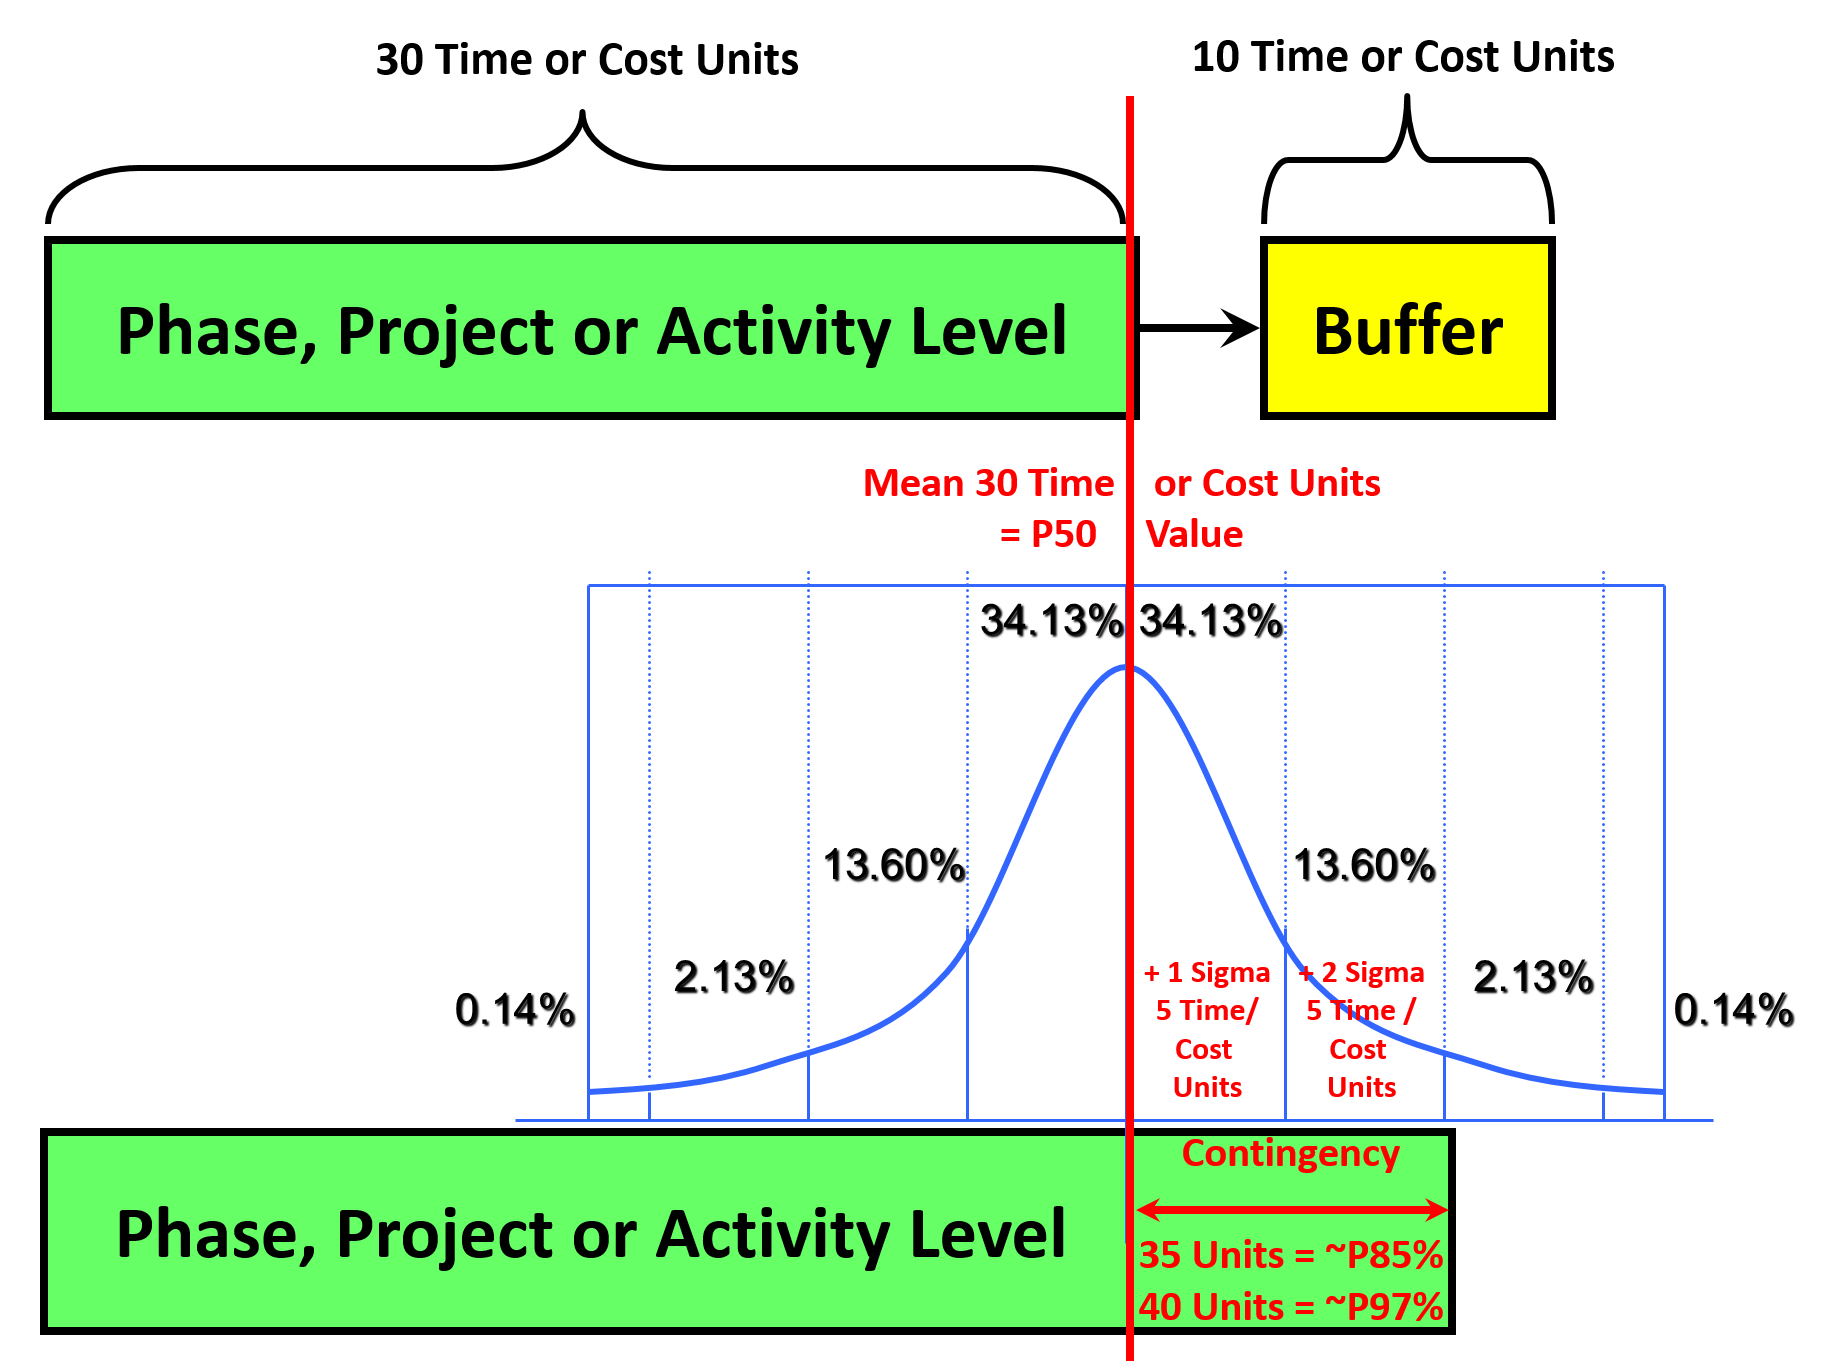
Figure 11 - Building risk contingency into our schedules or budgets
Source: Giammalvo, Paul D (2015) Course Materials Contributed Under Creative Commons License BY v 4.0
One is by adding a BUFFER (based on Eli Goldratt’s Theory of Constraints” and the second method is by “burying” it in the cost of an activity.
In cost estimating, if we have an UNALLOCATED pool of money, that is, it is not allocated to a work package or activity, then it is known as MANAGEMENT RESERVE. Management Reserve is set aside to cover UNKNOWN-UNKNOWNS. It is NOT included in the performance measurement baseline of a project (The S curve) as it is not owned or controlled by the project manager/project control team. If the project team needs to access this pool of money, then we need to go to the appropriate management level, make a case why we need it and it may or may not be granted. In most organizations this is not a single person but what is often known as a “Change Control Board” or “Steering Committee”. In the oil and gas sector, this pool of unallocated money is often owned and controlled by the Ministry of Oil and Gas or Natural Resources.
For money that IS allocated to a work package or specific activity, this is known as CONTINGENCY and it is calculated by and is owned and controlled by the project manager/project controls team. This allocate money is used to cover KNOWN UNKNOWNS.
For more on this topic, refer back to Module 4 - Managing Risk & Opportunity
The reasons we need this information is in order to create a credible business case, management needs to know realistically what a project is going to need for investment funds. Failure to have an accurate, reliable and appropriately precise cost estimate can result in poor business decisions. (Garbage In/Garbage Out or GIGO)
At this phase in the project gestation process, below are the common tools/techniques which need our cost range estimates at the appropriate level as inputs:
08.4.3.8.1 Study or Feasibility - (GPC Level 2 Cost Estimate)
This is normally a “short list” of potential projects which have passed the first test, which is the business case. Now that we know the business case is workable at the “Worst Case” (Mean +100% scenario), “Best Case (Mean -20% scenario) and “Most Likely” case using the Mean or P50 value. In the feasibility study, we have to further evaluate the cost estimate and durations made in the first phase. To do this, we apply what is known as “assumption testing”, where we critically challenge the original estimate, schedule and business case assumptions provided in the first phase Decision Support package (DSP) At the end of this phase the short list of options has been narrowed down to the single “best” option at which time the project will undergo one final round of review before being funded. Only when a project has been funded is it “really” a project.
As the primary concern during this phase is “can this project technically be done within the time and monetary budgets” developed in the business case? So in ADDITION to the standard estimating and financial analysis tools and techniques above, we ADD the following:
08.4.3.8.2 Life Cycle Cost /Costing
Life Cycle Cost is defined to be the “Sum of all recurring and one-time (non-recurring) costs over the full life span or a specified period of a good, service, structure, or system. In includes purchase price, installation cost, operating costs, maintenance and upgrade costs, and remaining (residual or salvage) value at the end of ownership or its useful life.”
While Life Cycle Costing is defined to be the “ Procurement and production costing technique that considers all life cycle costs. In procurement, it aims to determine the lowest cost of ownership of a fixed asset (purchase price, installation, operation, maintenance and upgrading, disposal, and other costs) during the asset's economic life. In manufacturing (as an integral part of terotechnology), it aims to estimate not only the production costs but also how much revenue a product will generate and what expenses will be incurred at each stage of the value chain during the product's estimated life cycle duration.
It can be used by both owners and contractors alike to determine what the optimum piece of equipment or tool that we should consider purchasing to accomplish a specific task.
Owner’s usually apply this during the design phase trying to decide whether to invest in a higher up front cost for a piece of equipment which may last longer and/or has a lower operating cost or is it better to purchase a cheaper piece of equipment that may not last as long and/or has higher operating costs.
Contractors take exactly the same approach, however they apply the same analysis to a piece of equipment they purchase to make their operations more cost effective. As an example, few contractors pay much attention to drills, electric power saws and other hand tools as they are expensed (written off) on a single project and if they last longer than one project, then great. However for more expensive items like exavators, cranes and bulldozers, which will last for more than a single project, the contractors too will do a life cycle cost analysis.
08.4.3.8.3 Calculating the Total Life Cycle Cost (LCC)
According to the Hydraulic Institute (www.pumps.org), life-cycle-costing for pumps is calculated as following:
- LCC = Cic + Cin + Ce + Co + Cm + Cs + Cenv + Cd
Whereas:
- Cic = initial costs, purchase price (pump, system, pipe, auxillary services)
- Cin = installation and commissioning cost (including training)
- Ce = energy costs (predicted cost for system operation, including pump driver, controls, and any auxillary services)
- Co = operation costs (labor cost of normal system supervision)
- Cm = maintenance and repair costs (routine and predicted repairs)
- Cs = downtime costs (loss of production)
- Cenv = environmental costs (contamination from pumped liquid and auxiliary equipment)
- Cd = decommissioning / disposal costs (including restoration of the local environment and disposal of auxiliary services)
For those wanting to learn more about Life Cycle Costing below are some additional references:
(1) US General Services Administration (2015) http://www.gsa.gov/portal/content/101197
(2) Stanford University (2015) Guidelines for Life Cycle Cost Analysis https://lbre.stanford.edu/sites/all/lbre-shared/files/docs_public/LCCA1…
(3) Chakravorti, Nirjhar (2009) http://www.slideshare.net/nirjhar_jgec/life-cycle-cost-analysis
08.4.3.8.4 Equipment Factored Cost Estimating
The Ratio or Factor Method is used when historical building and component data are available from similar work. Scaling relationships of existing component costs are used to predict the cost of similar new work. This method is also known as “equipment factor” estimating. The method does not account for any economies of scale, or location or timing of the work.
To illustrate, if a plant that cost $1,000,000 to construct has major equipment that costs $300,000, then a factor of 3.33 represents the plant cost to equipment cost “factor.” If a proposed new plant will have $600,000 of major equipment, then the factor method would predict that the new plant is estimated to cost $600,000 x 3.33 = $2,000,000.
Here are three recent papers published on this topic which helps to explain how to develop and use Equipment Factored Estimates:
- Wain, Yosef Asro (2014) http://pmworldjournal.net/article/updating-lang-factor-testing-accuracy…
- Patwari, Brij (2013) AACE Factored Cost Estimation http://www.slideshare.net/brijpatwari/aace-factored-cost-estimation
- Whitesides, Randall W (2012) Process Equipment Cost Estimating by Ratio and Proportion http://www.pdhonline.org/courses/g127/g127content.pdf
08.4.3.8.5 Percentage or Ratio Factored Cost Estimate
This is a variation on the equipment factored method that uses ratio analysis or percentages to take a known cost and extrapolate it into an overall cost.
In the example shown in Figure 12 below, we see an example of a 5-10 story office building taken from the R.S. Means 2008 Facilities Cost Estimating Handbook.
You can see that in Column labelled: (1), the structure has been broken down into components- 1.0 Foundation, 2.0 Substructure, 3.0 Superstructure etc. In this case, Mean’s chose CSI’s Uniformat, which is now OmniClass Table 21. In the extreme right hand column (2) we see the percentages of costs that each component represents. So given you know the cost of the foundations was $90,000, and given you know that foundations represents 1.8% of the costs, then $90,000/1.8 = $5,000,000. This would be the estimated DIRECT COSTS. To that, we would add (3) 15% Contractor General Conditions ($750,000) and 6% for Architects fees ($300,000) which would give us a total estimated cost of $5,000,000 + $750,000 + $300,000 = $6,050,000. Other variations on this include cubic feet or cubic meters or square feet or square meters.
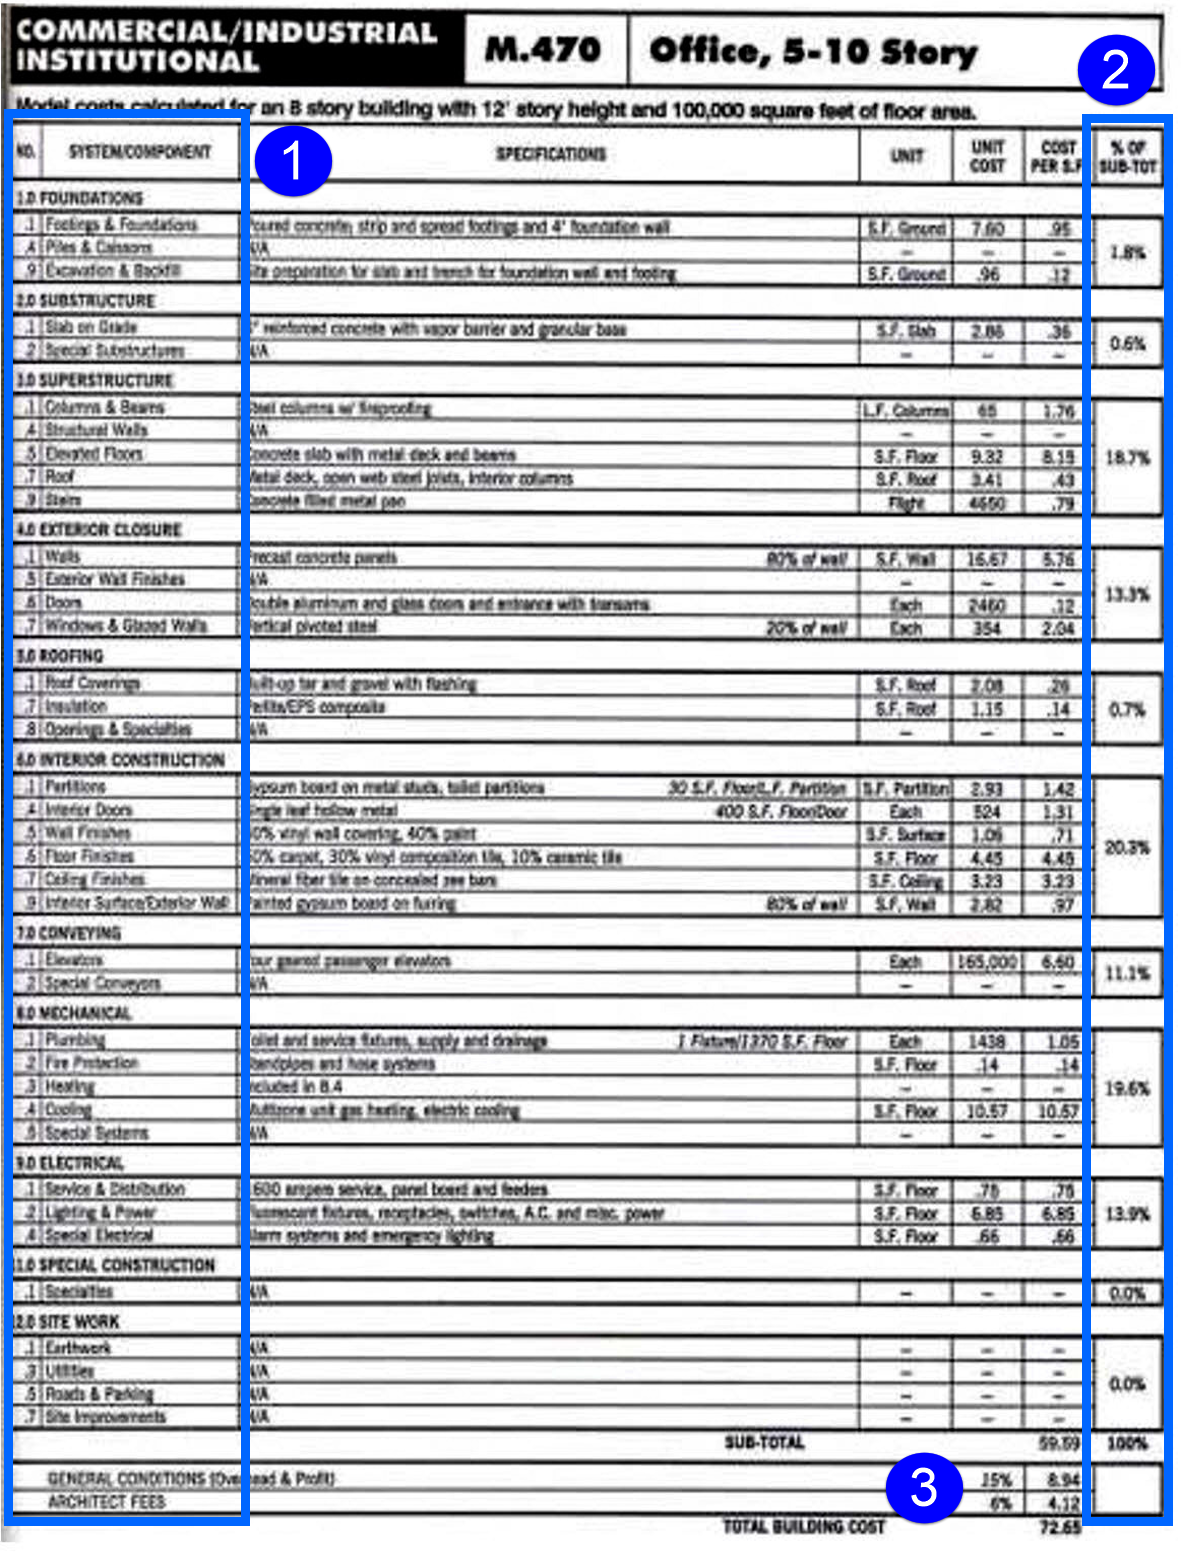
Figure 12 - Demonstrating the Percentage or Ratio Factored Method
Source: R.S. Means 2008 Facility Cost Estimating Database Ratio or Factored Estimating Example
08.4.3.9 Value Analysis / Value Engineering
Value Analysis/Value Engineering is defined to be: “1.Manufacturing: Systematic analysis that identifies and selects the best value alternatives for designs, materials, processes, and systems. It proceeds by repeatedly asking "can the cost of this item or step be reduced or eliminated, without diminishing the effectiveness, required quality, or customer satisfaction?" Also called value engineering, its objectives are (1) to distinguish between the incurred costs (actual use of resources) and the costs inherent (locked in) in a particular design (and which determine the incurring costs), and (2) to minimize the locked-in costs and 2.Purchasing: Examination of each procurement item to ascertain its total cost of acquisition, maintenance, and usage over its useful life and, wherever feasible, to replace it with a more cost effective substitute. Also called value-in-use analysis.
- The formula to calculate Value is: Value = (Performance + (Capability/Cost)) = Function/Cost
Put in the context of cost estimating, during this phase of the project’s evolution, we are trying to see if we can reduce or keep the costs and/or durations within the constraints and assumptions provided in the Decision Support Package. This may or may not be possible but if it is NOT, then we, as professional project control practitioners, have a professional if not a legal obligation to bring this to the attention of the appropriate decision makers. Failure to do so is, or should be, a serious ethical violation.
Value Engineering can be used both by owners project controllers during the DESIGN phase of the project to come up with the most cost efficient DESIGN, while contractors typically apply Value Engineering tools & techniques as part of their “Constructability” reviews- trying to create a competitive advantage over other bidders by trying to figure out a way to do an activity or series of activities more efficiently or effectively.
For more reading on Value Analysis/Value Engineering below are three references:
(1) Duwal, Khakindra (2013) http://www.slideshare.net/khakindra/value-analysis-16193425
(2) Crow, Kenneth (2002) http://www.npd-solutions.com/va.html
(3) Society of Value Engineers (SAVE) http://www.value-eng.org/
08.4.3.10 Budget, Authorization or Control (GPC Level 3 Cost Estimate)
For most owner organizations this is the final step before a project formally recognized as being a project, which is evidenced by it being funded. This process goes by many names but in the oil, gas and much of the mining sector this is known as the “AFE” or “Approve for Expenditure”. This is the last chance for the owner’s project manager to uncover any errors or omissions in the scope of work, the cost budget or the schedule before the project is formally submitted to the shareholders and/or government agency to provide the money necessary to execute this project. This phase is often where project control professionals are being put under the heaviest pressure to find ways to keep the costs down as low as possible and/or shortening the schedule, and this is often where politics over-rides sound professional judgment supported by empirical calculations, which so often results in “death march” projects.
For more sophisticated and cost conscious owners at this point in the cost estimating/cost budgeting process, they will often hire a quantity surveyor or cost consultant to produce an INDEPENDENT COST ESTIMATE (ICE). The purpose of this is to validate the accuracy, reliability and precision of their own internal cost estimate prior to seeking approval from their shareholders and/or government agencies to provide funding and approvals to execute this project.
The type of estimate most commonly used method for a Level 3 Estimate is, in addition to more refined versions of the methods described above is the Assembly method.
Assembly Method-
This method is ideal for any type of modular units-Palletized pumps, switchgear, motors or any other packaged units which have been standardized. The example to the right comes to us from R. S. Means 2008 Facilities Cost Estimating Guide and illustrates how either owners or contractors can “package” standardized units into a very clearly defined and competitively priced module.
This works perfectly with the concept of Building Information Modeling (BIM) as many of the “objects” the design engineer will have the options of including in their design will be these modularized, or skid mounted pieces of equipment, basically having been fabricated and pretested as a “plug and play” installation. Below are some additional examples where this modularized construction have already been tested and proven to work. This enables cost estimators to quickly and accurately develop Level 3 cost estimates and schedules, as the basis to validate the Level 1 and Level 2 estimates prepared during the earlier phases of the project gestation period.
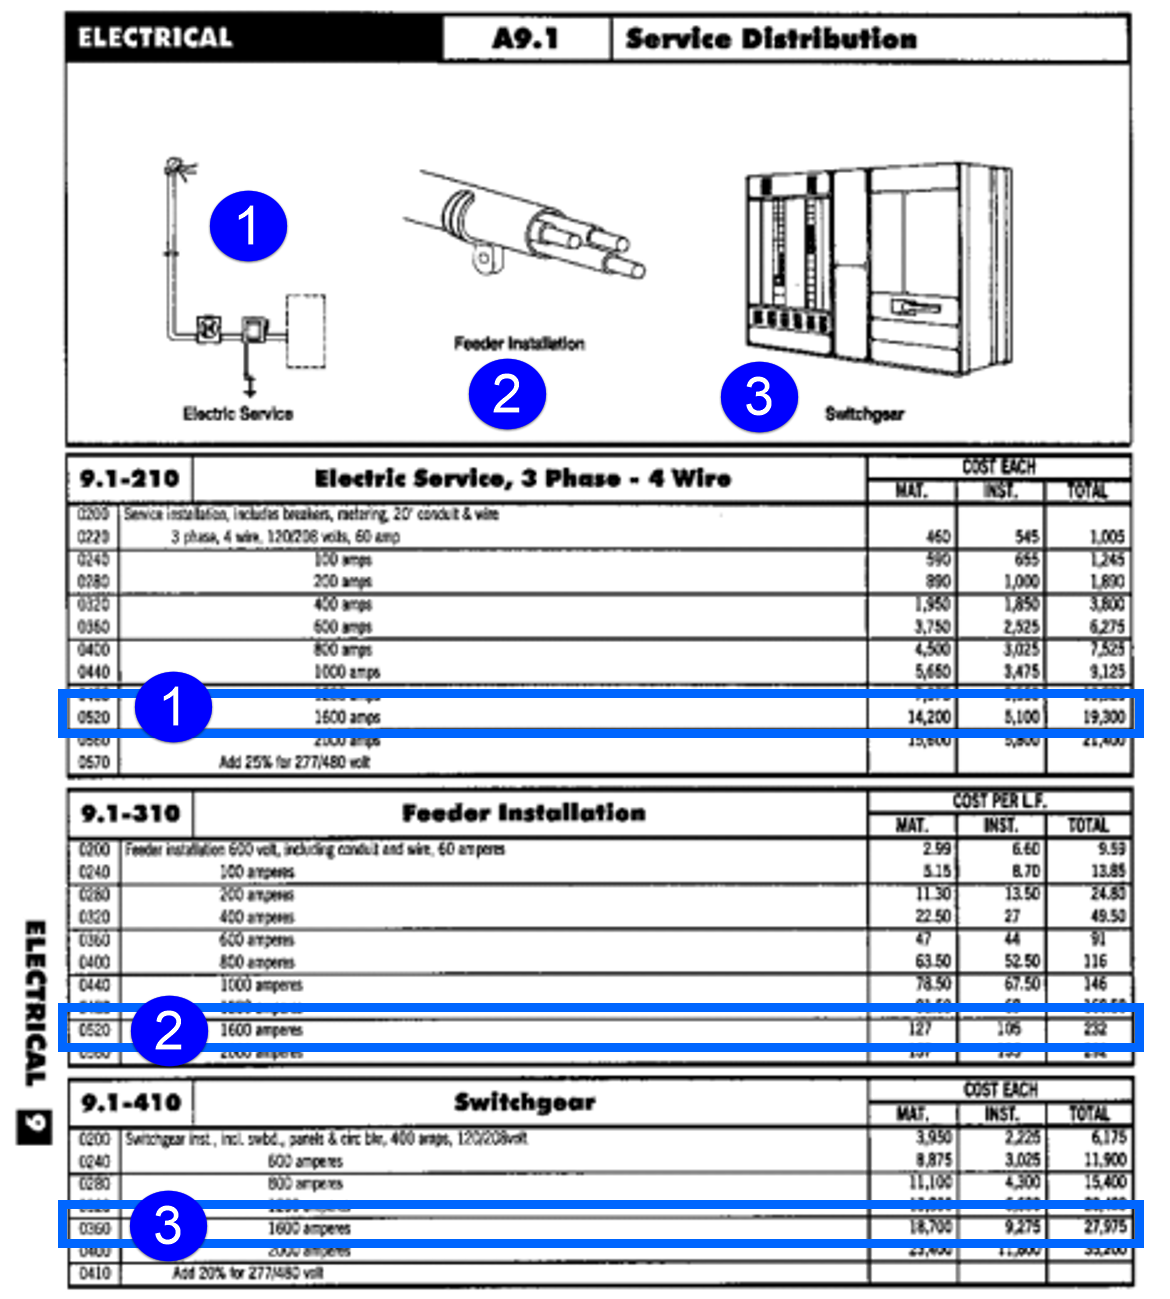
Figure 13 - Assembly Method of Cost Estimating
Source: R.S. Means 2008 Facility Cost Estimating Database Assembly Method Example
In Figure 13 above, we can see that a SERVICE DISTRIBUTION ASSEMBLY consists of 3 elements or components:
(1) Incoming Electric Service from the nearest power pole to the structure. This includes the conduit riser, the power consumption meter and 20’ (7 meters) of cable and the grounding/earthing rod. Using a 1600 amp service distribution assembly as an example, this portion of the assembly would be COSTED at $19,300.
(2) Install the Feeder Cable includes the labour and materials to install the cable from the riser to the meter, connect to the meter, install the grounding/earthing rod with connections and install the cable from the power meter to the switch gear and make the terminations. Again the COSTS for this component for a 1600 amp service is $232.
(3) Install the Switch gear which includes setting the switch gear, installing the circuit breakers and making the final terminations. Lastly, the COSTS for this component for a 1600 amp service is $29,975.

Adding everything up, for a 1600 amp services, we would have:
1) $ 19,300
2) $ 232
3) $ 29,975
Total $ 49,597 COST
Add 30% OH&P $ 15,852 Contractors GROSS OH&P
Total $ 64,450 Contractors SELLING PRICE (fair market value)
As the graphic to the right (Figure 14 - Modular Benefits , Source: Giammalvo, Paul D (2015) Course Materials. Contributed Under Creative Commons License BY v 4.0) shows us, here are additional examples where modularization using skid or platform mounted pieces of equipment can be fabricated and tested in the factory or fabrication yard, then shipped directly to the site ready for installation. This “plug and play” approach saves time and money as all that needs to be done is to connect the various components to match specific field conditions. Thus using assembly cost estimating can be used either by the owner or the contractor as an accurate, reliable and precise cost estimating method.
For Level 3 assessment, we are using the same tools/techniques used in Level 1 and Level 2, only applied at a much greater level of detail. (“Granularity”)
08.4.3.11 Owner Baseline, Owner Estimate, Bid or Tender Estimate- (GPC Level 4 Cost Estimate)
Once the project is funded, the owner puts the project documents (See Module 5- Managing Contracts) out for bid or opens negotiations with one or more contractors. The owner then compares the incoming bids against their “Owner’s Estimate” and if the bids are within reason, the owner awards the contract to the lowest responsive bidder. If all the bids are too high, then the owner will often go back to Phase 2 or Phase 3 and resubmit the project to the process all over again or the owner can simply go back and ask for more money. In the event the contract is being done using one of the “Cost Plus”, “Cost Reimbursable” or “Time and Material” (T&M) types of contracts, then the owner and contractor often collaborate, working together to develop a cost estimate which falls within the +15% to -5% range of likely project cost outcomes. However, while owner’s generally are willing to are willing to accept a wider range of accuracy, reliability and precision in cost estimates for these types of contracts, the Guild recommendation that as professional cost estimators and project controllers, that we strive for the +5% to -5% above or below the mean, expected or P50 value.
For this level of cost estimate, owner’s cost estimators normally only refine and “tweak” the costs using the same tools and techniques described above. Only in rare cases do owner’s cost estimators perform the detailed “bottom up” cost estimates which contractors must do in order to win bids AND still be able to make a profit commensurate with the risks assumed. However, for any “mission critical” work such as shut downs or turn arounds done by the owner’s own in house maintenance teams or for any other work such as testing and commissioning, where there needs to be detailed interfaces between the owner’s operations staff and contractors tradespeople, it would not be unthinkable to provide this level of cost estimate.
08.4.4 OUTPUTS
“Fit For Purpose” Owners Cost Estimate
- Appropriate To The Relevant Phase Gate Review
- Accurate With The Acceptable Ranges
08.4.5 REFERENCES & TEMPLATES
- The US Government Accountability Office (GAO) “Cost Estimating And Assessment Guide- Best Practices For Developing And Managing Capital Program Costs” (2009) GAO-09-3SP Http://Www.Gao.Gov/New.Items/D093sp.Pdf
- US Dept Of Energy (Doe) “DOE G 413.3-21, Cost Estimating Guide” Https://Www.Directives.Doe.Gov/Directives-Documents/400-Series/0413.3-Eguide-21/View
- Gary Cokins And The Institute Of Management Accounts (2006) “Implementing Activity Based Costing” Http://Www.Garycokins.Com/Images/Pdfs/Cokins%20IMA%20SMA%20Implementing%20ABC.Pdf
- United States Department Of The Interior National Park Service Class A Construction Cost Estimate BASIS OF ESTIMATE- Http://Www.Nps.Gov/Dscw/Upload/Classaconstcostestimatesample_1-26-11.Pdf )
08.5 - Module 08-5 - Define The Estimates Purpose And Interpret The Scope Of Work (Contractor)
08.6 - Module 08-6 - Developing Contractors Cost Estimate (Bottom Up)
08.7 - Module 08-7 - Validate The Time & Cost Trade-Offs
08.8 - Module 08-8 - Validating Horizontal And Vertical Integration
08.9 - Module 08-9 - Conducting A Cost Risk Analysis
08.10 - Module 08-10 - Baselining And Communicating The Cost Estimate/Cost Budget
Revisions & Change Control:
Rev 1.02 (03 July 2018)
- Amendments to the three sections following "08.4.3.7 Level 1 Cost Estimate" to show "08.4.3.7.1 Capacity Factored Method" and "08.4.3.7.2 Parametric Modelling or Parametric Estimate" and "08.4.3.7.3 Analogy or Cost Estimate Relationship (CER) or Cost Estimating Model (CEM)" as the three cost estimate tools for ascertaining the initial business case.
- Ammendments to "08.4.3.8 Expert Opinion Technique" to more clearly show the five the common tools/techniques which need cost range estimates at the appropriate level as inputs, i.e. 08.4.3.8.1 to 08.4.3.8.5 inclusive.
- The above two changes are simply a renumbering exercise and concept and content have not changed.
Rev 1.01 (24 Aug 2017)
- Minor typographic and grammar amendments. No material change to concepts or content.
GPCCAR M08-4, Revision 1.02