9.0 - MANAGING PROJECT PROGRESS
09.1 - Module 09-1 - Introduction to Managing Project Progress
09.2 - Module 09-2 - Developing the Managing Project Progress Policies & Procedures Manual
09.3 - MODULE 09-3 - CAPTURING PROGRESS & UPDATING THE SCHEDULE
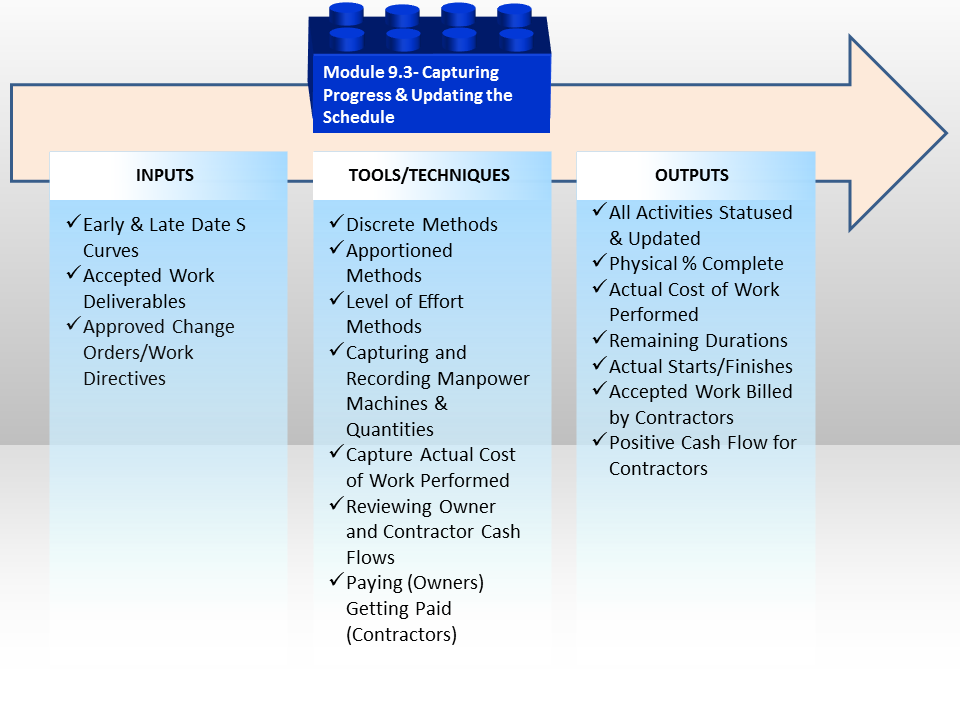
Figure 1 - Capturing Progress and Updating the Schedule
Source: Guild of Project Controls
09.3.1 INTRODUCTION
The aim here is to UPDATE the CPM schedule to show (1) what has been achieved and (2) when it has been achieved
For each activity in the CPM schedule the information to be captured is as follows:
- Actual Start (AS)- when the activity actually started
- Actual Finish (AF)- when the activity actually finished
- Remaining Duration (RD)- the expected remaining duration for activities which have started but not yet finished
- Physical % Complete (PC)- how "complete" the work activity is
It is generally agreed that regardless of the software used, there are 8 steps normally and customarily used to update, progress or status a CPM schedule. That process is described as follows:
- Establish a standard update procedure that includes which method you will use to record progress (See Module 07-2 - Develop the Planning & Scheduling Policies & Procedures Manual)
- Create a baseline plan
- Record progress on activities automatically or manually
- Apply project Actuals - (Start Date, Finish Date, Percent Complete, Remaining Duration, Actual Costs and any necessary new schedule activities)
- Calculate the schedule (and level resources if required)
- Compare the current schedule to the baseline plan and identify variances
- Analyze data through layout graphics, dashboards and reports
- Make adjustments and communicate the schedule update
Source: Oracle Primavera® P6™ Project Management Reference Manual pages 262-263
In regard to the above this module demonstrates the Tools & Techniques available with respect to how to:
- 09.3.3.1 Measure Physical Progress
- 09.3.3.2 Capturing & Communicating Physical Progress
- 09.3.3.3 Capture Actual Cost of Work Performed
- 09.3.3.4 Status and Update the Schedule with Progress
As these steps are normally done by the CONTRACTOR reporting to the OWNER, or if the project is an internal one (not outsourced to a contractor) then this is the first stage in the updating process.
In this module, we will cover one of the more challenging aspects of applied earned value management and other progress measurement tools & techniques which includes how to capture and record physical progress in as close to real time as possible. If we are unable to accurately measure and validate what percentage of work has physically been accomplished, then the basis for our analysis becomes faulty - i.e. "GIGO" or Garbage In/Garbage Out and assuming that our original baseline estimate was correct the second biggest challenge is how to capture and report physical progress.
As the tools and techniques required to create the initial baseline schedule are exactly the same that we need to invoke whenever doing a schedule update, before starting this section you would be wise to review these modules:
- Module 07-7 - Calculating Float and the Critical Path
- Module 07-8 - Validate The Critical Path & Completion Dates
- Module 07-9 - Validate Horizontal and Vertical Integration
- Module 07-10 - Conducting a Schedule Risk Analysis
- Module 07-11 - Baselining and Communicating the Schedule
09.3.2 INPUTS
- Early And Late Date S Curves (the Performance Measurement Baseline)
- Accepted Work Deliverables (See Criteria For “Acceptance” and Module 3.5 - Accepting Completed Deliverables and Module 05-5 - Managing the Contract (Owner & Contractor))
- Approved Change Orders
- Work Directives / Instructions
09.3.3 TOOLS & TECHNIQUES
As with all the tools and techniques shown below, there are simply too many variables to tell you which tool should be used in any given circumstance.
It is up to you as a practitioner to KNOW and UNDERSTAND how to use each of these tools and techniques and in the event you are unsure which one is “better” or “best” in any given circumstance it is up to you to seek out advice from your supervisor or mentor.
09.3.3.1 MEASURE PHYSICAL PROGRESS
It is generally accepted that there are 3 generic categories of determining or measuring Physical % Complete and within those three categories are a total of 11 methods, ranked roughly in the order of preference:
(1) Discrete Effort
- Units Completed or Units in Place Method
- Incremental Milestone Method
- 0/100 Method
- 50/50 Method
- 10/90 Method
- Weighted or Equivalent Units Method
- Professional Judgement/Expert Opinion
(2) Apportioned Effort
- Cost Ratio Method
- Hours Ratio Method
(3) Level of Effort
- Quantity Adjusted Budgets
- Man Hour Adjusted Budget
The rank ordering above provides a general guideline as to which methods are considered to be “best” or “preferable” meaning whenever possible, the project control practitioner should try to apply one of the discrete effort methods first, then if that doesn’t work, then go to the apportioned effort method and lastly, if all else fails, use the level of effort method. It is important to recognize is that on any given project, it is highly likely that all of these methods will be applied, depending on the exact nature of the activity or work package.
- Explained another way, there is no “rule of thumb” that says we have to choose one method and one method only for any given project. The project control practitioner is free to choose the one which is most appropriate for any activity or work package, provided it can be rationally justified as being the “best” or “most accurate” or “most appropriate” way to measure and validate Physical % Complete.
Another important concept to re-introduce here is that in order for the CONTRACTOR to be able to CLAIM physical percent complete, the work must meet three criteria:
- It MUST BE PHYSICALL IN PLACE. Under earned value, the contractor cannot bill for work not physically done.
- The work must be in SUBSTANTIAL CONFORMANCE to the technical specifications.
- The contractor has to prove that he/she has fulfilled the CONTRACTUAL TERMS and CONDITIONS.
09.3.3.1.1 Discrete Effort Methods
09.3.3.1.1.1 Units Completed or Units in Place Method
This is the most common and the preferred method whenever possible.
Example 1 - There are 10,000 linear meters of 12” pipe to be installed. The contractor has installed 4,000 meters, had the welds x-rayed and the pipe has been tested per the contract requirements. Therefore we can say that 4,000 LM / 10,000 LM = 40% physically completed.
Example 2 - There are 500 cubic meters of concrete foundations to be formed, poured, cured and stripped. The contractor has placed 250 CM and has submitted the necessary tests, all of which passed. The Contractor can therefore claim 250 / 500 or 50% physically complete on this task or work package.
09.3.3.1.1.2 Incremental Milestone Method
This is commonly used on equipment installations such as pumps, compressors, switch gear and the like where the process is standardized and the only variability lies with the size and / or complexity of the end to end process. This is also often used in repetitive elemets of the work which do not lend themselves well to the above method. One other example might be for design works - design preparation, submittion, approval etc.
Example - This is typical for a PUMP Installation
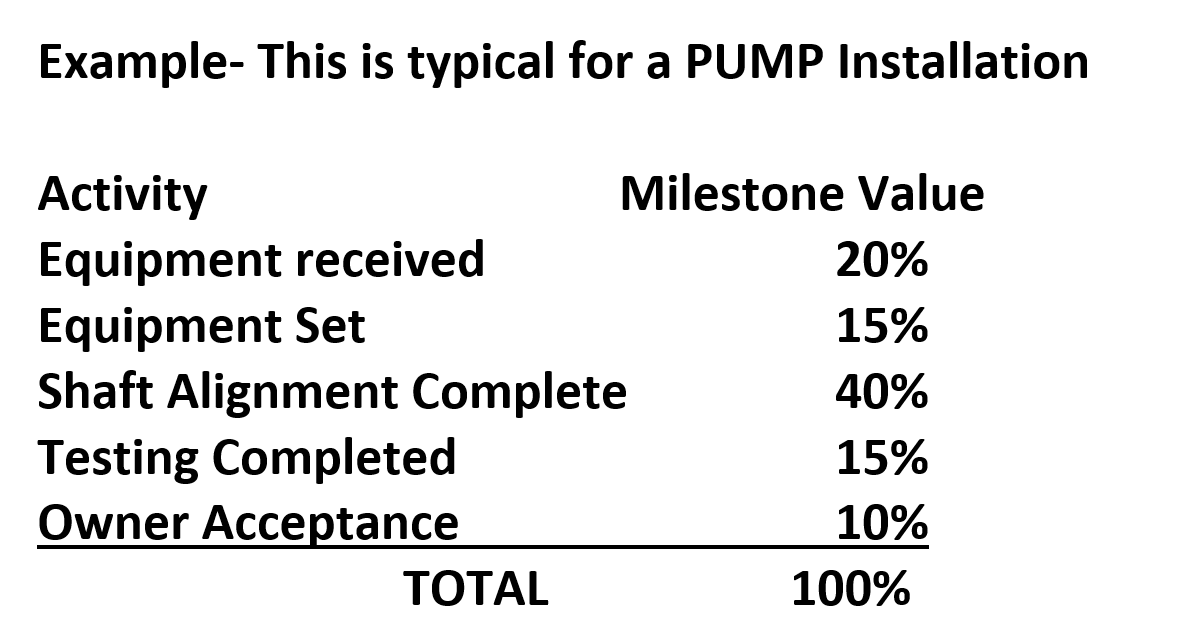
Figure 2 - Incremental Milestone Method
Source: Adapted from the Skills and Knowledge of Cost Engineers, 5th Edition, Chapter 14
When we move to Building Information Modelling, (BIM) this is the type of information which will be provided by the equipment vendors that will come EMBEDDED in each object, so that these “rules” to determine “earned value” will not be something we as project control practitioner need to do research on as we do now, but will be included in the object’s database.
09.3.3.1.1.3 The 0 / 100 Method
This method is commonly used for consumable materials such as concrete, sand, timber or reinforcing steel. The materials are delivered to the site and an appropriate authority validates the delivery.
It can also be used for short duration professional services, such as delivering and installing a photocopy machine. The machine is delivered, installed, tested and training provided in the operation, which only takes 1 day and the vendor submits a bill for the machine, installation and the support services.
09.3.3.1.1.4 The 50 / 50 Method
This is similar to the 0 / 100 method above but this time, the vendor or sub-contractor receives 50% upon the start of the activity and the final 50% upon completion of the activity.
This is commonly done for training or other professional services, such as legal or accounting, where a retainer is paid prior to the start of the services but the final billing cannot be made until the services are complete.
09.3.3.1.1.5 The 10 / 90 Method
Like the 0 / 100 and 50 / 50 method, the vendor or sub-contractor receives an advanced payment of 10% and the final billing of 90% due upon completion of the activity or work package.
Important to remember that this 10% should represent some measurable value to the owner - i.e. 10% deposit ensures a place in the equipment fabrication production queue. The whole concept of “quantum meruit” means that there had to be some value actually obtained and not simply as an advance payment.
09.3.3.1.1.6 The Weighted or Equivalent Units Method
This is an excellent method to use where the process itself is standardized, but consists of activities with different units of measure BUT has a common denominator we can use. The classic example is pre-engineered steel buildings, often used for warehouses and storage or workshops.
Example -
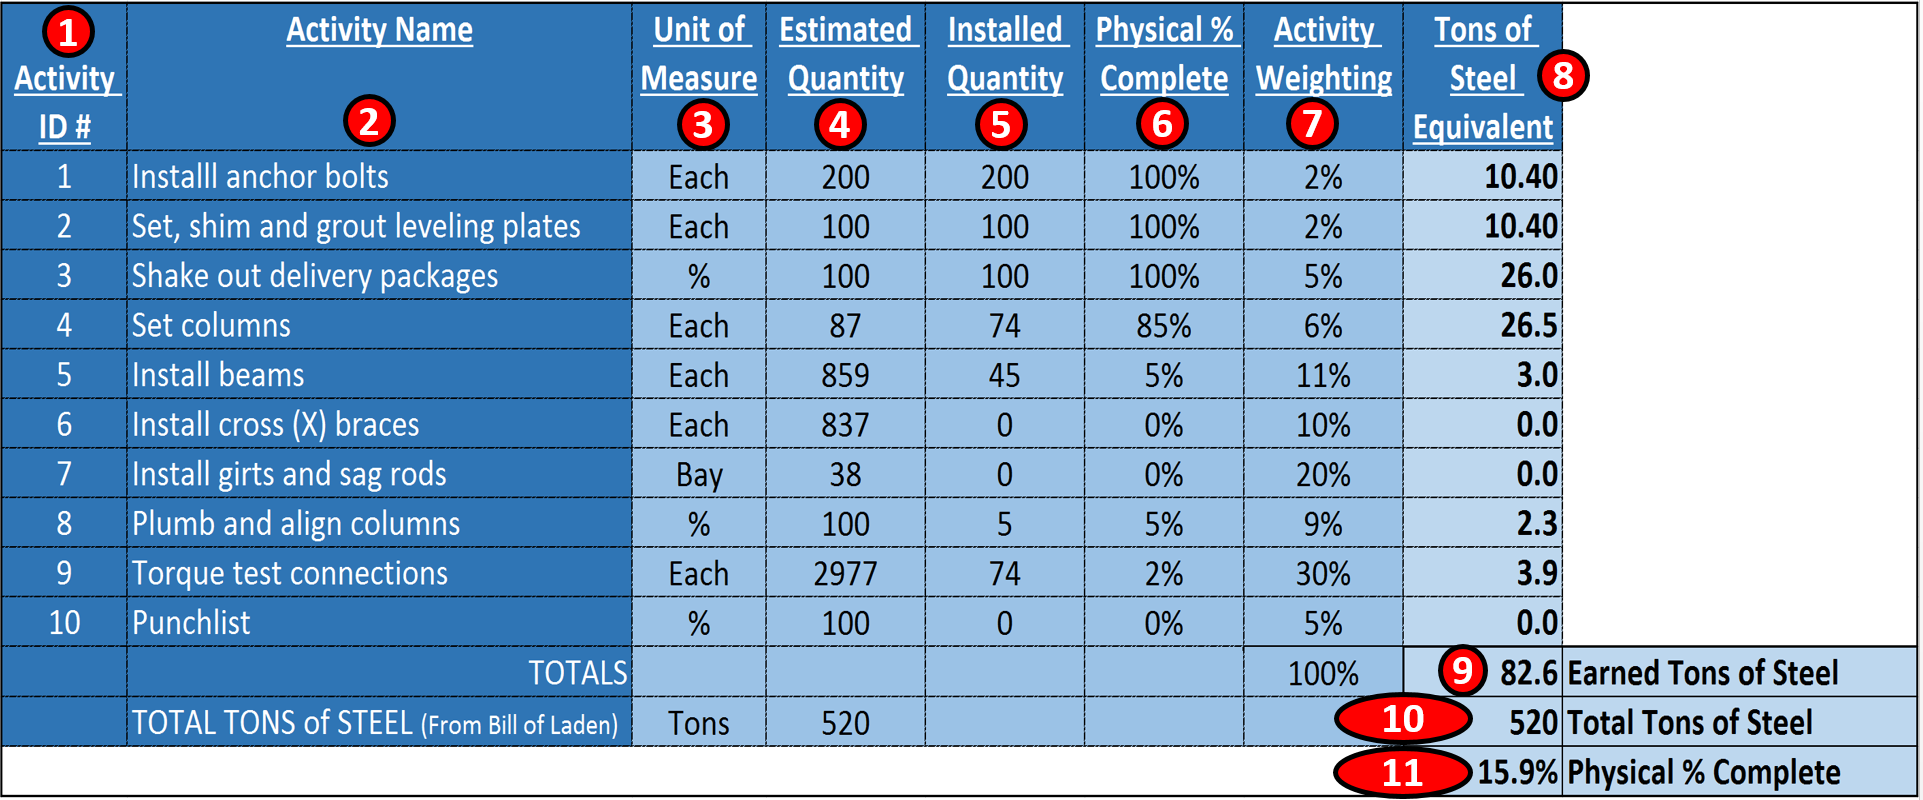
Figure 3 - Showing the Weighted Equivalent Method for Pre-Engineered Steel Buildings
Source: Adapted from the Skills and Knowledge of Cost Engineers, 5th Edition, Chapter 14
In the example above, we know that there are 10 standard activities required for any pre-engineered steel building regardless of size (i.e. item 2)
We also can tell from the shipping invoices and bills of laden exactly how many tons of steel go into this structure, which in this case is 520 tons of steel (i.e. item 10)
Because the 10 activities each have a different unit of measure (refer item 3) and because many of the activities are being done simultaneously rather than in sequence, it is not practical to try to determine the overall physical % complete just looking at each activity. So what the building manufacturers, the steel building contractors and owners associations have done is to agree what the relative weighting of each activity should be (refer column 7). Then to convert each activity into tons of steel, we multiply Column 6 (Physical % Complete for each activity) X Column 7 (the relative weight factor for that activity) X 520 total tons of steel and that yields the Equivalent Tons of Steel per Activity (Column 8).
Then we add up the total Tons of Steel Equivalent in place (i.e. the item 9 total), which is 82.6 earned tons of steel, and divide it by the total tons of steel (520) (from item 10) and we can see we are 15.9% complete (i.e. item 11).
This is a very quick and easy to apply to any on-going process which requires the same set of activities (i.e. a fragnet) and for which there is a common unit of measure. (i.e. tons of steel, square meters of surface area (road work or runways) or cubic meters of trenching (pipelines).
09.3.3.1.1.7 The Professional Judgement or Expert Opinion Method
Of the Discrete methods, this is the LEAST desirable as it is not only subjective but is prone to corrupt and collusive practices by either or both owner project managers and contractor project managers. Can it be used? Yes, of course but only as a last resort and certainly not for any complex or important work package or activities.
09.3.3.1.2 Apportioned Effort Methods
09.3.3.1.2.1 The Cost Ratio Method
This method takes the total budgeted cost of the work package or activity and divides it by the total project value to come up with a percentage value.
Example - The project manager’s salary is $100,000 per year. She spends 50% of her time on this project. The project is a $1,000,000 project. $50,000/$1,000,000 = 5%. When the project is 20% complete, the project managers physical % complete would be 20% X 5% = 1%.
09.3.3.1.2.2 The Hours Ratio Method
This is the same method described above, but instead of using money, we use hours instead.
Example - The project manager works 2,000 hours per year. 50% of her time is chargeable against the project. 50% X 2,000 hours = 1,000 hours chargeable to the project. The project has a person hour budget of 20,000 hours. 1,000/20,000 = 5%. If the project was 20% complete, the physical % complete of the project managers hours would be 20% X 5% = 1%.
The dangers of using both these methods is it assumes that the budget in terms of money or hours is fixed and will not change. Using this method, if there are any changes or if any of the budgets are proven to be either too high or too low, it will throw off the calculations, resulting in the physical percent completed changing (usually going lower) from one report period to the next.
09.3.3.1.3 The Level of Effort Method
Of all the methods which are the least desirable, using the Level of Effort method is perhaps the worst.
The underlying philosophy of this method is that “it takes whatever it takes to get the job done”, meaning time or monetary budgets become meaningless. Often project management and other support services (i.e. QA/QC, Safety and Training etc) are charged against the project this way. The risk being, that without an approved budget in place, these items can quickly spiral out of control.
However, this approach is commonly used for cost plus or cost reimbursable contracts OR when using “Indefinite Time/Indefinite Quantity” (IT/IQ) contracts otherwise known as “Job Order Contracting” (JOC) or “SABER”. Using this approach, the unit prices are usually (but not always) fixed and it is the quantities in place vs the estimate that are the variable. Under these circumstances, the physical % complete is not the determining factor but the VARIABLE in the equation. Explained another way, when using quantity adjusted budgets as the quantities change (+/-), the physical percent complete goes up or down. This approach can be applied to either quantities of materials or to the allocated or estimated man-hours to complete the work packages or activities.
For example we have 6 Activities with the original (baseline) estimates of 3,354,000 man hour’s total (i.e. item 3)
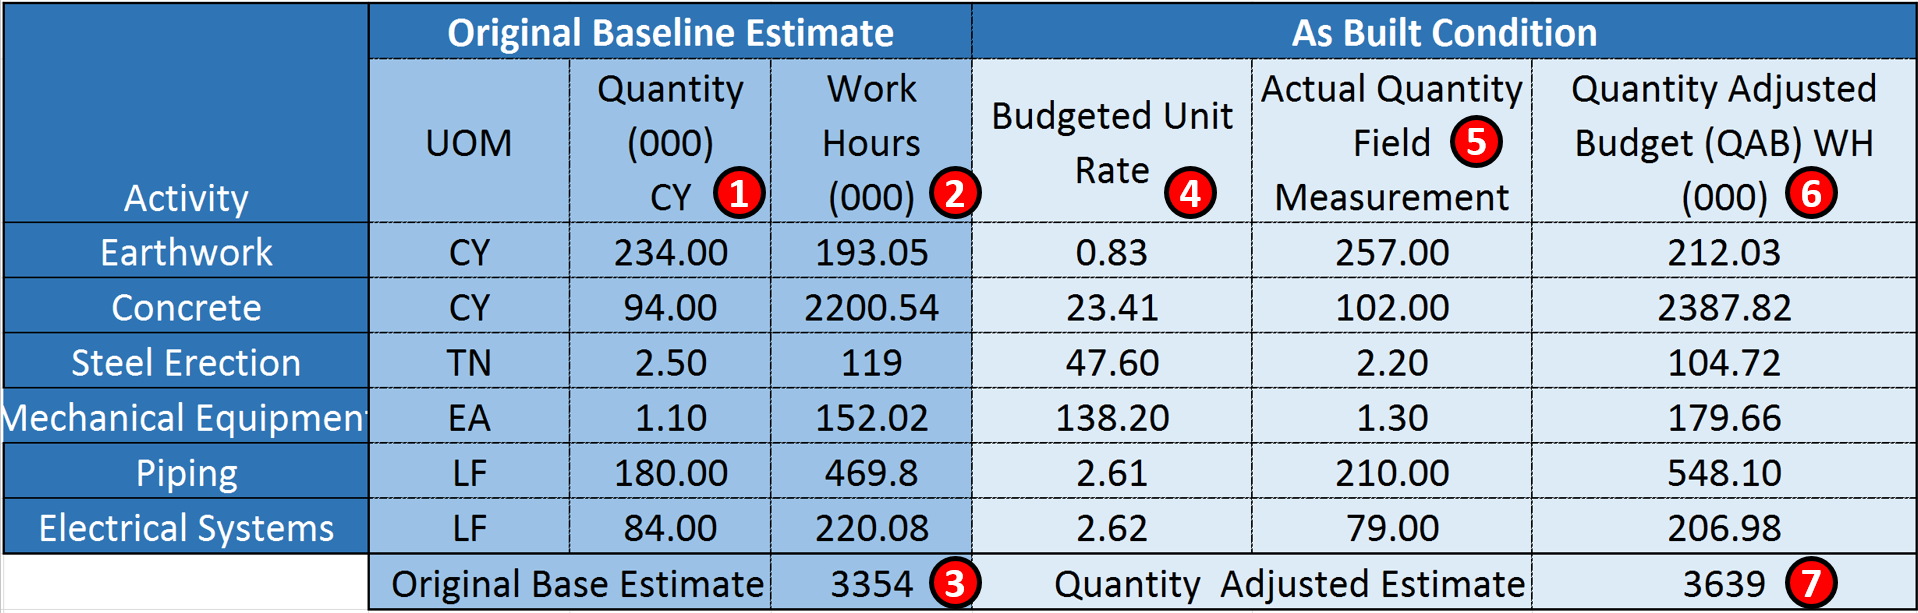
Figure 4 - Quantity Adjusted Baseline Using Man Hours instead of Money
Source: Adapted from the Skills and Knowledge of Cost Engineers, 5th Edition, Chapter 14
- In Column 1 we can see that the original estimate for each work package was created.
- Column 2 shows us the original man-hour estimate for the quantities in Column 1
- The sum of Colum 2 gives us the total budgeted man hours for this project
- In Column 4 we can see how many man hours per unit in place cubic yard the original estimate wasbased upon. (Column 2/Column 1 = Column 4 values)
- We then went to the field and measured what was actually installed,(5) the field measurements for each activity showed us that the original estimate was incorrect- that some quantities were over-estimated while others were under estimated.
- Using the original budget man-hours per unit in place, we come up with a Quantity Adjusted Budget for each activity.
- Lastly, when we add up the total man hours based on the original unit productivity rates, we get a total of 3,639,000 man hours, which is a legitimate increase of about 8.5% over the original base number of 3,354,000 man-hours.
This method is often used in claims but is also a commonly used progress measurement tool when the quantities are unknown or unreliable for whatever reasons. In later modules we will demonstrate how to use this method to predict future completion dates and/or costs (See IEAC5).
09.3.3.2 CAPTURING & COMMUNICATING PHYSICAL PROGRESS
09.3.3.2.1 Capturing & Communicating Information
Once we have determined the method we are going to use to measure physical % complete the next challenge is how to get this information from the site to the office in real time. And remember, when we mean “real time” we ideally mean <24 hours from the time the work has been done. Why? Because if we expect management to be able to make sound decisions we cannot be providing “out of date” physical progress. The standard “best tested and proven practice” is that management should be able to make decisions on actual progress which is no more than 24 hours old. Anything more than that may well render their decisions invalid or worse yet, counter-productive. On many projects this "ideal" is never achieved but in all cases practitioners should strive to implement systems which provide progress information as soon as is practicably possible.
With the proliferation of mobile devices, the preferred method of providing status reports is using either photographic or videos. A real life example comes to us from an underground mining operation where they have “projectized” on-going operations and are able to generate a progress report using Earned Value within 3 hours after the end of each shift, 3 times a day, 7 days a week and 365 days per year. This has resulted in DOCUMENTED savings of 65 million USD over a 4 year period.
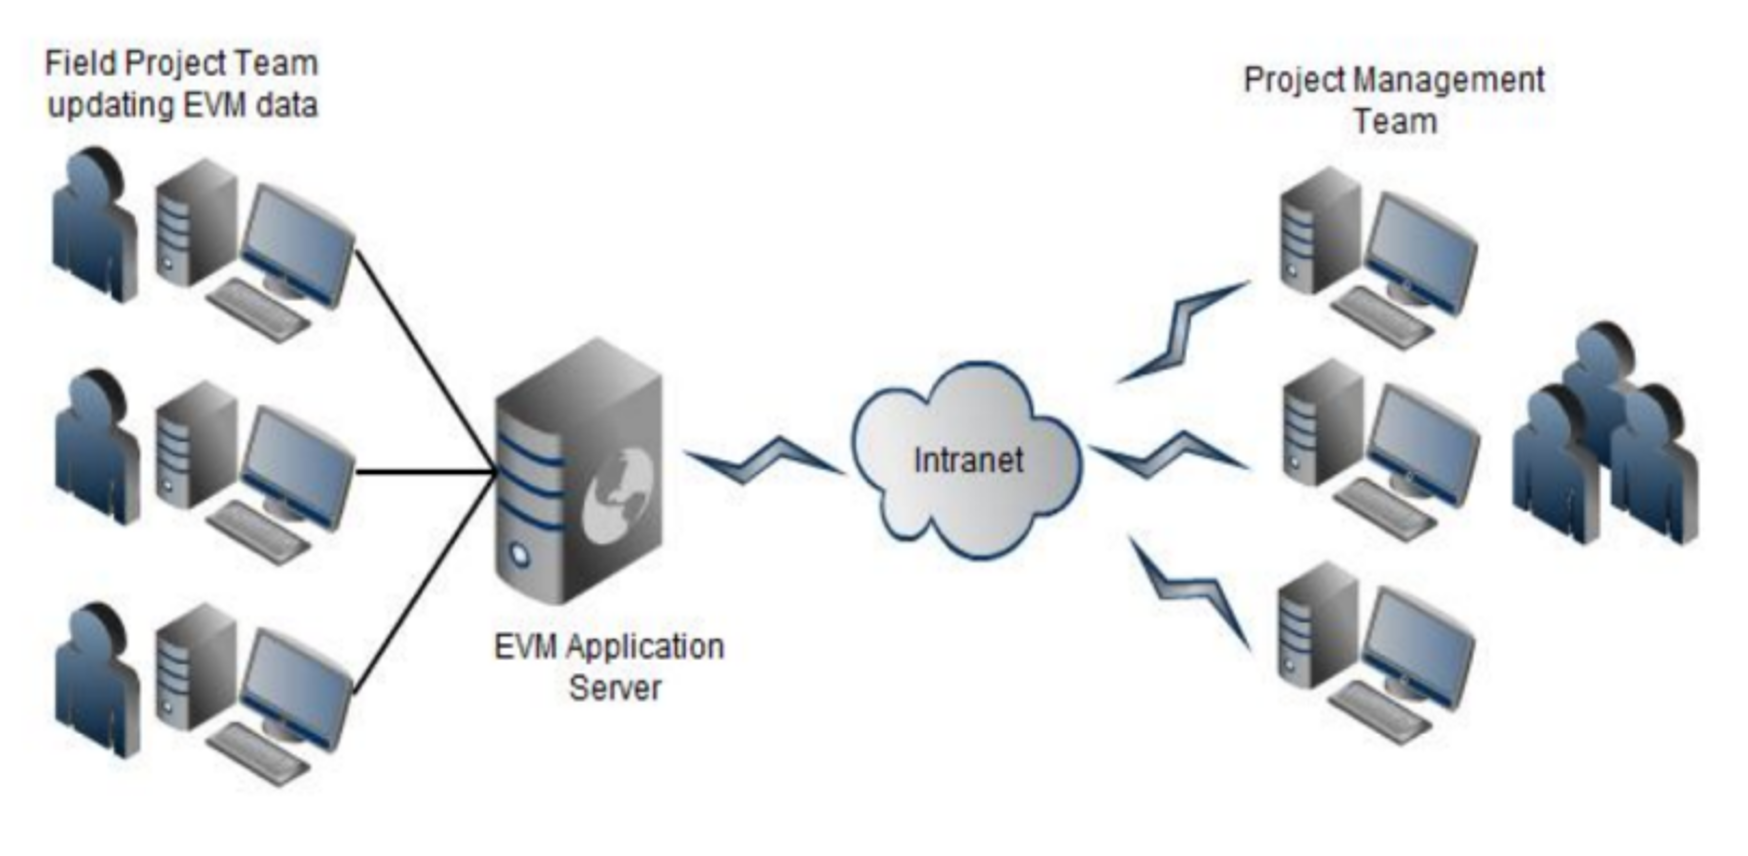
Figure 5 - Example showing how mobile technology was used to Capture field Progress
Source: Wibiksana, Ridwan (2012) PM World Journal EVM Adapted for Underground Mining Operations Vol. I, Issue II – September 2012
In Figure 5 above, we can see how using mobile technology the field foremen are able to take a few minutes at the end of each shift and using a simple Excel spreadsheet are able to communicate from 2+ kilometers underground to the main site office what their productivity was for each shift.
Because we do NOT want the field people filling in paperwork (they have enough to do already simply to execute their work safely) project control practitioners need to make the process of collecting data from the field as simple and painless as it possibly can be. This includes providing the activity name and coding structure(s) so that the field does not have to fill in anything but actual progress.
In today’s world we are increasingly getting away from paper based reports and moving towards electronic reporting using mobile devices. (i,e, iPhones, iPads etc). Refer Figure 6 below:
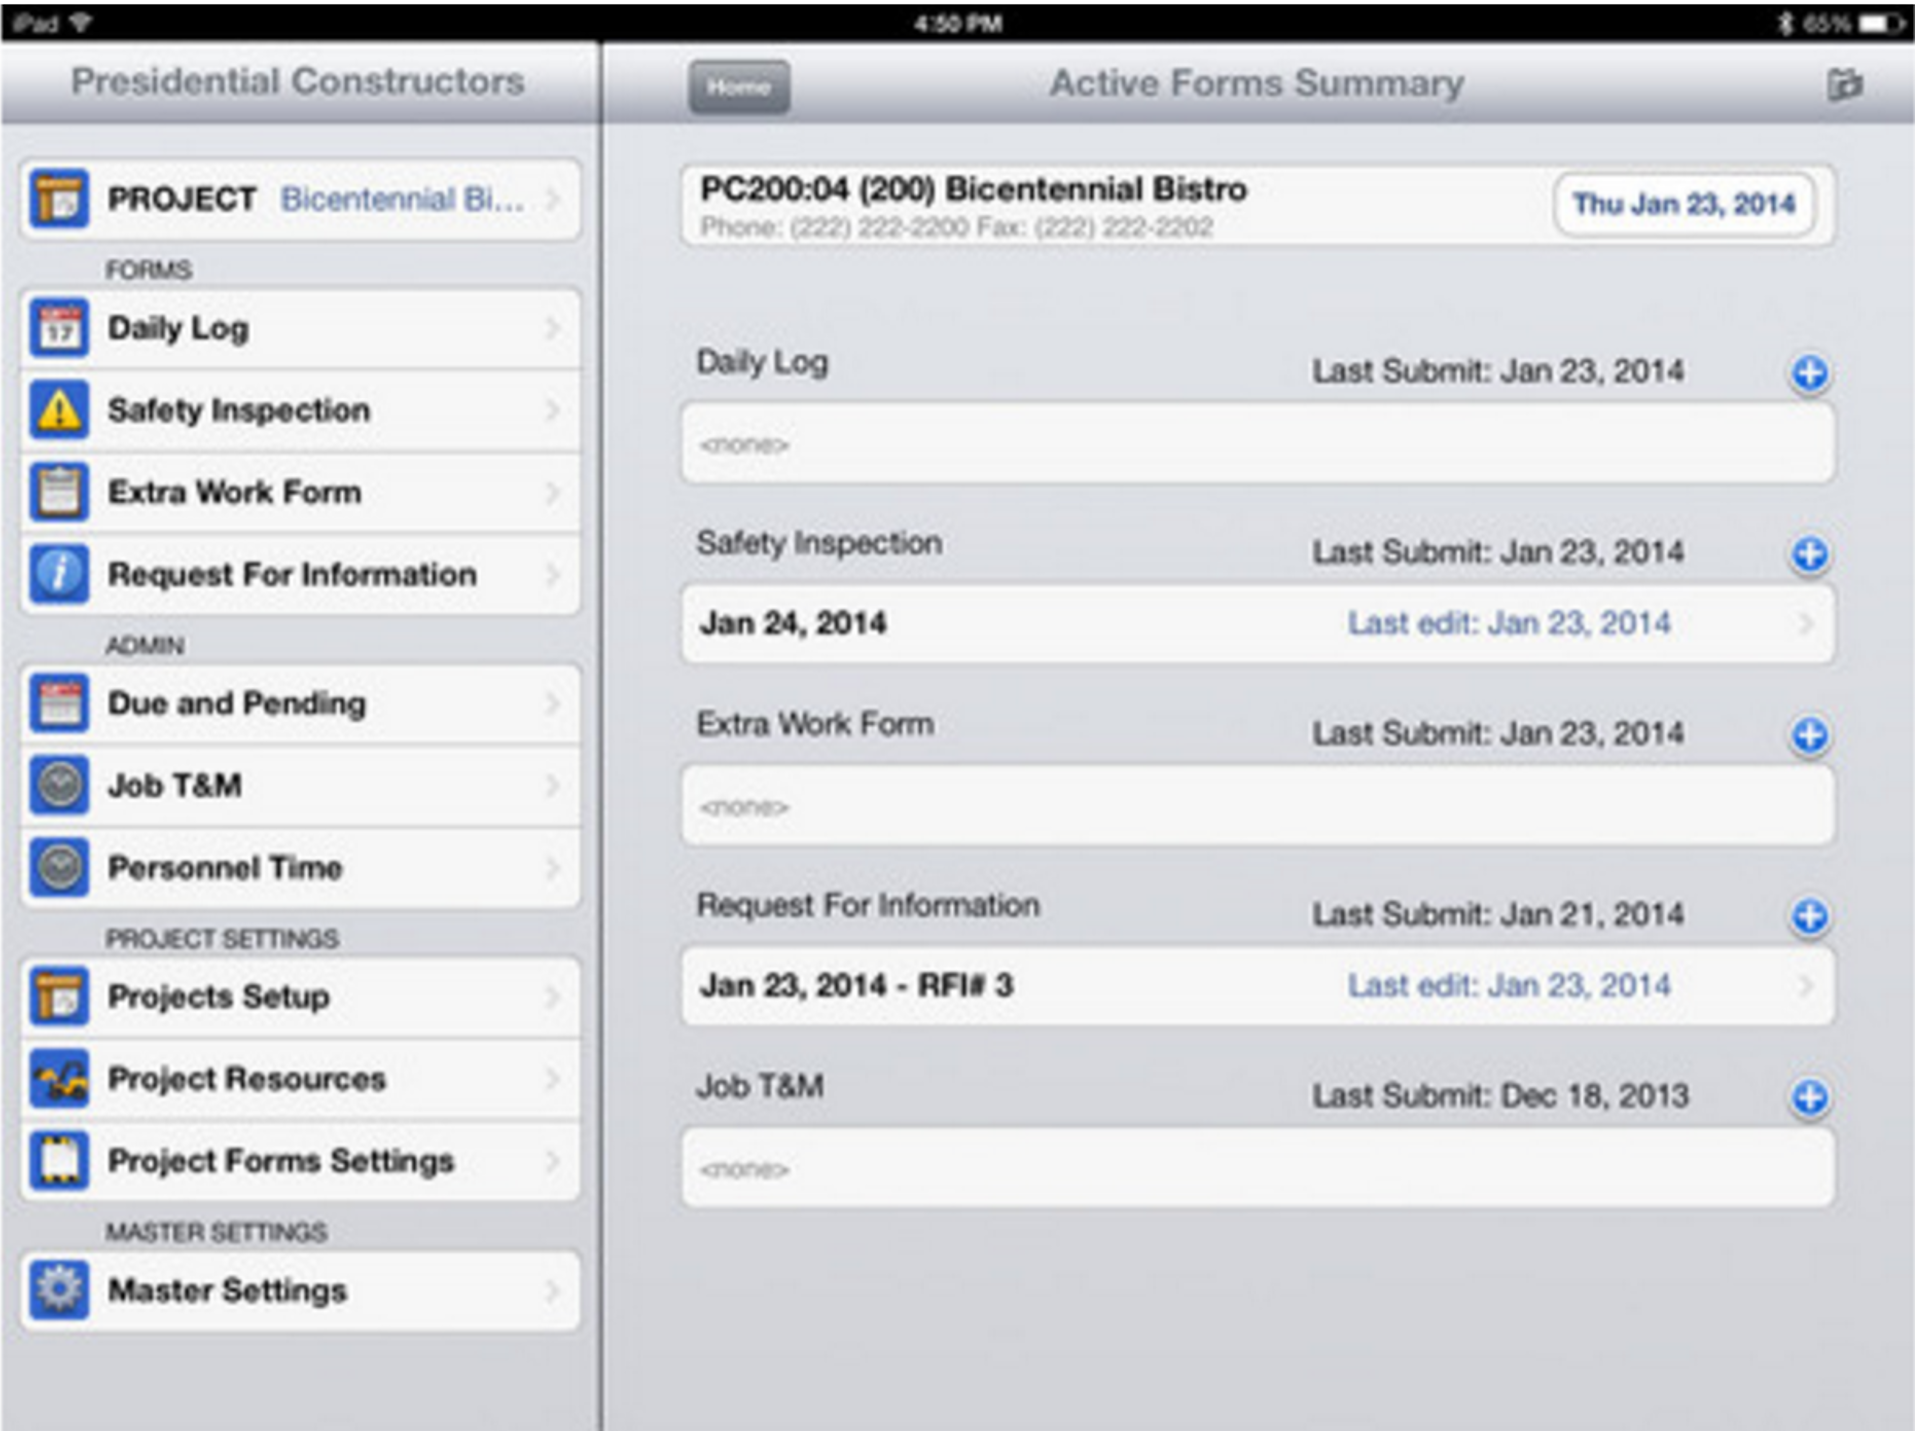
Figure 6 - Electronic Reporting
Source: For Construction Pros
This is highly likely to become the future project management and project controls. Given the proliferation of these applications, below are additional resources for those who are interested in using existing apps or in creating new ones specifically designed for project controls:
- http://online-project-management-review.toptenreviews.com
- http://www.creativebloq.com/software/best-project-management-71515632
- http://www.lifehack.org/articles/productivity/5-awesome-project-management-tools-to-get-your-team-on-track.html
- https://blog.dapulse.com/45-project-management-tools-and-collaboration
- http://cdn.viewpointcs.com.s3.amazonaws.com/viewpoint/pdf/BPG_TL_US_Smart-Mobility_Feb15.pdf
09.3.3.2.2 Capturing Time Related Information (Actual Start / Finish & Forecast Dates)
Here is what a successful tested and proven progress data collection template should look like:
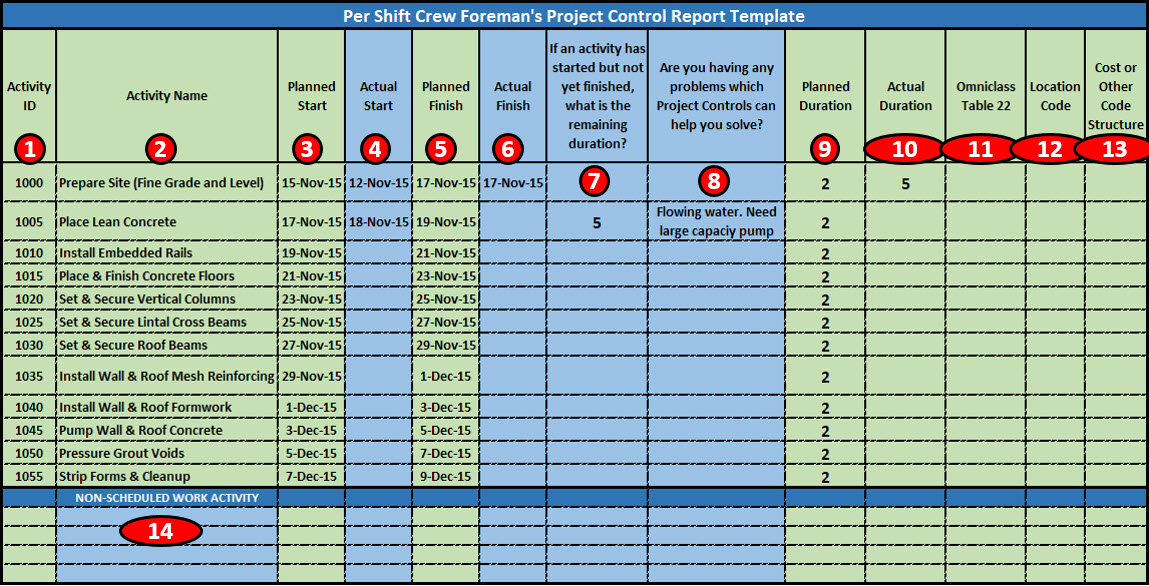
Figure 7 - Sample Field Data Collection Sheet
Souce: Wibiksana, Ridwan (2012) PM World Journal EVM Adapted for Underground Mining Operations Vol. I, Issue II – September 2012
The above example is typical of the Excel spreadsheet from the case study above that was sent out to each foreman’s mobile device at the start of each shift. It contains ONLY those activities he is scheduled to be working on in any given shift, which normally means only 3-4 activities for most foremen on most shifts. All the information in light green is provided to him by the project controls team:
- Activity ID- Notice that the Activity ID’s are very simple, with space to add in new activities. Because this is a frag net from an operation which repeats itself hundreds or even thousands of time, the location of where this work is being done is input by the project controls team in Column 12
- Activity Name- As this is a frag-net for a repetitive process,, the activity names do NOT change. What does change is the length (volume) and the location.
- Planned Start- Comes from the Integrated Master Schedule and is provided to the Foreman by Project Controls using an Excel template on his mobile device.
- Actual Start- Is filled in by the Foreman at the end of the shift. It is entered into the Excel spreadsheet template on his mobile device.
- Planned Finish- Comes from the Integrated Master Schedule and is provided to the Foreman by Project Controls using an Excel template on his mobile device.
- Actual Finish- Is filled in by the Foreman at the end of the shift. It is entered into the Excel spreadsheet template on his mobile device.
- Planned Duration- Comes from the Integrated Master Schedule and is provided to the Foreman by Project Controls using an Excel template on his mobile device.
- Column J- Actual Duration- Calculated after the fact by Project Controls and is used as inputs to the productivity database for each activity
- Columns 11-13 whatever standardized cost or WBS coding structure management wants
Because we want the field people focused on executing their work assignments safely and not filling in paperwork, and our promise to the field people should ideally be that filling in our forms would not take more than 5 minutes at the end of each shift, the only pieces of information we expect the field people to fill in are those items shown in light blue:
- Column 4- What activities did you ACTUALLY START during your shift?
- Column 6- What activities did you ACTUALLY FINISH during your shift
- Column 7- If you started an activity, how much longer do you think it will take to finish? (Remaining Duration)
- Column 8- What problems are you having that Project Controls can help you solve?
It is this last question which is what the field supervision really need and that is the “value added” service that project controls can provide. In exchange for each field foreman taking 5 minutes at the end of each shift to record and send data into the project controls office using his mobile device, the project controls team has agreed to follow up on any issues and make sure they are communicated to the appropriate manager or other decision maker. By building a relationship of mutual benefit to everyone, instead of project controls being perceived as a threat (“The Project Police”) we are seen as being a support service to help solve real problems in exchange for a few pieces of accurate and reliable information.
Lastly, we also ask that the foreman fills in the name of any additional activities (Column 14) not shown on the template provided to them. This gives the project control practitioner the opportunity to refine and update any fragnets or to help identify any outliers (Special Causes) when we run the statistical process control chart analysis on the data being collected before we update our productivity and cost databases. (For more on this, see Module 11 Managing Databases).
09.3.3.2.3 Capturing Productivity Related Information (Materials, People & Machines)
Following up on the case study shown above, consistent with the objective to minimize the field having to fill in paperwork, each area superintendent, who is normally responsible for between 3-5 work crews, is responsible to account for the Manpower, Materials and Equipment consumed or utilized by his crews on any given shift.
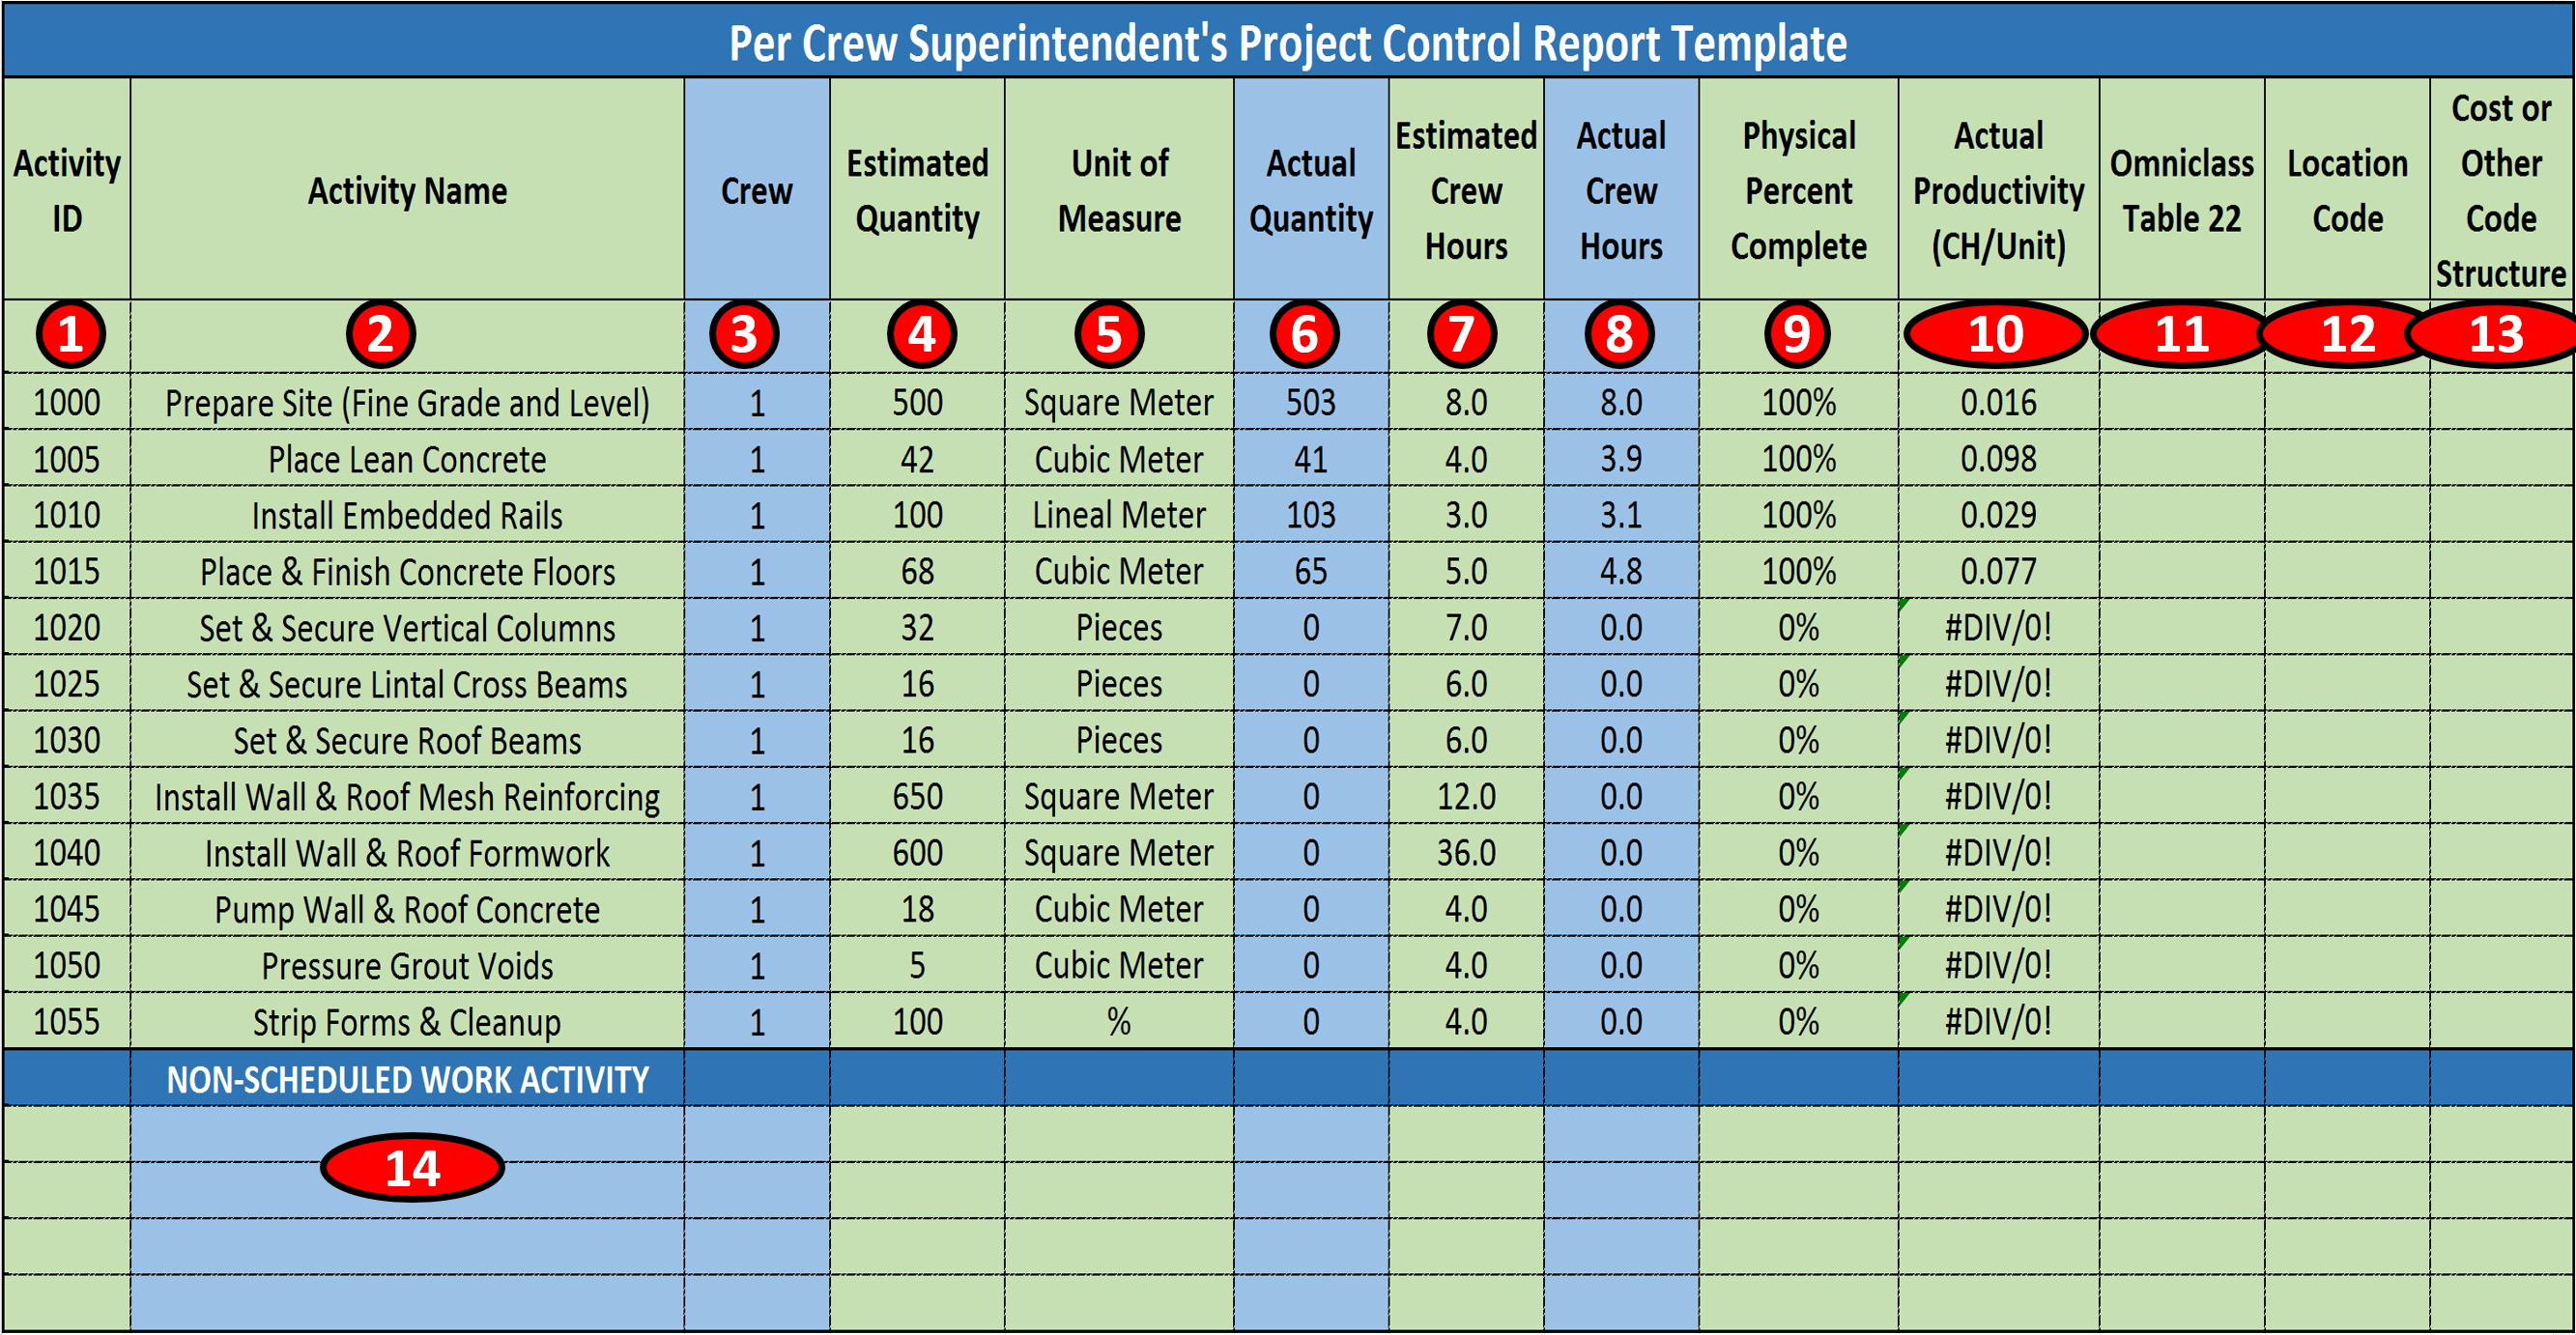
Figure 8 - Sample Field Units In Place Data Capture Template
Souce: Wibiksana, Ridwan (2012) PM World Journal EVM Adapted for Underground Mining Operations Vol. I, Issue II – Sep 2012
As the management did not want the field people being burdened with filling in paperwork, to as great an extent as possible as much information as possible was filled in by project controls and sent out to the area superintendents as an Excel file via their mobile devices.
- Activity ID- Notice that the Activity ID’s are very simple, with space to add in new activities. Because this is a frag net from an operation which repeats itself hundreds or even thousands of time, the location of where this work is being done is input by the project controls team in Column 12
- Activity Name- As this is a frag-net for a repetitive process,, the activity names do NOT change. What does change is the length (volume) and the location.
- Crew Number- As this was an underground mine and conditions changed, the Area Superintendents were empowered to assign crews to the various “projects”. This crew assignment was important to know as we were tracking not only Shift Earned Value but Crew Earned Value as well. For more on how this data was used, see Module 09.5.3.4 Dashboard Reports Figure 23
- Estimated Quantities- This data was provided to the project controls team from Engineering, with the note that even though the drawpoint construction was part of on-going operations, each section of drawpoint was treated as a stand-alone project and each drawpoint segment was between 10 to 30 meters long. This meant that even though the activities were identical, (a fragnet) the estimated quantities and the durations of each segment were uniquely different.
- Unit of Measure- Came from Engineering but it was intentionally kept as simple and easy to measure as possible, understanding that the easier it was for the field to report, the more likely the data coming from the field would be accurate and timely.
- Actual Quantity- Is measured and agreed to between the Area Superintendent and the Crew Foreman and sent to Project Controls using an Excel template on his mobile device.
- Estimated Crew Hours- This is calculated by Project Controls using the quantities estimated by Engineering and applying the appropriate mean values for that specific type of drawpoint.
- Actual Crew Hours- This is filled in by the Area Superintendent based on inputs from the Crew Foreman. It is randomly checked and validated by project controls by comparing the daily time sheets.
- Physical % Complete- This is calculated by Project Controls by dividing the actual quantity in place during any given shift/total quantity estimated.
- Actual Productivity- This value is also calculated by project controls by dividing the crew hours by the actual units in place, yielding crew hours per unit in place. This data is collected in real time and is used to update the productivity database. (See also Module 06-3 - Acquiring Manpower for the Project and Module 11- Managing Databases to see what analysis and adjustments need to be considered).
- Columns 11-13 whatever standardized cost or WBS coding structure management needs or wants.
- Colum 14- Given that conditions underground are subject to frequent constraints due to water, falling rocks, bad air or other safety, health or environmental risk factors, this provides the Area Superintendent and the Foreman to report unplanned work or “work arounds” due to risk events. This data is also collected in a “Lessons Learned” database.
Because we want the field people focused on executing their work assignments safely and not filling in paperwork, and our promise to the field people should ideally be that filling in our forms would not take more than 5 minutes at the end of each shift, the only pieces of information we expect the field people to fill in are those items shown in light blue:
- Column 3) Crew Assignments (See Module 08.6.3.5 Activity Based Costing Case Study, Figure 7)
- Column 6) Actual Quantity in Place (See above, Module 09.3.3.1.1.1 Units Completed or Units in Place Method)
- Column 8) Actual Crew Hours- (See Module 06-3 - Acquiring Manpower for the Project)
- Column 14) Unscheduled or Unplanned Work
Important items from the template shown in Figure 8 that are the responsibility of PROJECT CONTROLS are:
- Column 9) Physical Percent Complete- Which is based on the Units in Place Method. To ensure accurate reporting, these reports are randomly checked periodically to ensure that the reports coming in from the field are accurate and timely and that no “games” are being played with the numbers. Having explained this, because the data is being collected 3 times a day, 365 days per year, the use of Statistical Process Control Charts (SPC) to analyze the data will quickly enable the project control team to identify any anomalies. (For More on the use of SPC charts for this type of application, refer to Module M04-6 Risk & Opportunity Monitoring and Control and Module M11-5 Updating and Using the Project Databases) This information is taken from the data sheets sent in by each Area Superintendent and is used to update the schedule and generate the SPI and CPI along with other EVM metrics.
- Column 10) Actual Productivity- Which is validated using random sampling and statistical process control charts and then is entered into the Cost Estimating Database owned and maintained by Project Controls.
To capture who worked on what activities and what materials they consumed and what machines they used can come from any one of a number of sources, but the most common sources are:
09.3.3.2.3.1 Materials Progress & Productivity Data
Consumable materials such as form oil, fuel for the plant and machinery / equipment etc is normally not charged against an activity but as a project indirect or project overhead costs.
As shown in Figure 8 above, because we have chosen to use the “Units in Place” method to calculate the physical % complete necessary to complete the earned value calculations, and because materials in place are what really matters in terms of progress, whenever possible the consumption and installation of permanent materials forms the basis for field reporting purposes.
The challenge here is to validate the accuracy, reliability and precision of the quantity take-offs and the productivity, and keeping both the quantity take off and cost estimating databases continuously updated, applying the maxim that “today’s productivity forms the basis for tomorrow’s estimates.”
09.3.3.2.3.2 Manpower Progress & Productivity Data
This information can come from a form similar to that shown in Figure 8 above or more traditionally, comes from the daily time sheets each person has to fill in and submit as the basis to get paid. Ideally, if the project controls team is working collaboratively with accounting/finance, and accounting/finance has Activity Based Costing capabilities, then each workers time would be charged against a specific activity which forms the basis for calculating part of the ACWP as discussed in Module 09-4; 09.4.3.2.4 Actual Cost of Work Performed (ACWP or AC). It is NOT recommended that a data sheet such as that as shown in Figure 6 be expanded to cover this additional information coming from the Crew Foreman level, as the objective is to keep the reports as simple as possible and NOT require the field work force to fill in any information not directly related to the work necessary to execute the activities safely and in accordance to the relevant quality standards.
IF the labour has been outsourced or is provided by a contractor, when the contractor sends the bills to accounting for processing, those outsourced labour costs also would need to be charged against each activity, just as internal labour costs are.
These templates, when completed in an accurate and timely manner, form vital records for regular manpower monitoring and planning as well as for the detailed as-built record.
09.3.3.2.3.3 Machinery Progress & Productivity Data
For small pieces of equipment, those are normally included in the crew billing rates. In the case study shown above this is how small pieces of equipment, such as concrete mixers and grout pumps have been accounted for.
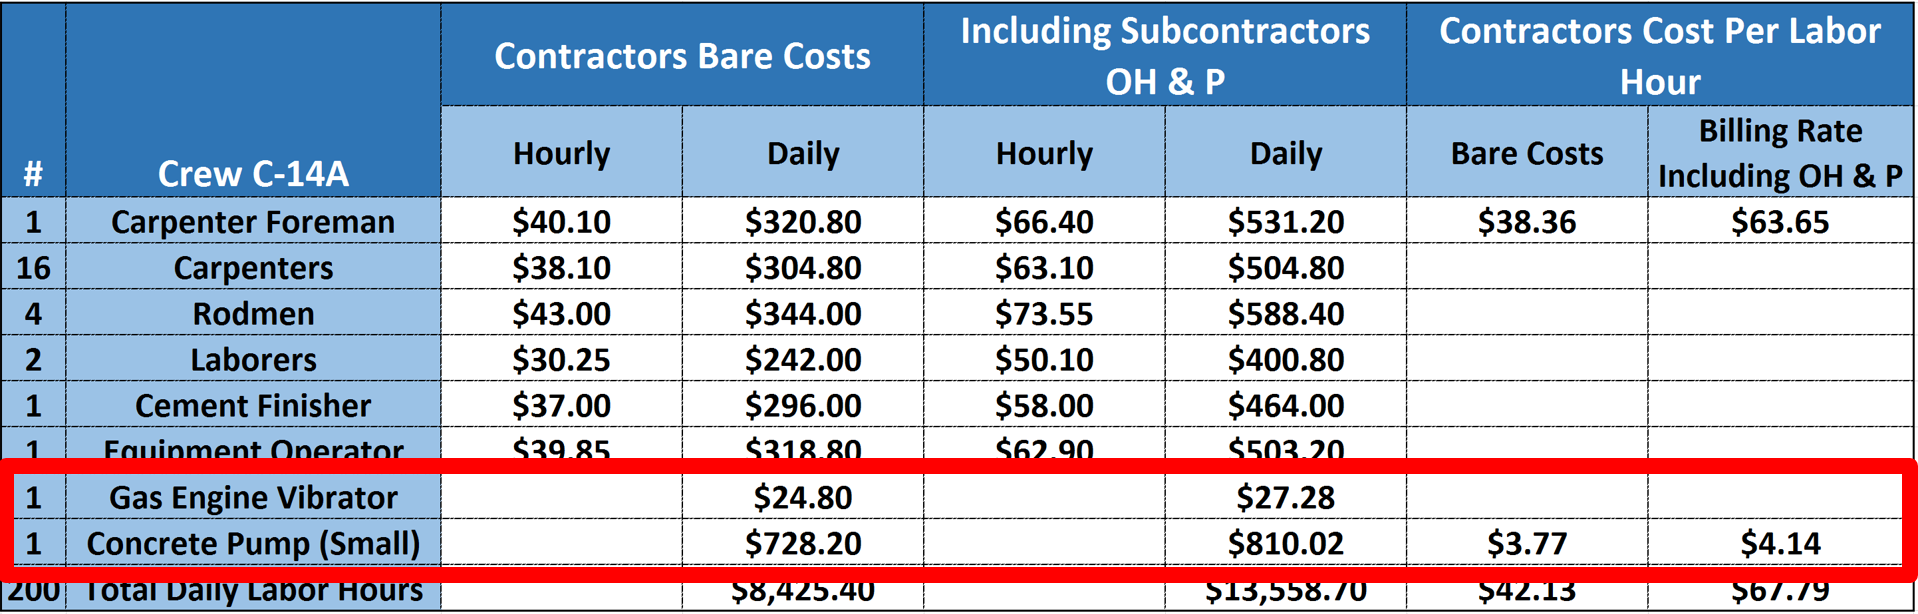
Figure 9 - Illustrating how small equipment is normally included in the Standardized Crews
Source: Adapted from R.S. Means 2008 Facility Cost Estimating Database (2008) page 1238
For larger pieces of specialized equipment, such as tower cranes, or manpower elevators, those are normally charged either against the project as a project indirect (overhead) cost or if they are specialized and used only for a specific activity or work package (e.g. Heavy Lift Crawler Cranes) then they would appropriately be charged against that specific activity or work package. For large pieces of equipment which cannot be charged against a single activity or work package, are normally accounted for in the Daily Superintendents or Contractors Daily Report Template as shown below.
09.3.3.2.3.4 Recording, Compiling & Reporting Physical Percent Complete and Actual Cost of Work Performed
Referencing Ridwan Wibiksana’s paper, their Project Controls department compiles the data from all the foremen and area superintendents using this form:
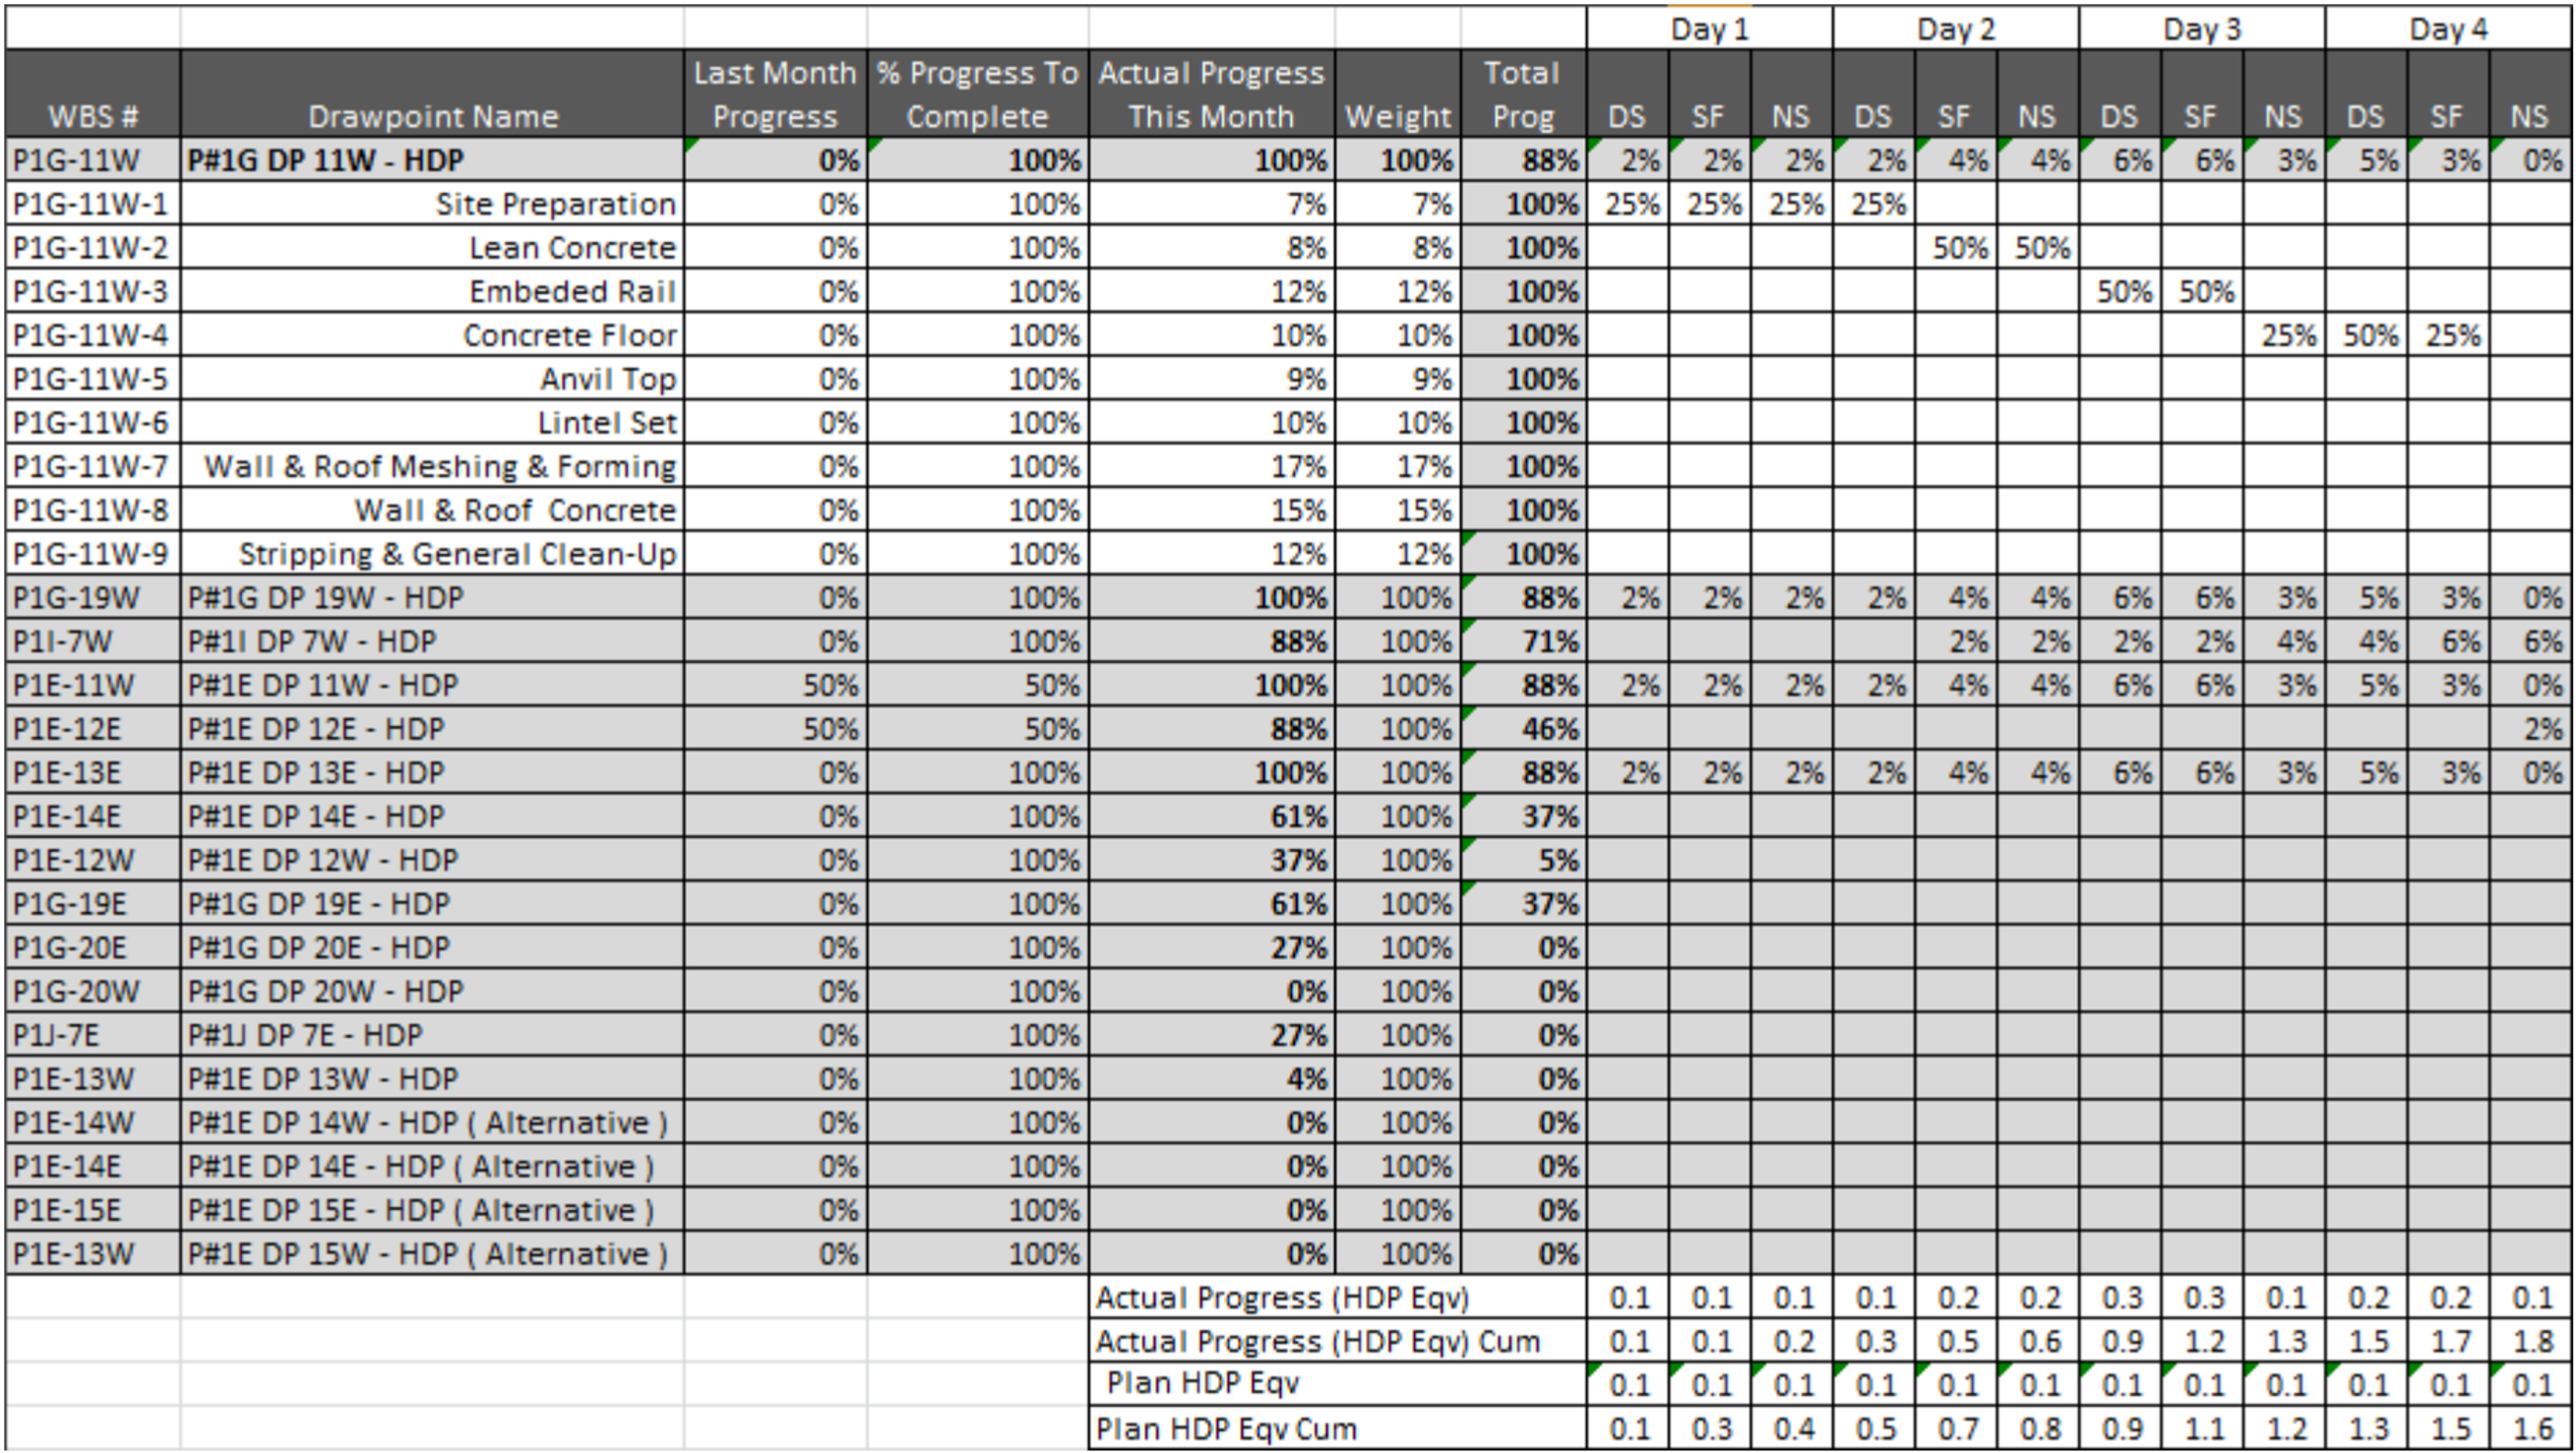
Figure 10 - Daily and Monthly Roll Ups For all Crews and All ShiftsSouce: Wibiksana, Ridwan (2012) PM World Journal EVM Adapted for Underground Mining Operations Vol. I, Issue II – September 2012 In Figure 10 above, we can see how the physical progress has been taken from the Foreman (Figure 6) and Area Superintendent’s reports (Figure 8) then recorded for the Day (DS) Swing (SF) and Night (NS) shifts and while progress is captured on an ACTIVITY basis, (see white cells) it is presented to management in a summary or “rolled up” version. (see greyed cells) This information is used to generate the SPI which is presented to appropriate levels of management using a dashboard report. (See Modules 09.5.3.3.3 IEAC1 Figure 18 and Figure 23 - Real Life Example of a Web Based Program Status Report Dashboard using Earned Value Metrics for two example of reports from this case study project).  Figure 11 - Capturing Actual Cost of Work Performed (ACWP or AC)
Souce: Wibiksana, Ridwan (2012) PM World Journal EVM Adapted for Underground Mining Operations Vol. I, Issue II – September 2012
Concluding the use of this case study for this module,, in addition to the capturing the physical percent complete, because the accounting system is capable of handling Activity Based Costing, they also capture and report Actual vs Estimated DIRECT COSTS which the Project Controls team uses to calculate CPI (See Modules 09.5.3.3.3 IEAC1 Figure 18 and Figure 23 - Real Life Example of a Web Based Program Status Report Dashboard using Earned Value Metrics for two example of reports from this case study project) For this example, the actual values were not shown as they are confidential and proprietary. As with Figure 10 above, while the actual costs are captured at the ACTIVITY level (see white colored cells) for reporting to management, they are rolled up. (See grey colored cells)
NOTE: As the GPCCAR document is, as the name states, a COMPENDIUM, for those needing or wanting more information on this case study and how it was done, you need to review the original paper as published by Ridwan Wibiksana, PMP, CCP. Wibiksana, Ridwan (2012) PM World Journal EVM Adapted for Underground Mining Operations Vol. I, Issue II – September 2012
09.3.3.2.3.5 Daily Superintendents or Construction Managers Report
Reiterating the comments above, we have provided a real Contractors Daily Progress Report which provides vital information which is collected on a daily basis. Refer Figure 12 below:
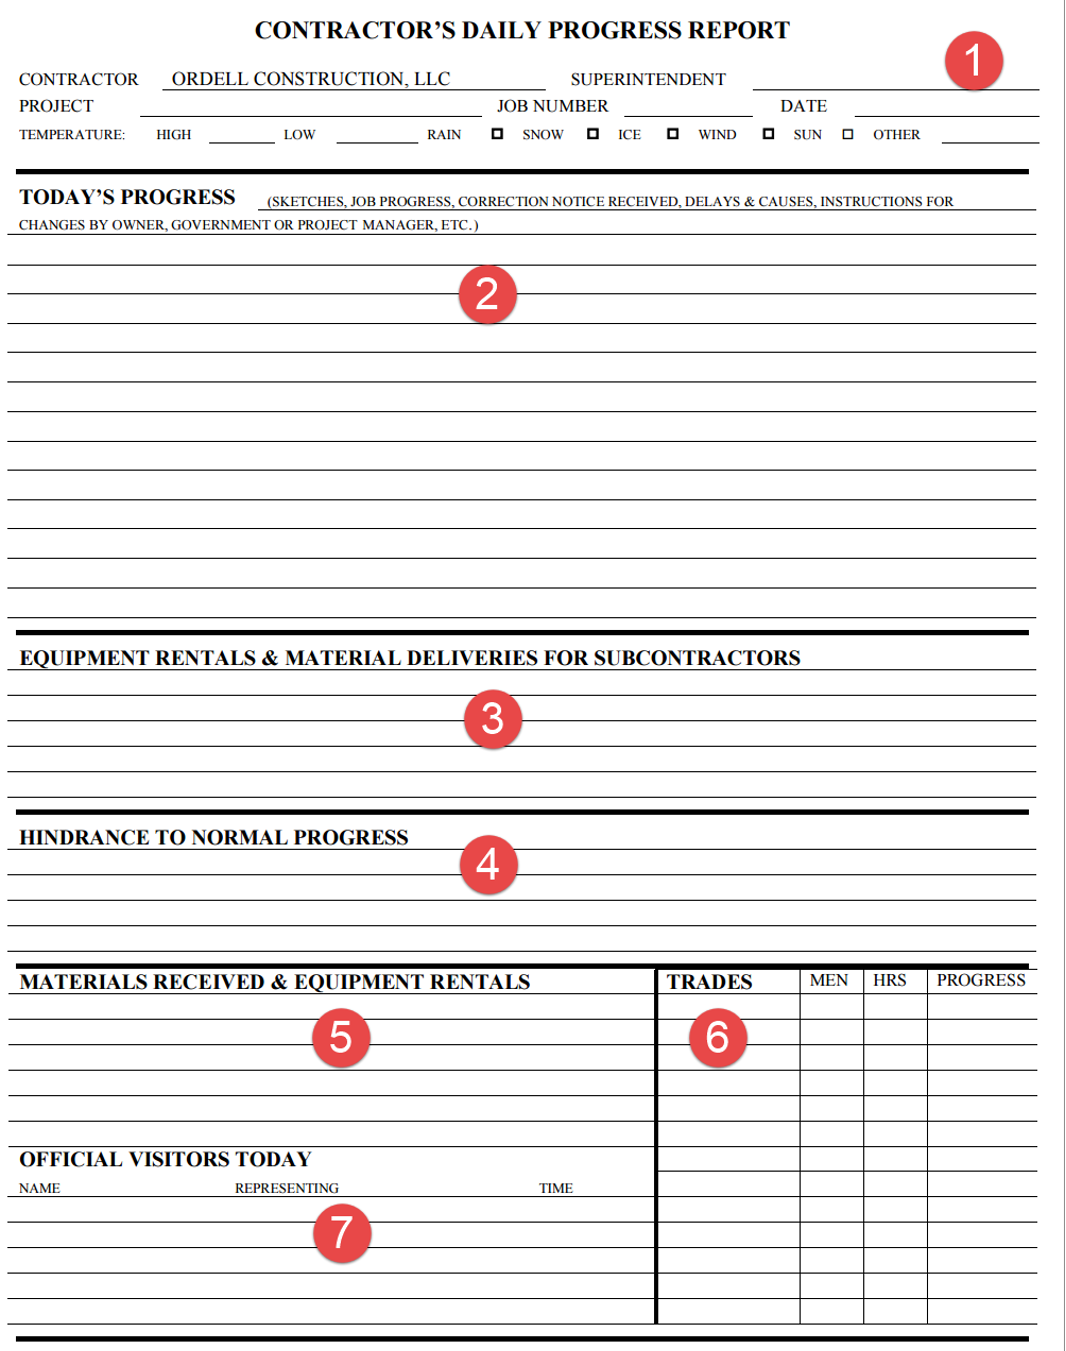
Figure 12 - Sample Daily Reporting Sheet
Source: Ordell Construction
- This section contains the project information as well as the working conditions on the jobsite
- In this section, the Superintendent or Construction Manager provides a narrative description of the work which went on.
- Here the Superintendent or CM records equipment and materials for the SUBCONTRACTORS
- In this section, the Superintendent or CM records problems encountered which impacts productivity
- This is where we can find the equipment rentals and materials received by the Prime or General Contractor
- This lists all the trades on side, the number of men, the hours they worked and the activities they worked on
- Lastly, here we record who visited the project, what their purpose or objective was and the time they were on the job.
In the event of claims or disputes, this specific record is often the single most important document we have to support or refute claims as to what happened on the project.
Ideally it should corroborate and be consistent with what the CPM schedule updates are showing, and if not, an explanation about WHY not.
If nothing else it forms an excellent source of project information which can be used for detailed analysis.
09.3.3.3 CAPTURE ACTUAL COST OF WORK PERFORMED
This module is going to explore and try to explain how to fix one of the most endemic problems project control practitioner’s face, and that is how to capture “real time” cost data to match costs (i.e. the ACWP or AC) vs physical progress (i.e. the BCWP or EV) and compare these two values against the Early and Late Date S Curves (i.e. BCWS or PV).
In this module, we will also explore both owner and contractor cash flows as earned value is directly related to progress and given contractors often "live or die by their cash flows", it is in the best interests of both owners and contractors to maintain a healthy cash flow, based on work physically completed and accepted.
09.3.3.3.1 Interfaces between ERP and CPM Scheduling Software
The interfaces between the various ERP and CPM schedules is most often done via a dedicated flat file server, where data that the ERP system’s need (i.e. Physical % Complete, BCWP or Earned Value, Actual Start and Actual Finish dates) are uploaded into the dedicated server, while information which the CPM Scheduling software needs (i.e. Actual Cost of Work Performed, Committed Costs, Billed Costs and Paid Invoices)
While there are commercial products available which have automated this interface, they tend to be very expensive and have proven to be buggy. However, this interface is an essential one and improvements are being made to ensure a seamless and error free data exchange. However, the key to making these data exchanges work lies with the standardization of the various coding structures, which we have covered in previous modules and will cover in more depth in Module 11- Managing Project Databases.
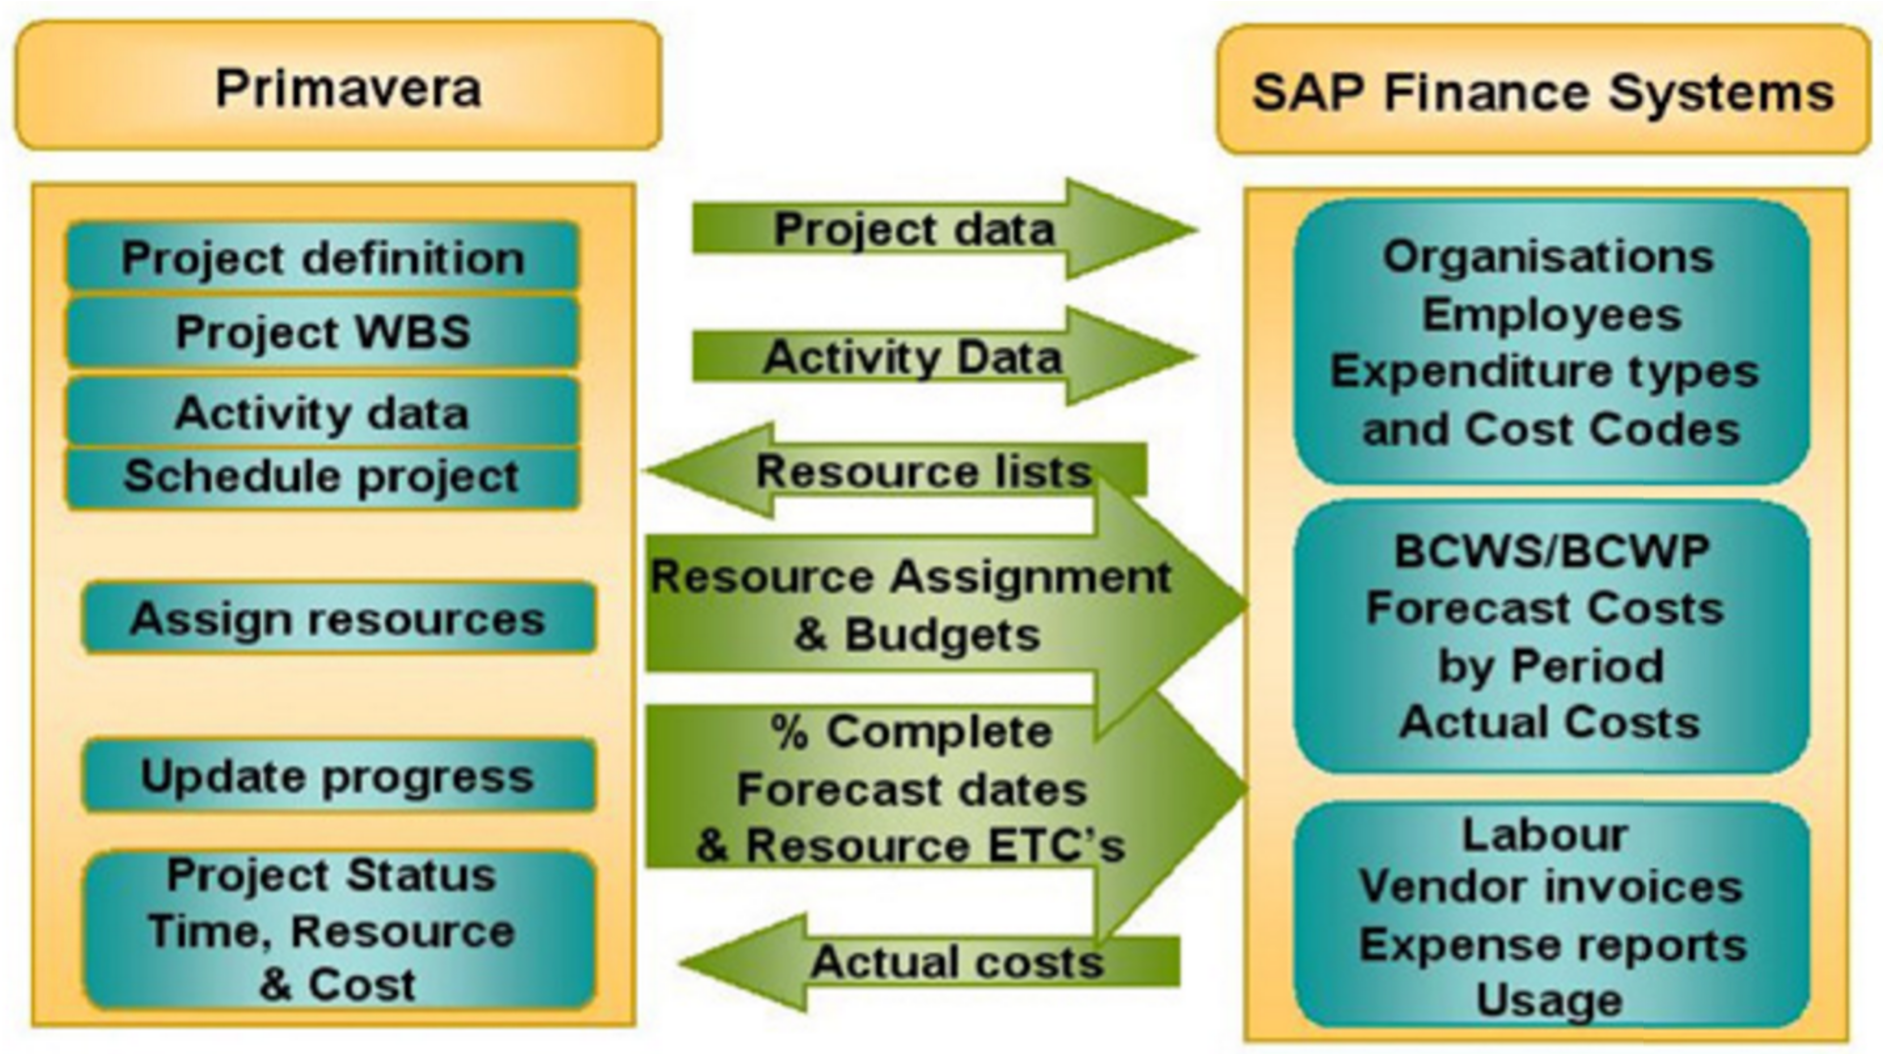
Figure 13 - Typical Data Exchange Interface Between CPM Scheduling Databases and ERP Finance Databases
Source: Forgetrack Ltd
As it is the GPC’s policy not to endorse any specific product, given that Primavera and MS Project are the two most well recognized project control “solutions” the references below cover those two systems. While these references are product specific, the concept should be readily adaptable to any software.
As this is a common problem faced by project control professionals, here are 3 additional references to help you get started if you are faced with this problem. However, what you will notice is that the key point in all these references is the importance of having STANDARDIZED WBS, CBS, Resource Dictionaries and their associated coding structures, otherwise the databases will have no way of communicating with one another.
Primavera...
- Prescient Solutions (2012) https://www.youtube.com/watch?v=ku3btjCGYy8
- Tepco (2011) https://www.youtube.com/watch?v=nGrbGaUlHYg
- Al Ghamdi, Manall (2012) http://events.asug.com/2012AC/2810_Project_System_and_Primavera_Integra…
Microsoft Project...
- TPC (2012) https://www.youtube.com/watch?v=hd9KTi5Opr8
- TPG (2012) https://www.youtube.com/watch?v=Ng8LKxvFof0
09.3.3.3.2 Capturing Actual Cost of Work Performed and Closing the Accounting Time Gap
Regardless of the claims made by software vendors, obtaining “real time” (defined to be less than 24 hours old) cost data from even the more sophisticated systems (i.e. SAP or Oracle’s PeopleSoft) has proven to be elusive. Unfortunately, as capturing “real time” Actual Cost of Work Performed (ACWP or AC) is so critical to project controls, the simplest and best approach is for us to do it ourselves understanding that the results may not be perfect (for ultimately, the accounting records will always over-rule our records) but it will give us some confidence in providing our stakeholders with credible and supported real time cost information AND it also serves as a “quality check” on the accounting records (i.e. GIGO- “Garbage In/Garbage Out”)
Below is a screen shot taken from an Excel spreadsheet using the same example used in the previous module, where we have three activities, Activity A being 3 work periods long and having a value of $840, Activity B being 5 work periods long and having a value of $1,000 and Activity C being 6 work periods long and having a value of $960. Keep in mind that this is the contractors SELLING price to the owner, meaning it includes the contractors:
- Direct Costs (Labor, Materials, Equipment)
- Project Indirect Costs (i.e. Project Management, CSI Division 1 General Conditions costs, trailers, toilets, temporary power etc)
- Contingency / Price Contingency / Risk Contingency These top 3 cost categories are what are known as “Cost of Goods Sold” or “above the line” costs and the resulting profit is called GROSS PROFIT. These costs are what the on-site project/construction manager have control over and thus are held responsible for and are provided with appropriate authority to make the kinds of decisions to manage those costs effectively
- Home Office Indirect Costs (CEO’s salary, home office rental, cost estimating and bidding departments, accounting/finance and cost of money, taxes and insurance.) These are what are known as “General, Sales and Administrative (GS&A) costs” or “below the line” costs. These are the costs of doing business whether the organization has zero projects or 1,000
- Deducting the “below the line” Costs from the GROSS PROFIT gives us NET PROFIT, which is often referred to as “EBIT”- “Earnings before Interest and Taxes”. It is this margin which for most contractors is a single digit- i.e. <10%
For OWNER’s, in addition to the “cost” loaded activities provided by the contractor, you have to ADD your own cost loaded activities which cover:
- Owner’s Project Overhead Costs (i.e. Project Manager, Project Controls Department, QA/QC, Safety etc)
- Owner supplied Equipment (i.e. long lead specialty equipment such as pumps, heat exchangers or vessels)
- Owner supplied Materials (i.e. Bulk materials such as pipe or fittings)
- Owner supplied Professional Services (i.e. Architect, Engineer, Quantity Surveyors etc)
- Owner’s Home Office Overhead
Thus the OWNER’s S Curve will ALWAYS be larger than that of the Contractor and if the owner wants to be able to capture the real or true costs of the projects for the purposes of amortization and depreciation, they will track their own costs as diligently and as closely as the contractor will be tracking his, understanding that unless the contract is an “open book” or “cost reimbursable” type contract, the contractor is NOT obligated to disclose his/her costs to the owner and most likely would not unless required to do so because of arbitration or litigation processes.
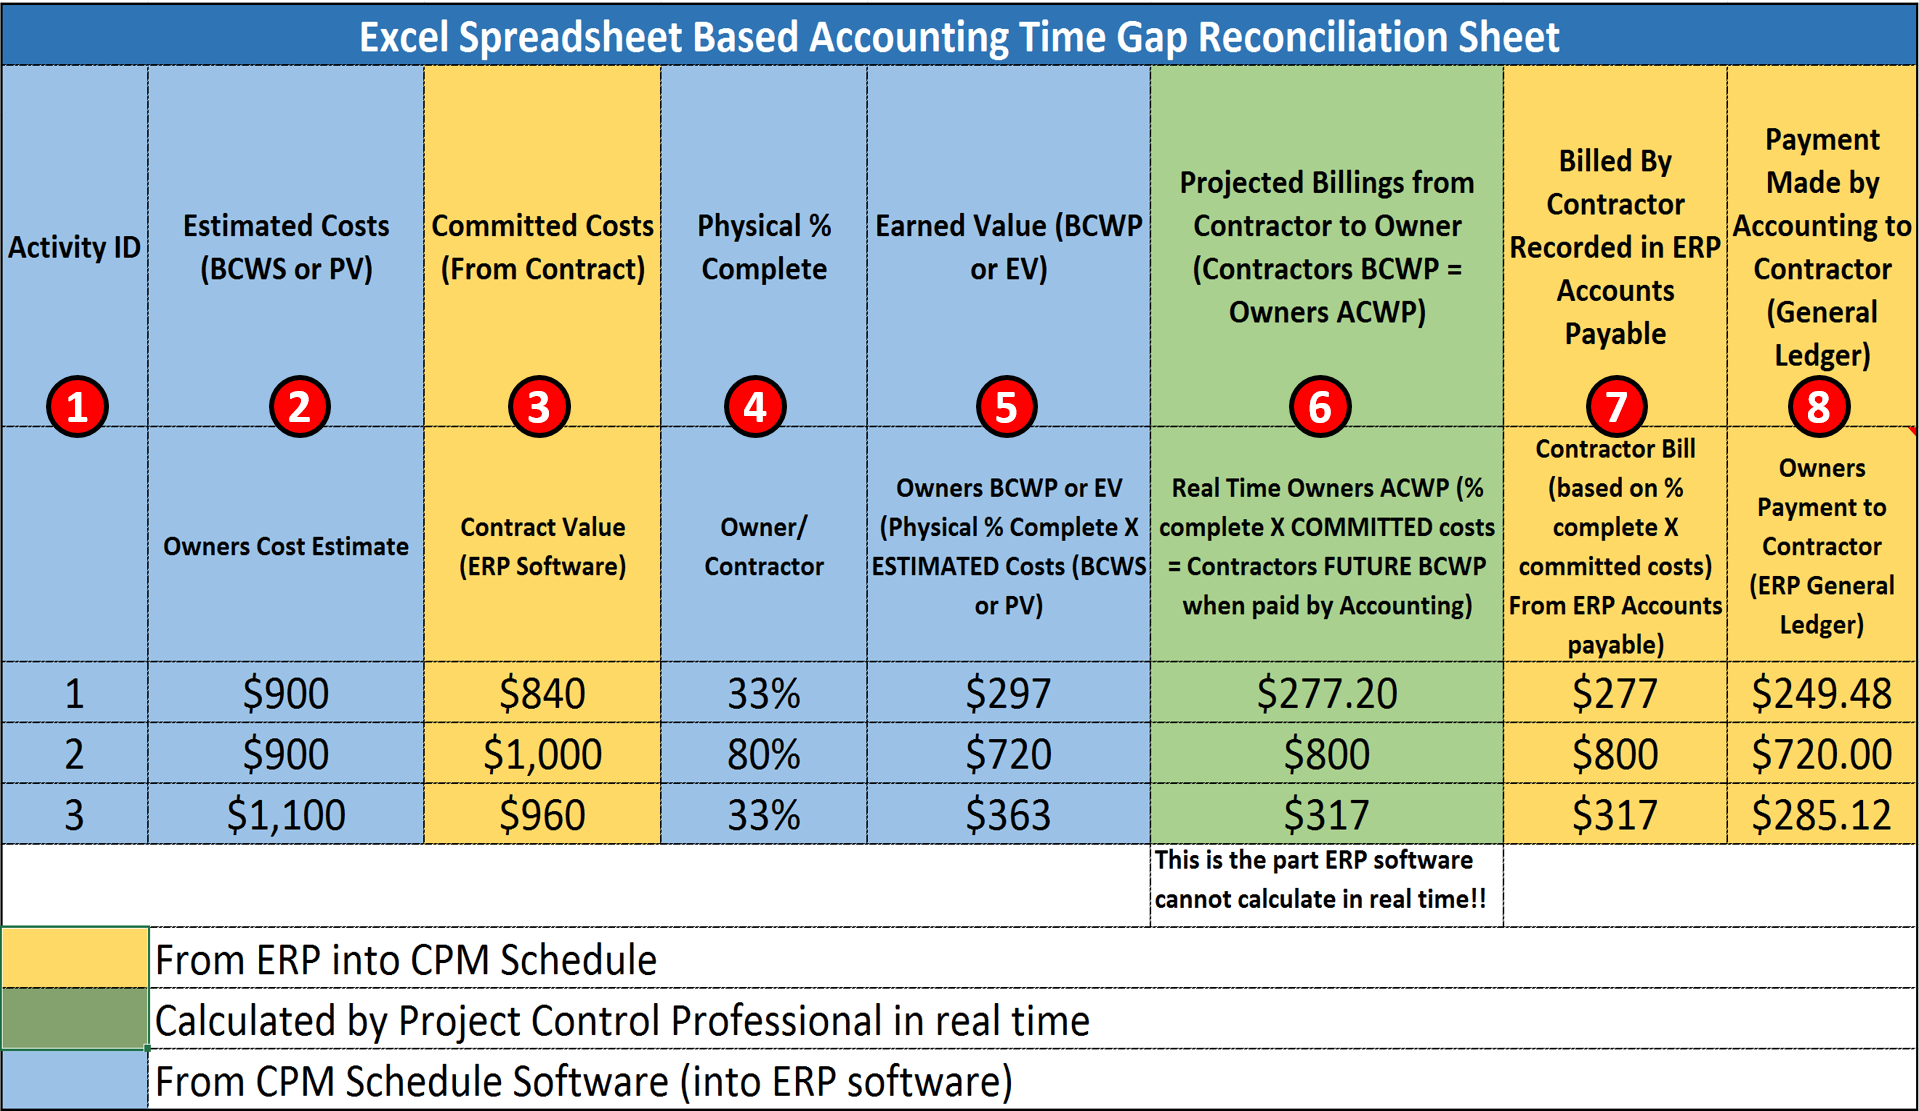
Figure 14- Excel Based Accounting Time Gap Reconciliation Sheet
Source: Giammalvo, Paul D (2015) Course Materials Contributed Under Creative Commons License BY v 4.0
Using Figure 14 we can see how the accounting is reconciled in regard to the "S-curve Set Up for the Owner to Track Costs" Case Study shown in Figure 2 from Module 09-1 - Introduction to Managing Project Progress.
In Figure 14 above the Activity ID (Column 1) is also exactly the same as in the original example shown in the previous Module 8 - Managing Cost Estimating and Budgeting.
Column 2 is the OWNER’s internal or independent cost estimate for each of those same activities and as you can see, for some, the owner was higher than market value and for others, the owner’s cost estimators were lower - If owners do not do this step, and substitute the CONTRACTORS selling price, your CPI will always be 1.0, which really is not much help to you in managing the costs of the project. If project costs are important then owner organizations need to cost load down to the activity level. (minimum Level 3 and preferably, Level 4)
In Column 3, we have the detailed cost estimate as submitted by the contractor - If the ERP software is configured for Activity Based Management (ABM) (which it ideally should be) then this information should be accessible in SAP or PeopleSoft or whatever other software package you are using. However, if they are NOT configured for Activity Based Management then this step will also have to be done by the project control practitioner using Primavera, MS project or other CPM scheduling software.
In Column 4, we go out to the project and using one of the 6 methods of calculating physical percent complete, we determine what PHYSICAL percent complete each activity is.
Column 5 is where we multiply the PHYSICAL PERCENT COMPLETE (Column 4) X the Owner’s Cost Estimate (Column 2) which gives us the OWNER’s Earned Value (BCWP or EV) for that activity (Column 5)
In Column 6, is where the project control professional can add real value. Historically, it has been difficult if not impossible to get the ERP systems (i.e. SAP and PeopleSoft et al) to be able to calculate Earned Value at the ACTIVITY level. Which means the project controller, as he/she has the Contractors original cost loaded schedule, is able to ANTICIPATE what the contractor is entitled to bill at some point in the future. To do this, the project controller takes the same PHYSICAL PERCENT COMPLETE from Column 4, but this time, multiplies it by the Contractor’s BCWS for that activity. (Column 3)
At some point in the future, the contractor will send a bill to the owner (which hopefully will be reviewed and approved by the owner’s project control team) and as a check, as we can see from Columns 7 and 8, the owner’s project control professional can see not only what was billed against his or her project but also what was actually paid to the contractor. This is important for two reasons:
- We want to ensure that the contractors and vendors on our project are being paid promptly and correctly for work they have completed and
- We want to make certain that our project is not being billed for work that was somehow mischarged, either through the contractor not using the correct or appropriate charge cost code OR by a data entry error.
There is another important reason why seeing what was actually billed and paid against each activity vs what was earned and that is to help identify corruption and other games that people play with the numbers. Eventually the Contractor will bill for the work on each activity which will be recorded in the ERP software as an account payable and when that bill is paid, it will be recorded as a debit to accounts payable. What project controllers will come to find out, often the amount paid is NOT the same as the amount billed and that has to do with retention and other adjustments made to the payment in compliance with the terms and conditions agreed to by the contractor when he/she signed the contract. (i.e. there may be an interim delivery penalty or a prompt payment discount or a late payment penalty from previous billings).
09.3.3.3.3 Reviewing Both Owner and Contractor Cash Flows
Contractors often "live and die by their cash flows" and one of the major reasons behind poor contractor performance is lack of sufficient cash flow to staff the project.
Thus it is in the best interests of the owner to ensure that a contractor has a healthy cash flow and is using that money to staff his/her project. At the same time, the owner does not want to be subsidizing the contractor by paying for work not physically completed.
Because poor contractor (or subcontractor or vendor) performance is one of the major concerns of the project control team, we have included the analysis of both owner and contractor cash flows under this heading, as this is an issue between the project controls team and accounting/finance, regardless of whether you are an owner or contractor’s project control team member.
Very often project controls (directly or through the project manager) end up being the interface between the prime/main contractor, sub-contractors and vendors to ensure they get paid for the work they are legitimately entitled to. Explained more specifically, often it is the senior project control practitioner who has to intervene to ensure that everyone on the project is paid exactly what they are entitled to and in a timely manner. See more on this under Module 5 - Managing Contracts, especially the part about Mechanics Liens.
For contractor’s project controls teams, you can almost be assured that your accounting/finance department will be in close contact with you, not only asking about past due amounts of money but asking you to produce cash flow analysis into the future. Why? Because one of the major challenges of contractor accountants and finance departments is managing cash flows at the corporate or home office level.
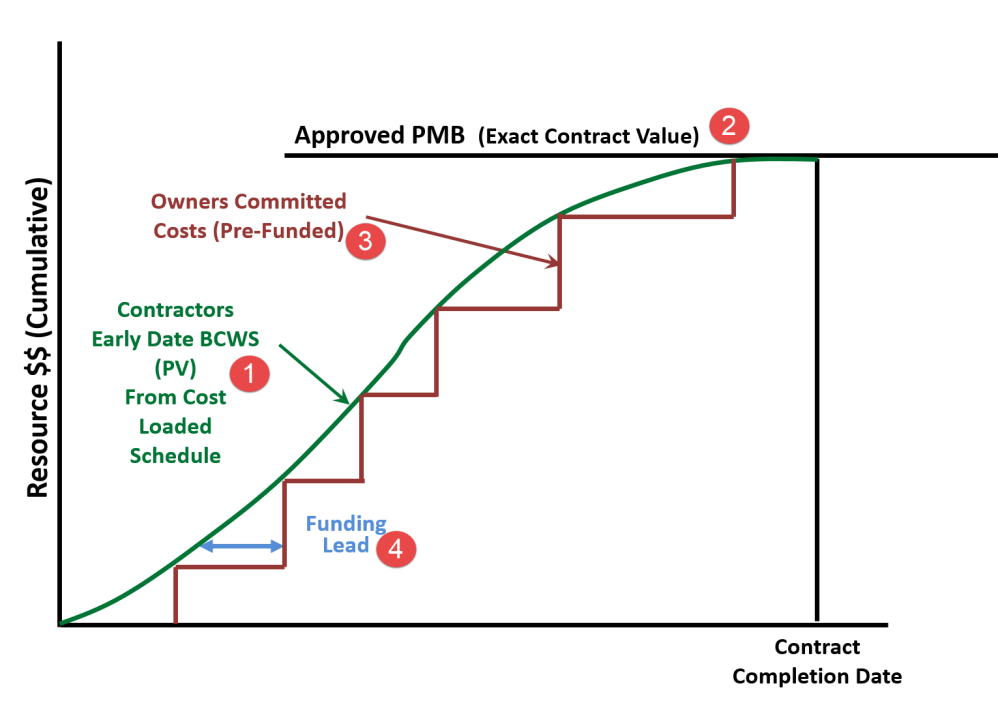
Figure 15 - Step 1- Contractor’s BCWS Early Date Curve as the Basis for Owner’s Pre-Funding Commitments
Source: Giammalvo, Paul D (2015) Course Materials Contributed Under Creative Commons License BY v 4.0
Important to note: in the following set of graphics, the Late Date Curve has been eliminated from this for clarity purposes only, just to keep the explanation as clear as possible. It is NOT a good practice to eliminate the Late Date Curve and the Guild is not advocating that we do so normally.
In Figure 15 above, we can see how the OWNER can and should be using the CONTRACTORS early date curve (item 1) generated by the CONTRACTOR in his cost and resource loaded schedule and submitted as a prerequisite in order to get the Notice to Proceed (NTP) or other authorization from the owner to start work. As noted in (2) above the CONTRACTORS BCWS (or PV) should exactly equal the contract value as shown in the contract. The owner takes this early date curve and uses it as the basis to establish the owners cash out budgets (3), assuming the owner wants to pay the contractor promptly for work done correctly which should be the case. This is known as the FUNDING LEAD (4) and is normally 30-45 days, understanding that the OWNER’s project manager does not want to draw down approved or committed funding until the last possible moment, as this money is not “free” and the interest on this funding is charged against the owner’s project overhead costs.
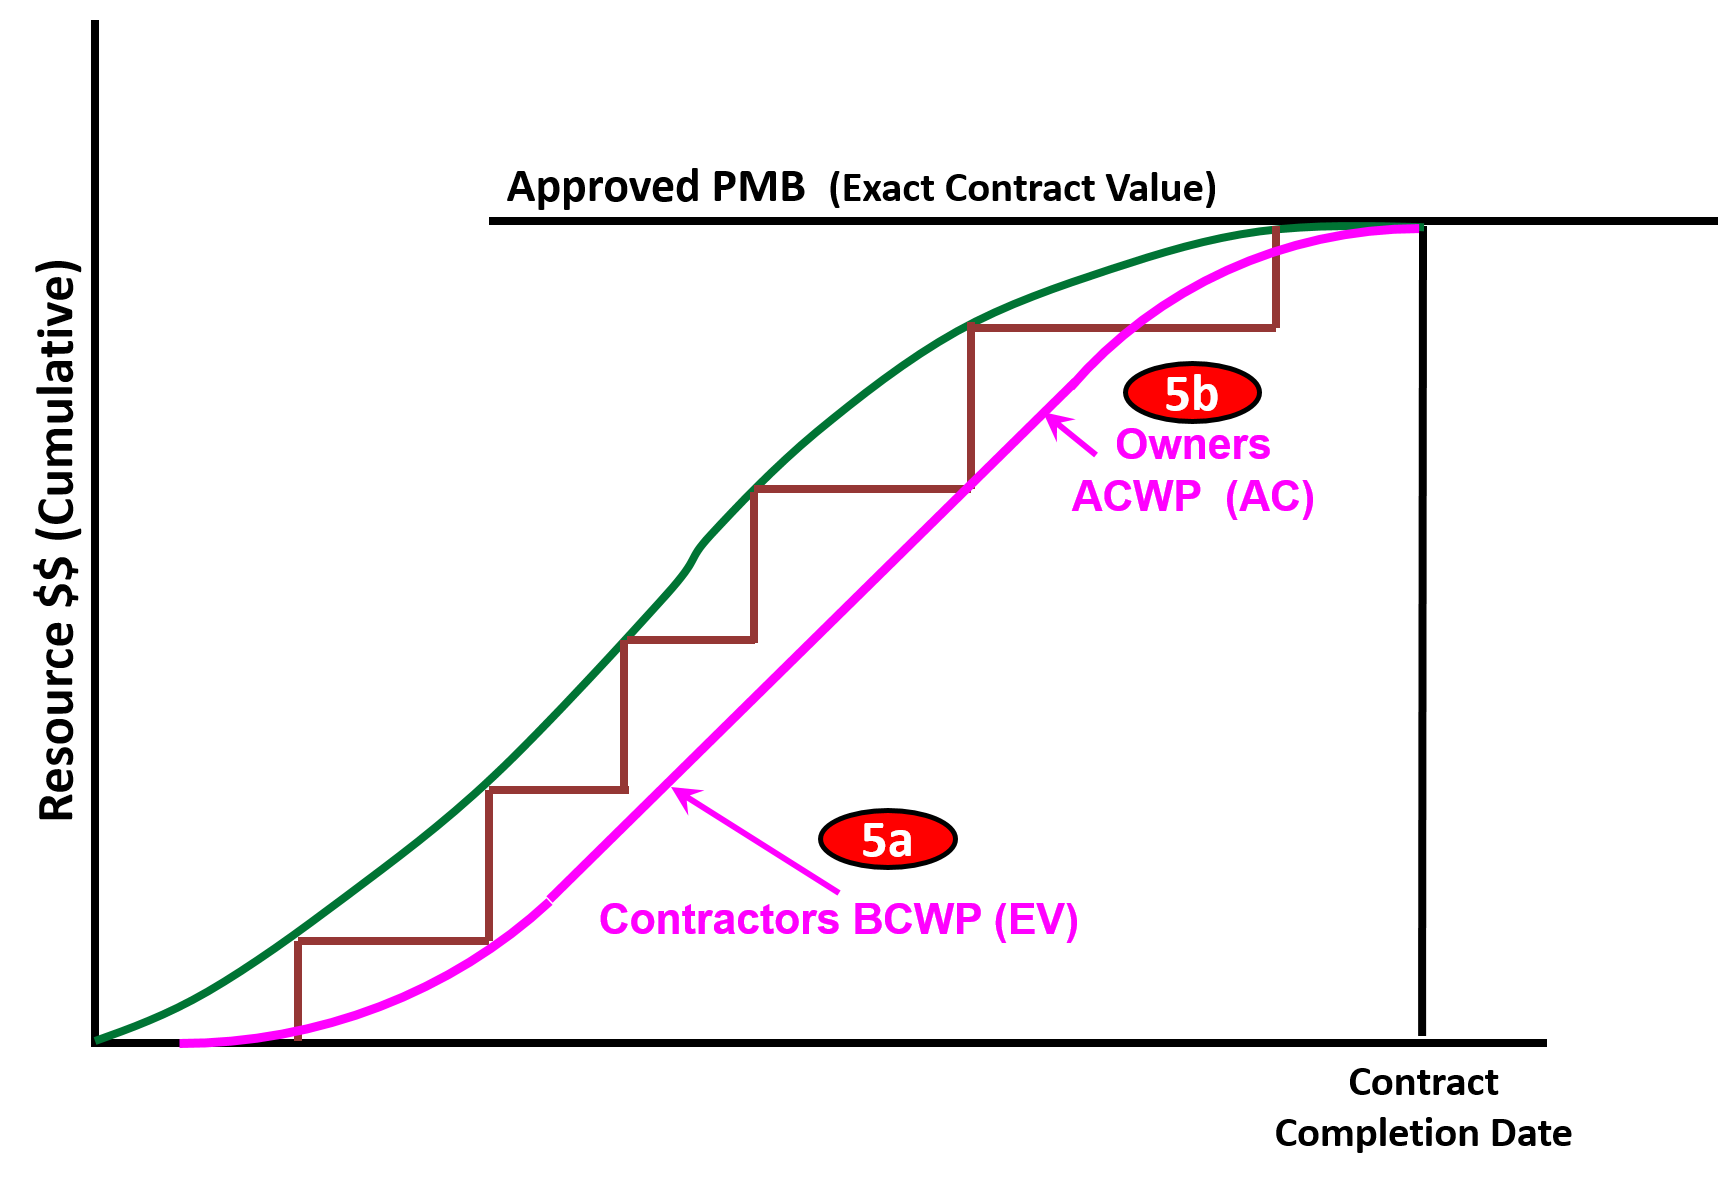
Figure 16 - Step 2- Contractor’s BCWP (Earned Value) become the Owner’s ACWP (Actual Cost of Work Performed)
Source: Giammalvo, Paul D (2015) Course Materials Contributed Under Creative Commons License BY v 4.0
In Figure 16, we can see that as the Contractor executes work, his BCWP (earned value) (5a) will, after the contractor has billed the Owner for what he has earned, become the Owner’s Actual Cost of Work Performed. (ACWP) (5b).
Note that this is somewhat of an over-simplification as the owner has his own project overhead, owner supplied equipment, materials and other costs he has to charge against the project, but for the purposes of this example, let’s ignore those and focus on the contractor’s cash flows.
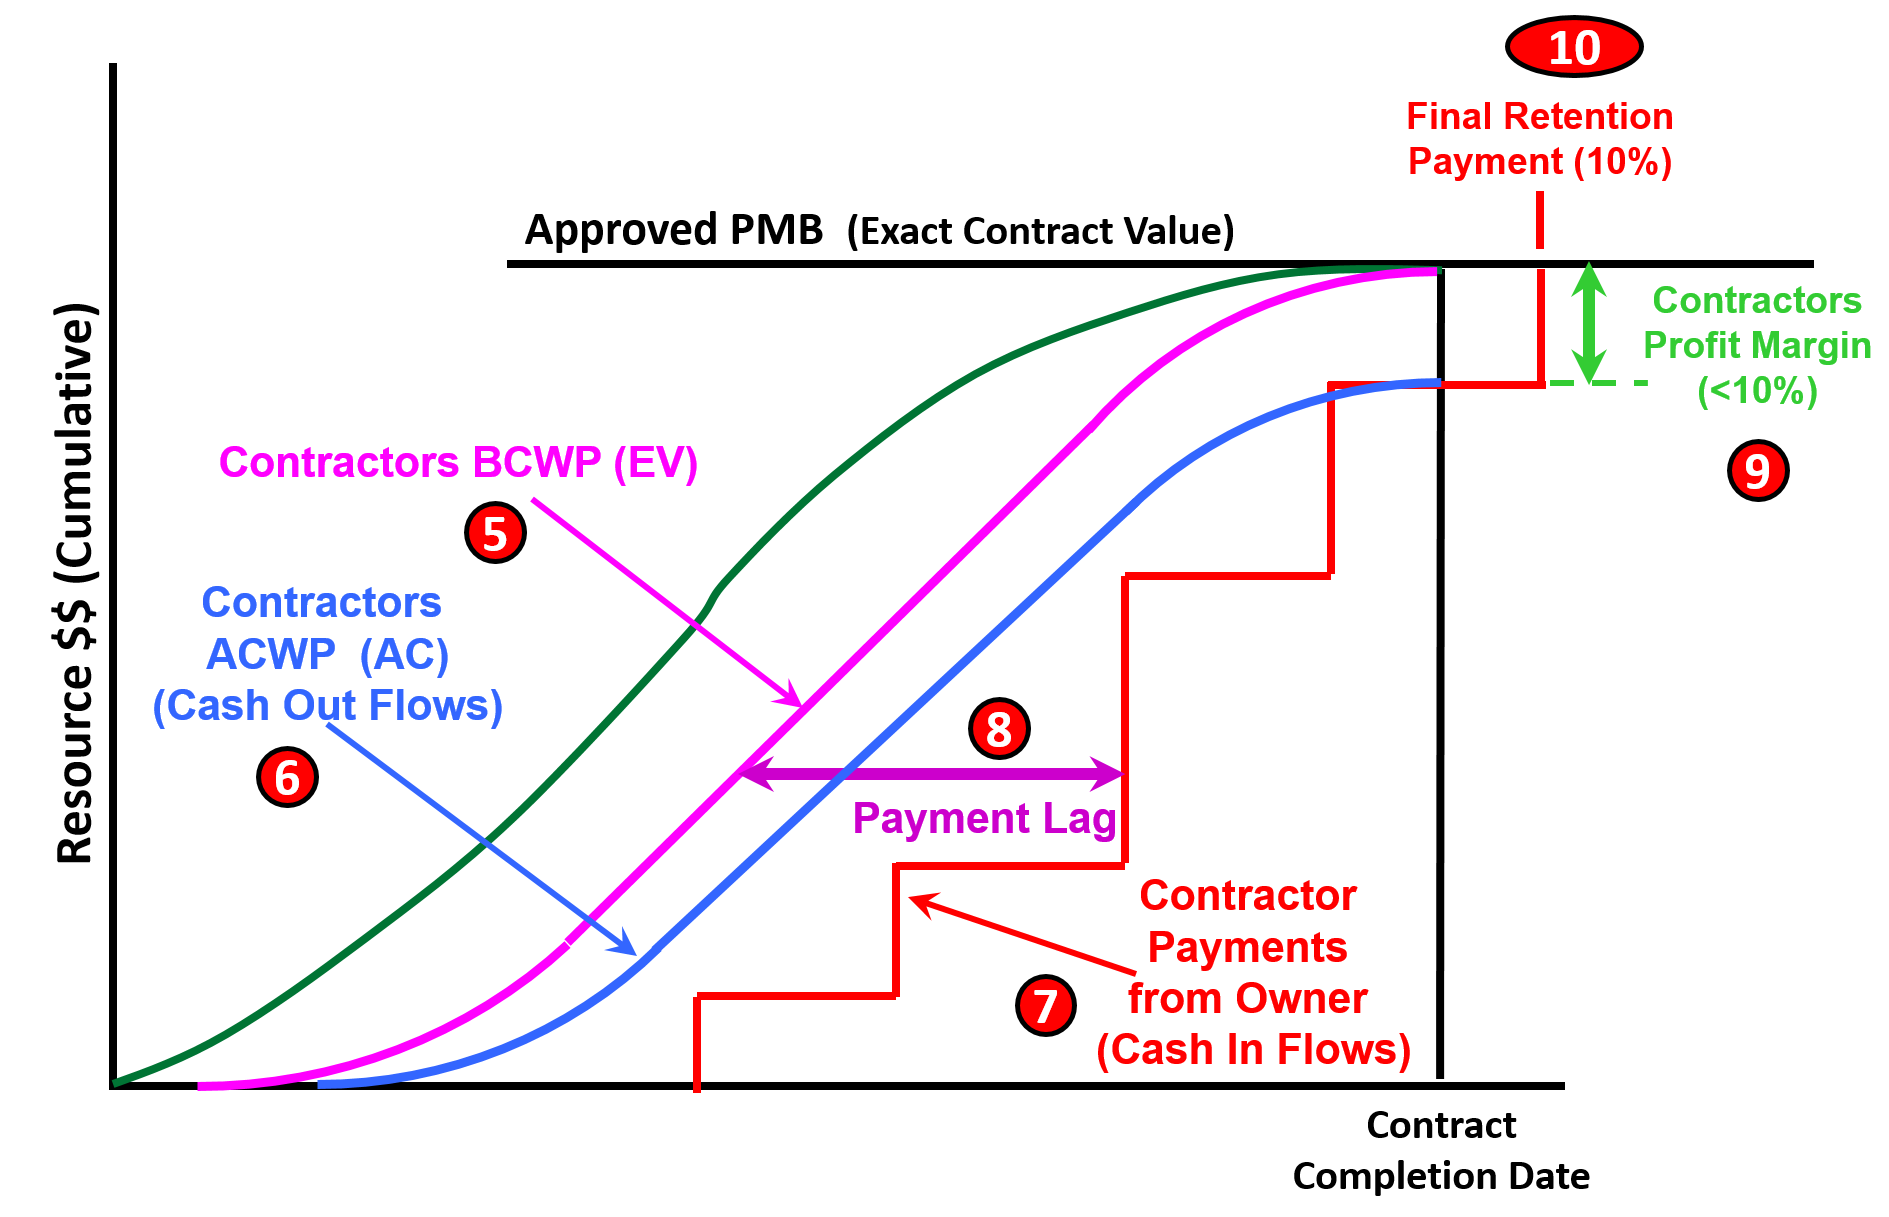
Figure 17 - Step 3- Illustrating the Payment Lag between the time the work is physically completed and when the contractor is paid
Source: Giammalvo, Paul D (2015) Course Materials Contributed Under Creative Commons License BY v 4.0
In Figure 17, we can see that the Contractor for the work the Contractor is entitled to BILL for (5a and 5b) (his BCWP or Earned Value) he also has to pay his labour and overhead costs for that work (6) and although the Owner will never see that information (unless the contract is cost reimbursable or other “open book” type contract) the contractor is capturing his own (6) Actual Costs of Work Performed (ACWP or AC) costs in real time. We also know that historically, the time lag between the date the work is physically completed (5) and the time the contractor is paid for that work is often 45-90 days (7). This delay between the time the work is done and the time the contractor actually receives the money for that work is known as the Payment Lag (8). Also keep in mind that the contractors cannot provide this “interim financing” for free, meaning they have to build in the time value of money into their cost of doing business.
Another point illustrated in Figure 17 above is that given Contractors historically work on small profit margins (9) and given that retention is often delayed until 45 – 90 days after the completion of the project, the contractor does not realize any profit margin until the retention is released (10). This explains why contractors push so hard to get retention released on the early work packages (e.g. Excavation and Foundations) well before the project is completed.
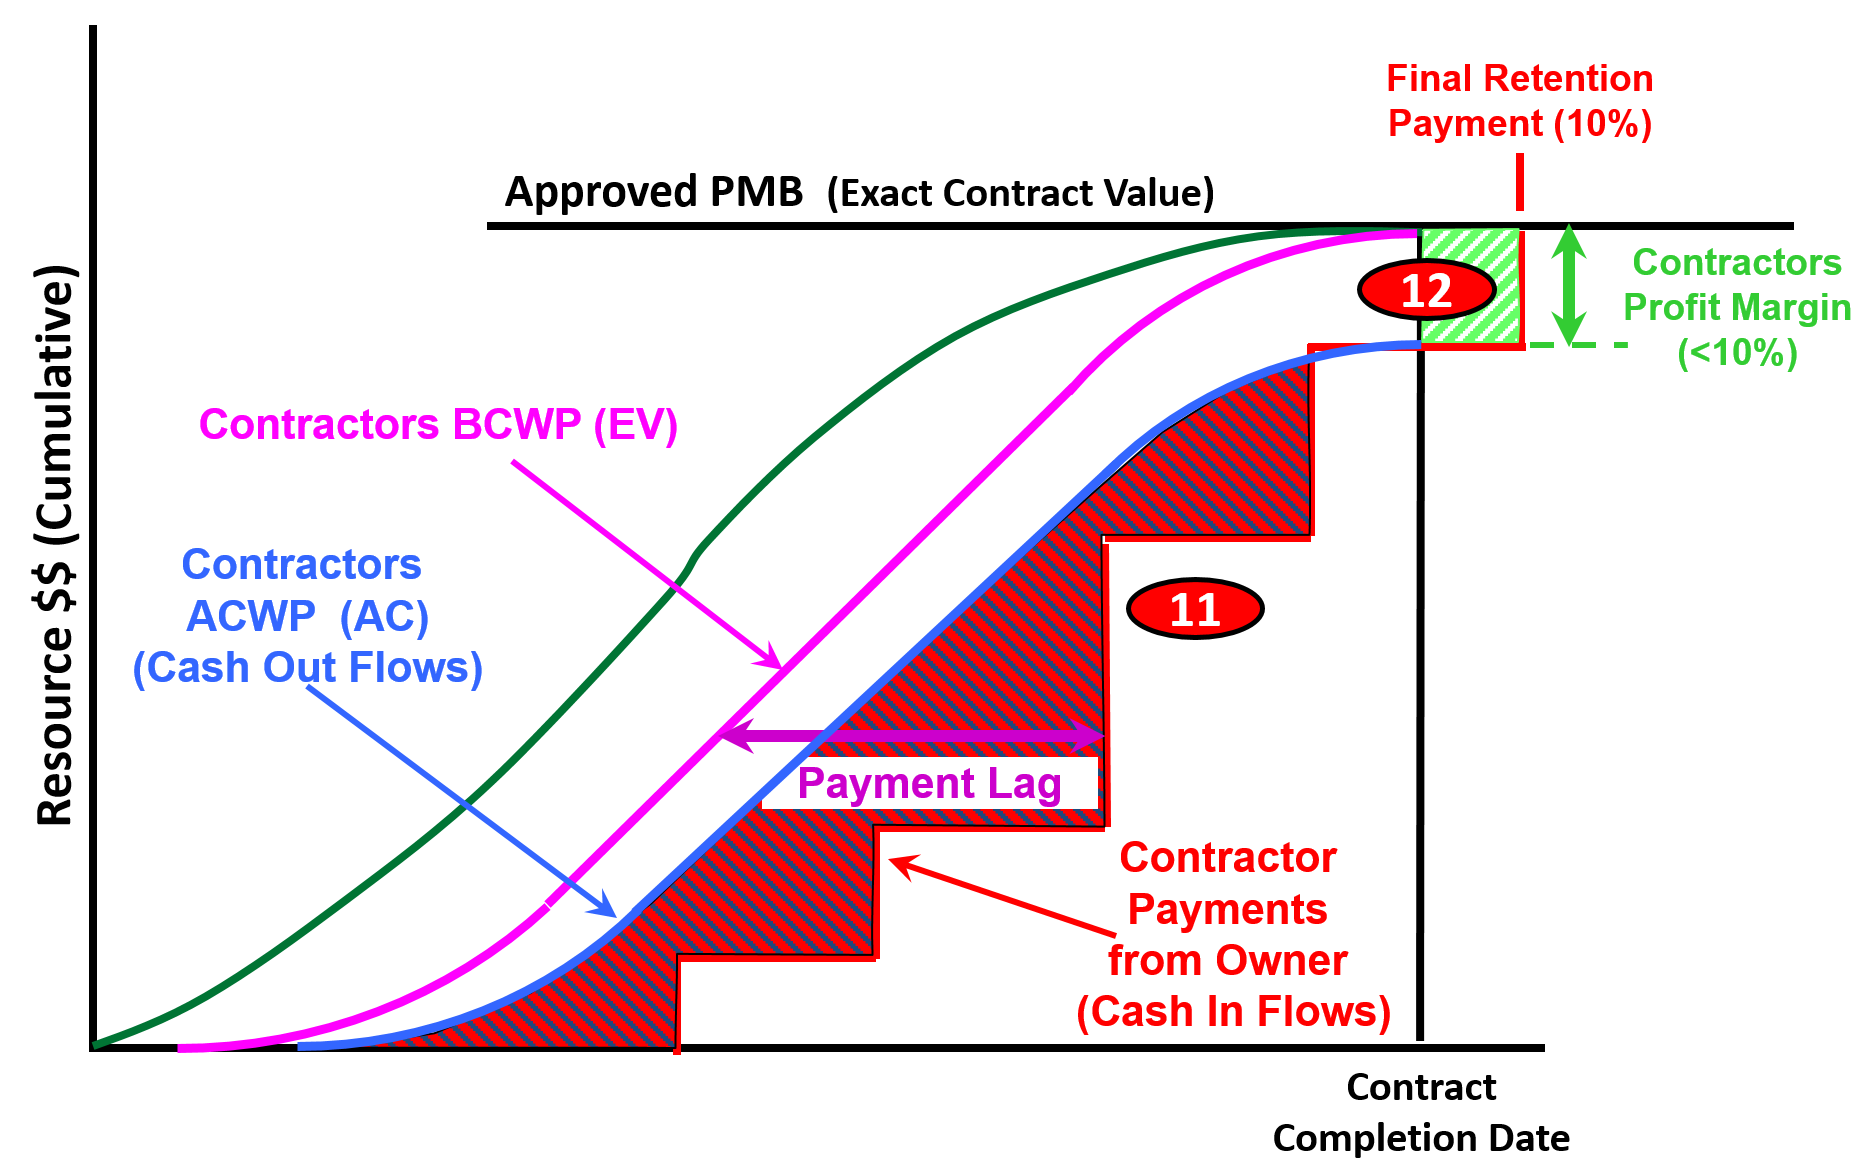
Figure 18 - Step 4-Final Build Showing Negative and Positive Cash Flows from the Contractor’s Perspective
Source: Giammalvo, Paul D (2015) Course Materials Contributed Under Creative Commons License BY v 4.0
In this final progression, we can see that the difference between the contractor’s Actual Cost of Work Performed (ACWP or AC) and what the Contractor is being paid is NEGATIVE CASH FLOW. (11) (Red and Black hashed lines) The contractor’s must pass along the cost of providing interim financing to the owner as a cost of doing business (below the line cost) which means they don’t see any “profit” on a project until the end of the project including the completion of the punchlists / snagging etc. (12) (Green and White hashed lines)
For owners, you need to understand that delaying payment not only hurts the performance on your projects and by expecting the contractors to provide what amounts to interim financing on your projects, you are actually driving up the costs of your projects. Thus the importance of prompt payment from owners to contractors cannot be underscored enough.
Given one of the leading causes of disputes and claims on projects not to mention poor performance by the contractors comes about because they are being starved for working capital, project control practitioners, especially those working for owner organizations, need to know and understand this concept if they want to get the best performance from their contractors.
Thus for those companies who are unhappy with the performance of your contractors, it may be worth looking at your payment policies to see if you slow payment is starving your contractors for the very cash flows they need to better executed your projects? Many countries, in recognition of this problem, have implemented “prompt payment” laws which entitle the contractors to charge fairly hefty “late payment penalties” on owners who delay payment.
09.3.3.3.4 Paying (for Owners) and Getting Paid (for Contractors)
As note above and supported by the KPMG and other studies, which are telling us that OWNERS are not happy with contractors and see areas for improvements, research indicates that the CONTRACTORS are doing also failing with alarming frequency. Research sponsored and published by the Surety Information Office (SIO) www.sio.org, National Association of Surety Bond Producers (NASBP) www.nasbp.org and the Surety & Fidelity Association of America (SFAA) www.surety.org in 2014 showed just how RISKY the contracting business is for contractors. Figure 19 indicates the contractor failure rates over a 3 year period between 2011 and 2013 of 20% to 29%. Assuming these numbers are typical, what that means is in any given 3 year period, between 25% to close to 30% of contactors fail. And it is highly likely that these percentages apply not only to the USA but to other countries as well.
The same research identified the root causes or “early warning” signs, many of which project control professionals can help identify and mitigate. The partial list below shows where project controls can and should be able to make a positive impact, falling under three main categories:
1. Poor Estimating and/or Job Cost Reporting:1.1. Revenues and margins decrease over time. 1.2. There are continued operating losses. 1.3. The company has a loss of or reduction in bonding capacity.1.4. Company bids jobs too low. 2. Ineffective Financial Management System: 2.1. Cash flow is tight or there is an inability to forecast cash flow. 2.2. Receivables are turning over too slowly. 2.3. Vendors demand cash on delivery for supplies and materials. 2.4. Bills are past due. 2.5. Company experiences profit fade. 3. Poor Project Management:3.1. Supervision is inadequate. 3.2. There is an inability to administer and collect change orders. 3.3. Projects are not completed on time. 3.4. There is a claim on one or more contracts. 3.5. Company is continually involved in litigation. 3.6. Backlogs increase without adequate project management resources. 3.7. Lead time to prepare bids is too short 
Figure 19 - Why Do Contractors Fail?
Source: Surety & Fidelity Association of America (SFAA)
Given that it was Albert Einstein who told us that “doing the same things over and over again but expecting different results is the definition of insanity”, the Guild has invested thousands of person hours to research and identify “best tested and proven” practices. At the same time, the Guild also recognizes that there are contractors and owners who do not agree with some of the practices being advocated. The question is, whether the rather poor performance recognized by both owners and contractors alike is enough for us to continue doing the same things over and over again or are we willing to at least try the “best tested and proven” practices identified by the Guild in the GPCCAR?
Recognizing that there may be more than one approach that has been “tested and proven to work”, the Guild of Project Controls has implemented a procedure (Include link to update procedure) for those who have differing opinions to share other “Best tested and proven” practices for inclusion into the GPCCAR.
However, at this point, lacking any substantiated alternatives, the evidence clearly points to:
1) The adoption of “Activity Based Costing” (ABC)as the basis to produce the Performance Measurement Baseline (PMB) and;
2) Paying for work off the CPM Schedule (Activity Based Management or ABM) on the grounds it improves contractor performance by enhancing contractor cash flows based on the activities they have completed while at the same time, ensuring that the Owner is not over-paying for work which has not been completed.
As noted in the previous segment on Cash Flow, contractor’s project controls teams, can be assured that your accounting/finance department will be in close contact with you, not only asking about past due amounts of money but asking you to produce cash flow analysis into the future.
Why? Because knowing that contractors historically work on single digit EBIT margins, one of the major challenges of contractor accountants and finance departments is managing cash flows at the corporate or home office level. Which is why this section has been included here because of the concept of “earned value”.
That concept is that the owner paid PROMPTLY for work done correctly. While we spent a lot of time explaining how to measure physical percent complete above, we now have to close that loop by emphasising the importance of the owner paying promptly for the work they received, PROVIDED it met three criteria:
- The work was PHYSICALLY done;
- The deliverables were SUBSTANTIALLY in conformance the technical requirements;
- The contractual “shall” clauses were fulfilled.
If all three conditions were met, then the owner is LEGALLY OBLIGATED to pay the contractor promptly.

Figure 20 - Showing the Underlying Concept of Earned Value Management
Source: Giammalvo, Paul D (2015) Contributed Under Creative Commons License BY SA v 4.0
In Figure 20, we are emphasizing the basic concepts upon which earned value is or was based on, which is that the concept of earned value originated on the factory floors of the 17th and 18th centuries as an INCENTIVE PROGRAM known as “piecework”. This incentive system has proven itself as evidenced by the fact that “piecework” is still in use in most factories today. The only difference between applying “piecework” in a factory setting and applying it in a project setting is instead of paying “by the piece” in project management, we pay “by the activity”. Otherwise, the concept remains just as valid and powerful in a project environment as it does in a factory environment.
As we can see from Figure 20 above, the first important aspect is that the underlying assumption is the buyer or customer knows the fair market value of the goods or services they are purchasing. This should have been done in Module 8, Managing Cost Estimating and Budgeting. Secondly, the buyer does not necessarily have to select the lowest possible price, but the price they perceive as being “Best Value for the Money”. These options were covered in Module 5- Managing Contracts. Next, the buyer or customer does not have to purchase goods or services which are substandard, containing patent defects. They get to test for the quality of the product or services they are purchasing and it is up to the seller (Contractors) to provide sufficient proof that the products, goods or services meet the requirements established by the buyer in the technical specifications. This topic was covered in Module 03-6 Accepting Completed Deliverables. The next step is to measure the physical quantity taken (which we learned the various methods to do this in Module 09-3 - Capturing Progress & Updating the Schedule and then the part which is often missing in most Earned Value textbooks is we pay the seller PROMPTLY for what we as buyers (OWNERS or CUSTOMERS), received. Nothing more, and nothing less. The importance of cash flow management to both the owner and contractor was explained in the previous paragraph.
Given one of the leading causes of disputes and claims on projects not to mention poor performance by the contractors comes about because contractors are being starved for working capital which directly impacts the execution of the work, meaning project control professionals, especially those working for owner organizations, need to know and understand this concept if they want to get the best performance from their contractors.
Thus this section reiterates and emphasises how the contractor can and should link payment requests whenever possible to ACTIVITIES rather than MILESTONES as the milestones tend to be too far apart which in turn hurts their cash flows. For owners, you too benefit by paying off the activities rather than interim milestones as one of the reason for contractors not performing as you would like them to is because they are starved for cash flow.
This is the whole concept underlying Activity Based Management (ABM) which was covered in Module 8 - Managing Cost Estimating and Budgeting.
To recap from Module 05-4 - Tendering & Bidding The Project we have been issued our Notice to Proceed, conditional upon developing and delivering a cost and resource loaded CPM Schedule, a “Schedule of Values” (Unit prices for all major components in the project) and a list of major vendors and sub-contractors (for the purpose of obtaining release of liens when the owner pays the prime contractor).

Figure 21 - Typical Notice To Proceed Containing Submittal Requirements
Source: Construction Specifications Institute’s Manual Of Practice 5th Edition
Lastly, picking up on Module 05-5 Managing the Contract (Owner and Contractor), contractors will start billing and owners will start paying for work completed using Earned Value Management.
The two illustrations below are coming from the American Institute of Architects (AIA) standard forms and show G-702 which is the application for payment from the contractor to the owner. This shows how the contractor uses the schedule as the basis for his/her payment and ties in with the previous discussion on cash flows.
How many of you planners and schedulers get frustrated because you hang your schedules on the wall and then no one bothers to look at them? Here in Module 9 - Managing Project Progress we will begin to explain that by paying off the CPM schedule, not only will you enhance the contractors cash flows for work legitimately completed, providing then with the cash flow necessary to staff the project, but by paying off the CPM Schedule people will actually take the time to LOOK at the schedule posted on the wall rather than ignoring it, as many of them do now.
 Figure 22 - AIA Form G702 Application for Payment
Source: Adapted from AIA Form G702 Application for Payment  Figure 23 - AIA Form G702 Application for Payment
Adapted from AIA Form G702 Application for Payment
As explained in Module 08.4.3.18 Budget, Authorization or Control (GPC Level 3 Cost Estimate, Figures 13 (Assembly Costing) or Figure 14, (Module Costing) an “activity” does not necessarily have to be Level 5 or Level 6, but could be Level 3 or Level 4. This is consistent with the concept of “Rolling Wave Planning” and addresses the concerns of those schedulers with large schedules of >5,000 activities. Using Rolling Wave Planning the number of activities can be reduced by summarizing them with the “rolled up” costs.
09.3.3.4 STATUS AND UPDATE THE SCHEDULE WITH PROGRESS
Building off the example shown above in Figure 7 Sample Field Data Collection Sheet, this is the information which ALSO needs to be captured to UPDATE the CPM schedule.
- Actual Start (AS)- This is when the activity actually started, which can either be earlier or later than the scheduled or planned start (See 4 in Figure 4 Sample Data Collection Sheet above).
- Actual Finish (AF)- This is when the activity actually finished, again, regardless of what the planned or scheduled finish was. As the Actual Finish (AF) – Actual Start (AS) = the Actual Duration (AD), it is important for the project control practitioner to compare the Actual Duration vs the Planned or Original Duration, which will help to identify what activities were either overly optimistic or overly pessimistic in their durations (See 6 in Figure 4 Sample Data Collection Sheet above).
- Remaining Duration (RD)- for Activities which have started but not yet finished, what is the expected remaining duration (RD) to complete this activity? As above, this is important to help the project control practitioner analyse just how reliable, accurate and precise the original durations were, which is useful for forecasting future durations and thus future completion dates (See 7 in Figure 4 Sample Data Collection Sheet above). For more on this, see the “Level of Effort” method described above.
- Physical % Complete (PC)- while the Guild does not want to appear to favour any particular software, as MS Project is so pervasive and because updating Physical % complete is pretty much similar in all the major software packages, MS Project 2013 was used as the example because in MSP 2013 and earlier, the default is NOT “Physical % Complete” but Elapsed Time. What this means is to update Percent Complete in MS Project 201 and earlier, it takes a two-step process.
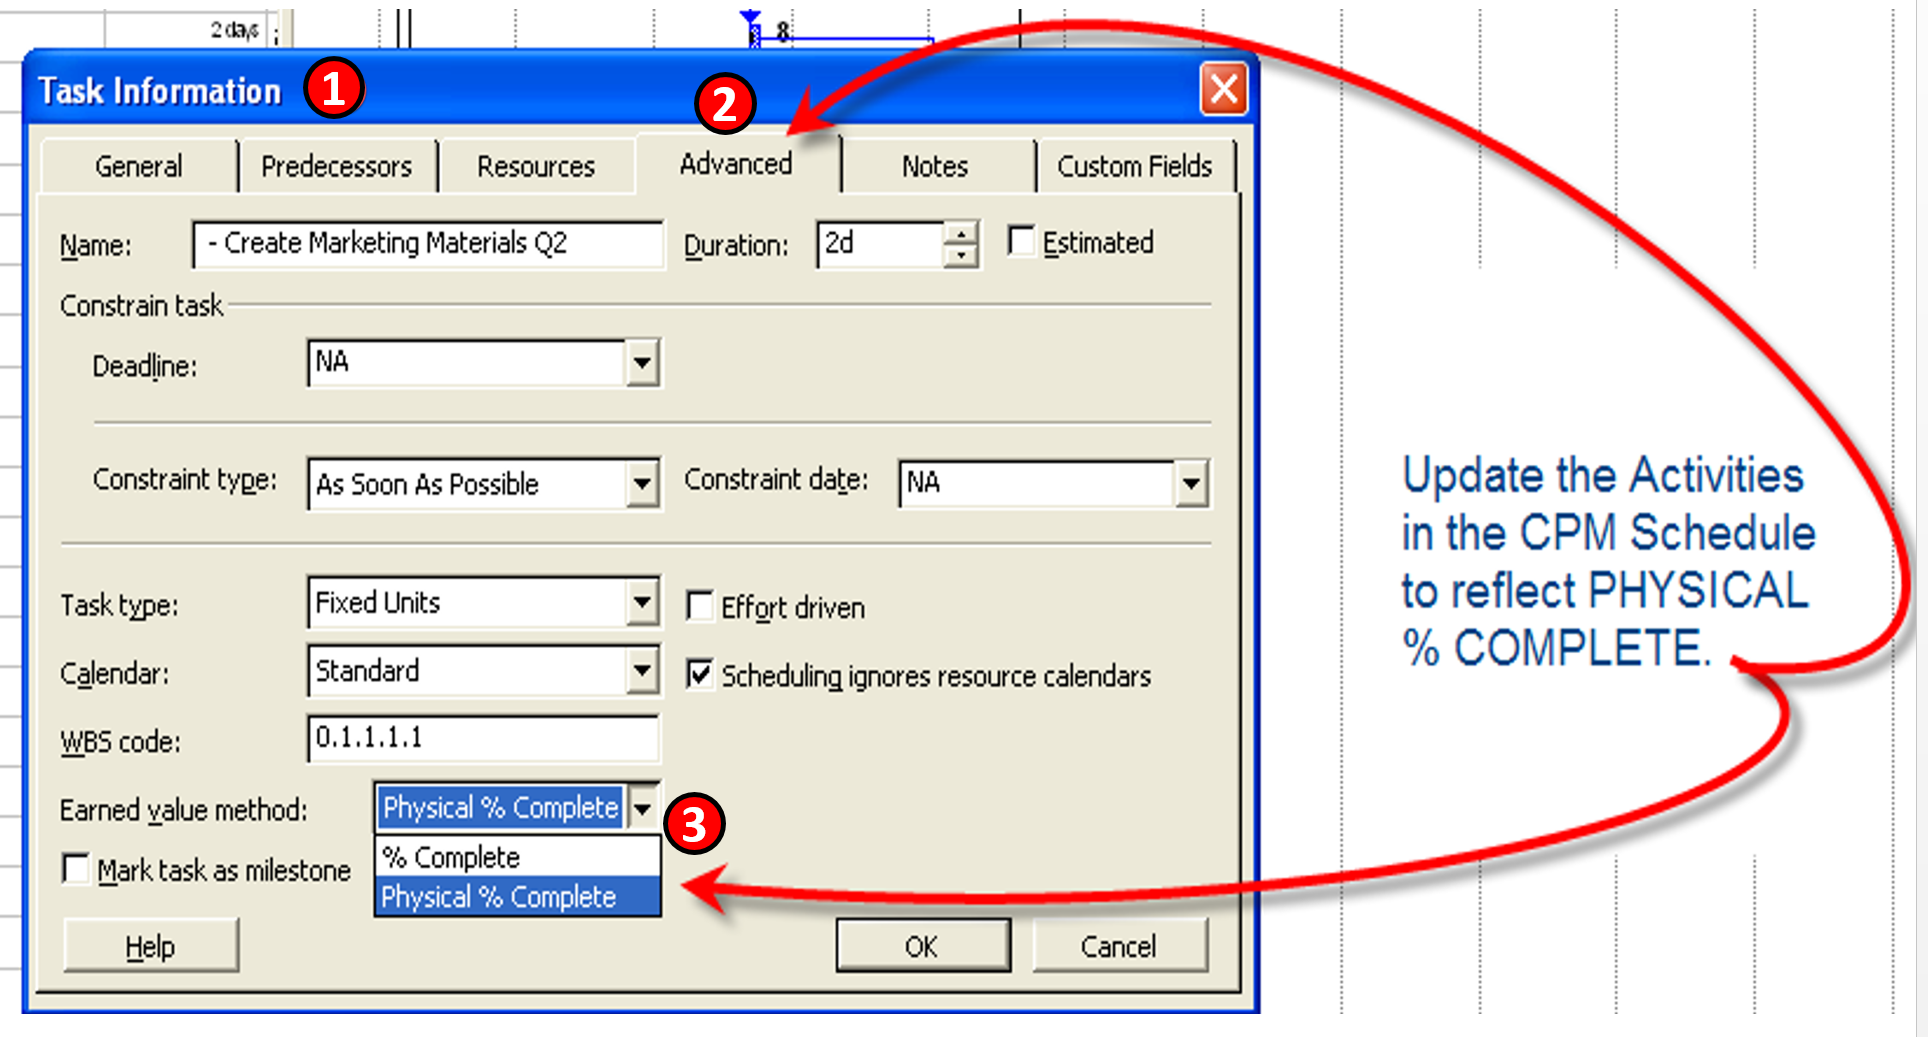
Figure 24 - Showing Where and How to Update Physical Percent Complete
Source: Images adapted from MS Project 2010
- Select the activity you want to update and click on “Task Information”
- Click on the “Advanced” tab
- CHANGE the default “% Complete” which is based on ELAPSED TIME (i.e. if the activity is 10 days long and 5 days has elapsed, then the software assumes the activity is 50% complete) to PHYSICAL % Complete.
 Figure 25 - Showing Where and How to Update Task Information and Percent Complete
Source: Giammalvo, Paul D (2015) Course Materials Contributed Under Creative Commons License BY v 4.0 The second step in this process is to:
- Stay in “Task Information” but get out of the “Advanced” tab
- Click on “General” tab and
- Fill in the appropriate % Physical Percent Complete as measured by the most appropriate method identified above
For other software packages, please be sure to check your User’s Manual to ensure you understand exactly how to do it. As can be seen in the example below, the default settings may or may not be based on Physical % Complete, meaning you have to check.
- Problems- This is another important piece of information the project controller needs to know about as this is a powerful piece of information upon which to identify risks that were not previously identified (unknown-unknowns) or to quantify and validate the impact of risks which were identified and contingency put in to address them. (Known-Unknowns). By comparing the actual duration vs the original duration (or the budgeted cost vs the actual cost) it becomes possible to assess whether the time and or cost contingency was sufficient (See 8 in Figure 4 Sample Data Collection Sheet above).
In addition to the data above which best comes from the front line people working in the field, there is additional data which the project control professional needs to capture and incorporate coming from other sources:
- Actual Cost of Work Performed (ACWP or AC) - This information normally comes from Accounting or Finance and historically, there is a time lag which causes ACWP data to always be behind physical progress in the field. We cover this in the next section on how to address and remedy this problem.
In addition to data collection there are a series of quality control checks that need to be conducted each and every time the schedule is updated. These are the last three processes from Module 7- Managing Planning and Scheduling:
- Module 7.7- Validating the Critical Path & Project Completion Dates - In particular, we need to make certain that there are no open ends or hangars and that we correct any “out of sequence progress”- that is, activities which were planned using finish to start logic but based on the actual start dates, were actually executed Start to Start with a lag. If discovered, these need to be fixed otherwise it impacts how earned value is calculated.
- Module 7.8- Validating Horizontal and Vertical Integration - As with the initial creation of the schedule, each and every time it is updated, we need to run a quality check to make certain that it “rolls up” and “rolls down” before we communicate any updates to our clients and stakeholders.
- Module 7.9 Conducting a Schedule Risk Analysis - As activities and work packages are completed, risks associated with those activities or work packages will have become irrelevant. What this means is we have to look at the contingencies (both time and money) and determine whether to hold any remaining contingency in reserve or adjust the remaining duration and/or cost budgets appropriately (up or down) or do we turn the time and cost contingency back to the project sponsors? Figure XX Case Study Showing how to use SPI and CPI. Provides us with a real life example of why we need to reiterate the Schedule Risk Analysis Process each time we do an update.
09.3.4 OUTPUTS
Best Practices Checklist: Capturing Progress and Updating the Schedule: (Adapted from GAO “Best Practices in Scheduling”)
- Schedule progress is recorded periodically and the schedule has been updated recently. Schedule status is updated with actual and remaining progress.
- Schedule status is based on progress records for the current time period; they include pertinent activity information such as name, unique ID, original and remaining durations, planned and actual start and finish dates, and float.
- The status date (or data date) denoting the date of the latest update to the schedule is recorded.
- At least one in-progress activity is critical.
- No activities precede the status date without actual start or finish dates and actual effort up to the status date. No activities beyond the status date have actual start or finish dates or actual effort.
- Activities that are behind schedule by the status date have a remaining duration estimate and the delay’s effect has been assessed.
- - If the delay is significant, plans to recover the implied schedule slip have been evaluated and implemented, if so decided.
- - Resources are reviewed and may be reassigned, depending on schedule progress.
- When possible, LOE activities are linked to the physical percentage complete of the work they support.
- When possible, actual work progress is tracked rather than simply updating durations.
- Responsibility for changing or statusing the schedule is assigned to someone who has the proper training and experience in CPM scheduling.
- Changes that were made to the schedule during the update have been documented.
- New activities are reviewed for completeness of predecessor and successor logic, resource assignments, and effects on the critical path and float calculations.
- Activities that have started or completed out of sequence have been addressed using either retained logic or progress override to reflect the order in which the activities were actually carried out.
- Management reviews schedule updates and verifies and assesses effects on the plan. Significant variances between planned and actual performance, as well as actual and planned logic, are documented and understood.
- The schedule structure is examined after each update to ensure that logic is not missing or broken, all date constraints are necessary, and no artifacts impede the ability of the schedule to dynamically forecast dates.
- The current schedule, once management approves it, is assigned a version number and archived.
- A schedule narrative accompanies each status update and includes
- - the status of key milestone dates, including the program finish date; o the status of key hand-offs or giver/receiver dates;
- - explanations for any changes in key dates;
- - changes in network logic, including lags, date constraints, and relationship logic and their effect on the schedule;
- - a description of the critical paths, near-critical paths, and longest paths along with a comparison to the previous period’s paths; and
- - any significant scheduling software options that have changed between update periods, such as the criticality threshold for total float; progress override versus retained logic; or whether resource assignments progress with duration.
- Problems The Field Is Having Which Is Causing Delays Have Been Identified For Action By The Project Controls Department.
- Accepted Work To Be Billed By Contractors Based On Physical % Complete
- Positive Cash Flow For Contractors
09.3.5 REFERENCES & TEMPLATES
- Maloni, Farid (2009) Earned Value and Shariah Law Line Item #29
- Giammalvo, Paul D. (2013) How Private Sector Contractors Use Earned Value
- Wibiksana, Ridwan (2013) Underground Mining Operations
- Viewpoint Construction Software (2015) “Smart Mobility Drives Project Accuracy, Productivity — and Profits”
09.4 - Module 09-4 - Assessing and Interpreting Progress Data
09.5 - Module 09-5 - Project Performance Forecasting
GPCCAR M09-3, Revision 1.04