4.0 - MANAGING RISK & OPPORTUNITY
04.1 - Module 04-1 - Introduction to Managing Risk & Opportunity
04.2 - Module 04-2 - Develop Risk & Opportunity Policies & Procedures Manual
04.3 - Module 04-3 - Identify Risks / Opportunities
04.4 - Module 04-4 - Assess, Prioritize and Quantify Risks / Opportunities
04.5 - Module 04-5 - Risk / Opportunity Response Strategies and Tactics
04.6 RISK / OPPORTUNITY MONITORING AND CONTROL
04.6.1 - INTRODUCTION
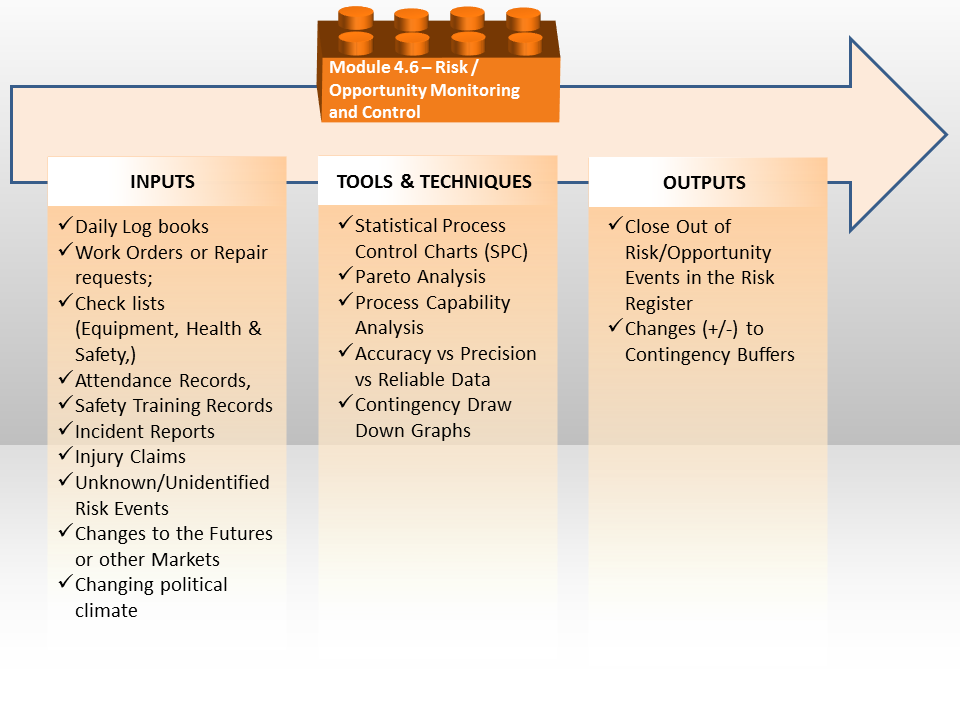
Figure 1 - The Risk/Opportunity Monitoring and Controlling Process Map
Source: Guild of Project Controls
Introduction- Updating the Project Risk Register should be one of the standard agenda items for each phase gate review process from the owner’s perspective, and once the project has reached Phase 5, Execution, then it should also be on the agenda for every progress update meeting, with the level of detail being determined by how frequently the meetings are scheduled to be held.
Explained another way, for the on-site construction meetings which are normally held weekly, the detailed constructability, safety, health and environmental risks would be discussed while a high level management meeting may only be held quarterly.
Implicit in this is the risk reporting would be done by the relevant risk owner, in the context of the risks or opportunities of each of their specific category of stakeholder and showing a level of detail appropriate for that stakeholder to make informed decisions:
(1) Business Risks/Opportunities (Phase 1 DSP)
(2) Technical Risks/Opportunities (Phase 2 DSP)
(3) Procurement Risks/Opportunities (Phase 3 DSP)
(4) Constructability Risks/Opportunities (Phase 4 DSP)
(5) Execution Risks/Opportunities (primarily Safety, Health and Environmental, but also including productivity, weather etc)
Obviously enough, while the owner would be focused on the risks or opportunities associated with all the Phases, the Design>Bid>Build contractors would be mostly focused on Constructability and Execution risks or if the contract was Design-Build or EPCC, then they would be focused on Technical, Procurement, Constructability as well as Execution risks/opportunities along with the owner.
Worth noting is that BOTH the owner and contractor would be focused on their own individual business risks and opportunities, understanding that what is a risk for the owner (i.e missing a WBS or Work Package (Scope) element) may well be an opportunity for the contractor to exploit. Likewise, owners will often put in place late delivery penalty clauses as a way to MITIGATE of offset the risk of the project being delivered late.
Because project management is PROCESS based, the same tools and techniques to measure and assess manufacturing processes are suitable and appropriate to measure and assess the project management processes. This includes the same standard set of quality tools and techniques such as “Six Sigma Quality” or “Total Quality Management” but adapted for use in measuring and assessing risk or opportunity and not only quality.
Risk Monitoring and Control nothing more than tracking on a day to day or at least weekly basis what is happening on a project in the context of what is happening externally to the project (i.e. weather, politics, financial markets, cost trends, growing labor disputes etc) Basically anything which can or might disrupt the project OR which can be exploited to help the project.
This is why it is so important to a project manager/project team to have a project control or PMO available whose responsibility it is to be able to step back and look at the project objectively and not only to identify the risks/opportunities but put in place the appropriate tools/techniques to measure and assess whether or not the decisions made in terms of either risks or opportunities are actually realizing the objectives and results that were intended.
- To reiterate what has been explained previously, the Guild of Project Controls does not advocate or encourage conducting separate risk meetings. Risk (as we already do in safety) is and should be an agenda discussion item on EVERY single meeting, whether it is a Decision Support Package meeting, a Planning/Scheduling Development meeting or Progress Update Meeting at all levels, down to the field workers. (i.e. “Toolbox Meetings”)
History has shown that when we separate risk and treat as a stand-alone process, we find that we may do one or two risk meetings and then forget about the risk until something goes wrong. By integrating risk and giving it the same importance as we do time and cost and quality, we are less likely to end up with unpleasant surprises.
Explained another way, we need to treat ALL risk categories with the same seriousness and focus that we do for SAFETY, which is just one of many of the faces of “risk”.
Towards that end, the Guild has included the discussions and considerations of risk and EMBEDDED the risk assessment and management processes in the relevant Modules:
- Risk Meeting and Agenda Items in Module 01 - Managing Project Controls (Asset and Project Decision Support Package Meetings) and Module 02 - Managing People (Communications and Stakeholder Management)
- Schedule Risk assessment as agenda items in Module 07 - Managing Planning & Scheduling
- Cost Risk assessment as agenda items in Module 08 - Managing Cost Estimating & Budgeting
- Progress Risk assessment as agenda items in Module 09 - Managing Project Progress
04.6.2 - INPUTS
- DAILY LOG BOOKS
- WORK ORDERS OR REPAIR REQUESTS;
- CHECK LISTS (EQUIPMENT, HEALTH & SAFETY,)
- ATTENDANCE RECORDS,
- SAFETY TRAINING RECORDS
- INCIDENT REPORTS
- INJURY CLAIMS
- UNKNOWN/UNIDENTIFIED RISK EVENTS
- CHANGES TO THE FUTURES OR OTHER MARKETS
- CHANGING POLITICAL CLIMATE
04.6.3 - TOOLS & TECHNIQUES
The tools and techniques most closely associated with monitoring and controlling the effectiveness of both risk and opportunity come to us from the world of quality control, more specifically, those tools/techniques associated with 3 and 6 Sigma quality.
04.6.3.01 - Statistical Process Control Charts (SPC)
Statistical Process Control Charts are a powerful quality management took which project control practitioner need to know and understand as this tool can or should be applied to our work. Explained simply, a statistical process control chart (SPC) is a snapshot of a process is performing at any given point in time. Both Walter Shewhart and Edward Deming were a big advocates for the use of SPC and their research told us that any process has natural variability within +/- 3 sigma and that any reading which falls outside of the +/- 3 sigma (+3 sigma is called the Upper Control Limit or UCL and the-3 sigma is called the Lower Control Limit or LCL) is not caused by the process itself but by external or special causes. Whenever we have a reading in our data which falls outside the upper or lower control limits we do NOT include this in our analysis. But what project control practitioners should be looking for are patterns which tell us the process itself may be out of control.
This process can be used by either contractors or owners as we are monitoring and controlling on-going work flow processes.
As we know from using Statistical Process Control Charts that any process has normal variation of +/- 3 sigma or 3 standard deviations and any data points which fall outside of +/- 3 sigma are not a normal part of the process but are caused by forces outside of the normal distribution. These are called special or identifiable causes. Looking to our Business Dictionary definition we find that a “special cause” is a Quality control term for that cause of variation which is not an inherent part of a process, but arises out of intermittent, unpredictable, and unstable factors. These extraordinary causes are indicated by data points that fall outside of the limits of a control chart. Also called assignable cause. See also common cause.
Applying this to our cost and productivity data, we need to plot our cost and productivity data, then throw out those readings which fall outside +/- 3 sigma. Failing to do that will result in our data having a high variation. High variation will result in our cost or productivity data being UNRELIABLE as only a few outliers can dramatically skew the values. Thus we need to eliminate them from inclusion in our database.
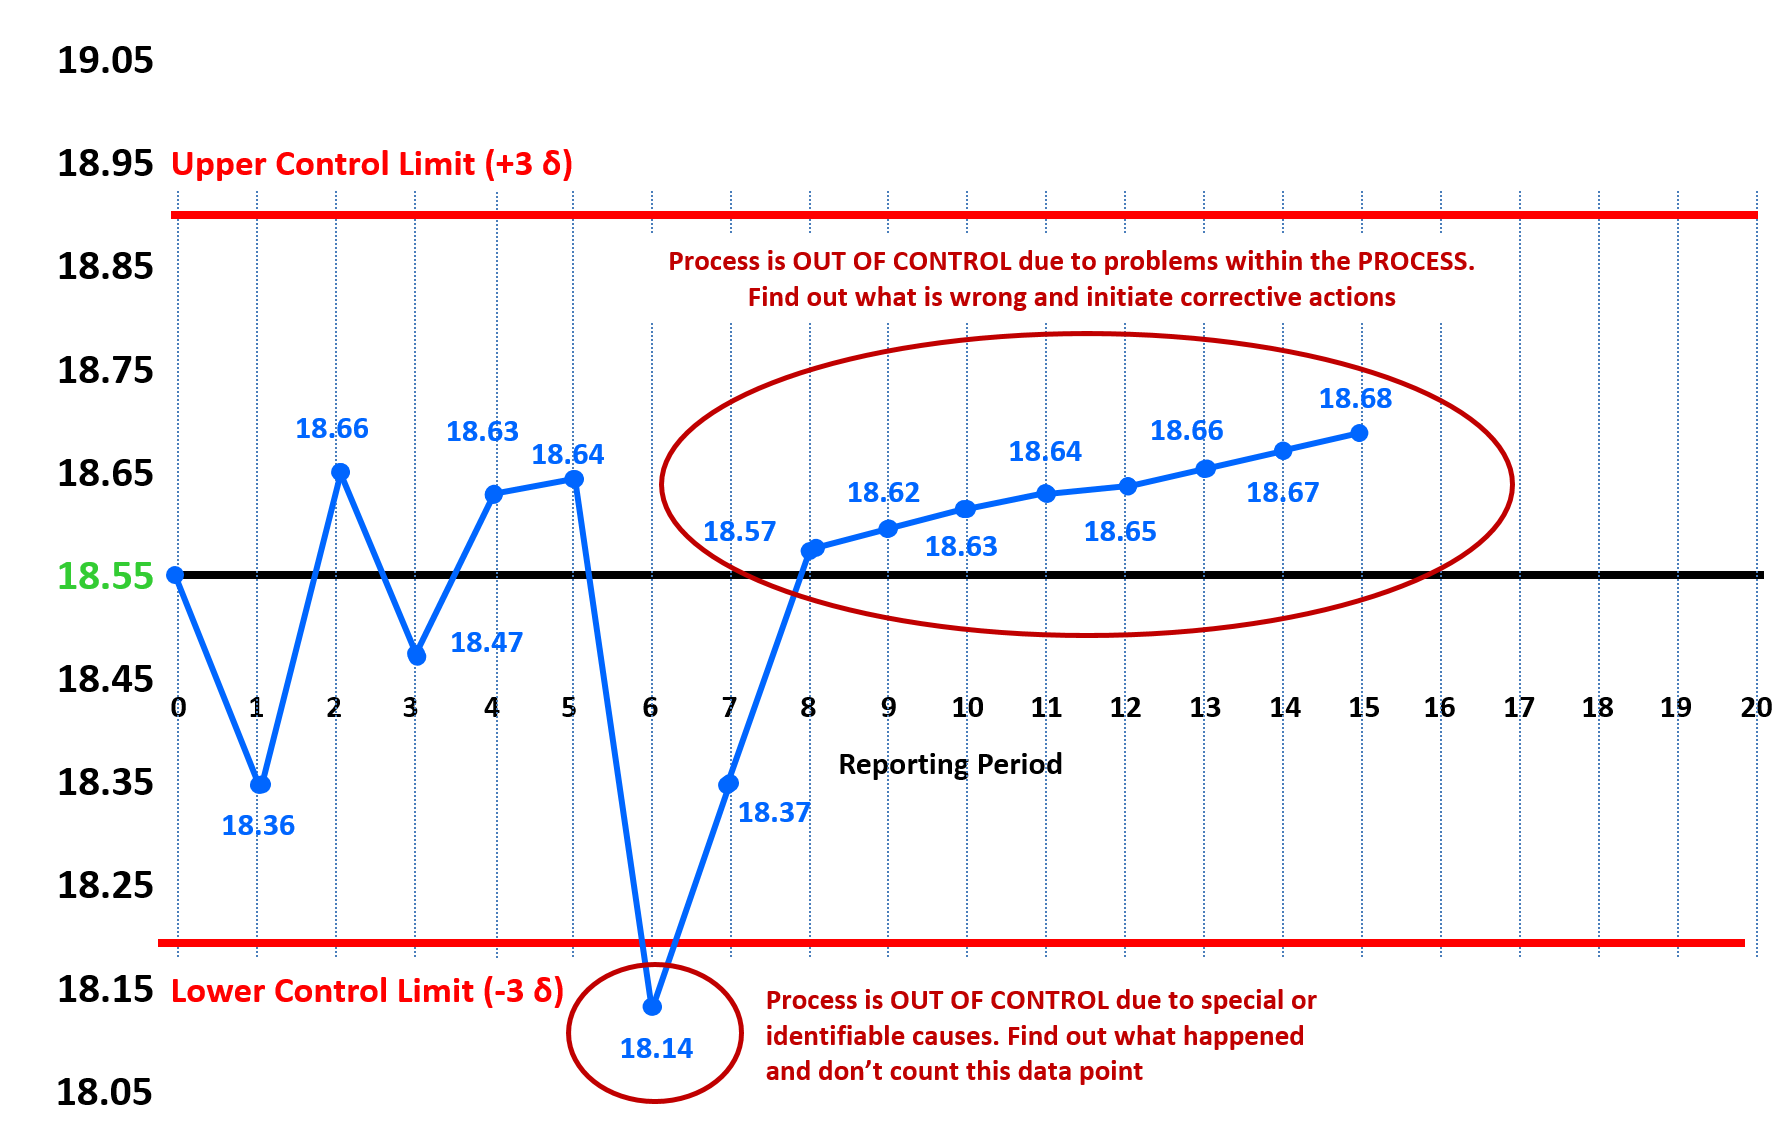
Figure 2 - Using Statistical Process Control Charts
Source: Giammalvo, Paul D (2015) Course Materials. Contributed Under Creative Commons License BY v 4.0
Taking the mean productivity from our example above of 18.55 cubic yards per crew day we track the actual productivity per report period and plot it on the appropriate SPC Chart. As we can see while the MEAN or AVERAGE is 18.55 CY per day, the RANGE of “normal” productivity can run from a low of about 18.20 CY per crew day to a high of 18.90 CY per crew day.
We found out that during the reporting period of 5-6, the productivity dropped below the lower control limit. This an indication of a “special” or “identifiable” cause. We spoke with the foreman and he explained that during that entire week, the temperature was above 42 degrees Celsius and it was simply too hot for the crew to be at their maximum productivity. As soon as the heat wave broke, their productivity started to improve. Whenever you have an OUTLIER which falls outside either the upper or lower control limit you do NOT COUNT THAT IN THE DATA BASE. You throw that data point out.
By report period 8, we are back up to near normal productivity but now you start to see a pattern developing. We see the productivity INCREASING every week but whenever you see any patterns developing it means that something MAY be wrong with the process itself. There are many references which show you how to interpret the different patterns you may find but for the purposes of your exam what see shown is known as the “run of 7” (sometimes you also see “run of 6”) What it means is any 6 or 7 consecutive points above the mean, below the mean or ascending or descending, are an indication that the process is out of control due to changes in the process itself. In this case, the project controls team went out to the site and found out the crew was taking shortcuts in the procedure, and while it had a positive impact on the productivity, the changes they made in the process were potentially dangerous and could lead to quality problems with the end product.
Keep in mind that statistical process control (SPC) analysis can be applied to any of the cost or schedule data illustrated above in our ideal database.
Below are some examples of how the performance data can be used by project control professionals to analyze and report on any repetitive process, such as SPI or CPI. In the examples below, we can see 4 common “rules of thumb” that indicate that there are problems with the process and that further analysis is necessary on the part of the project control practitioner along with the appropriate members of the project team.
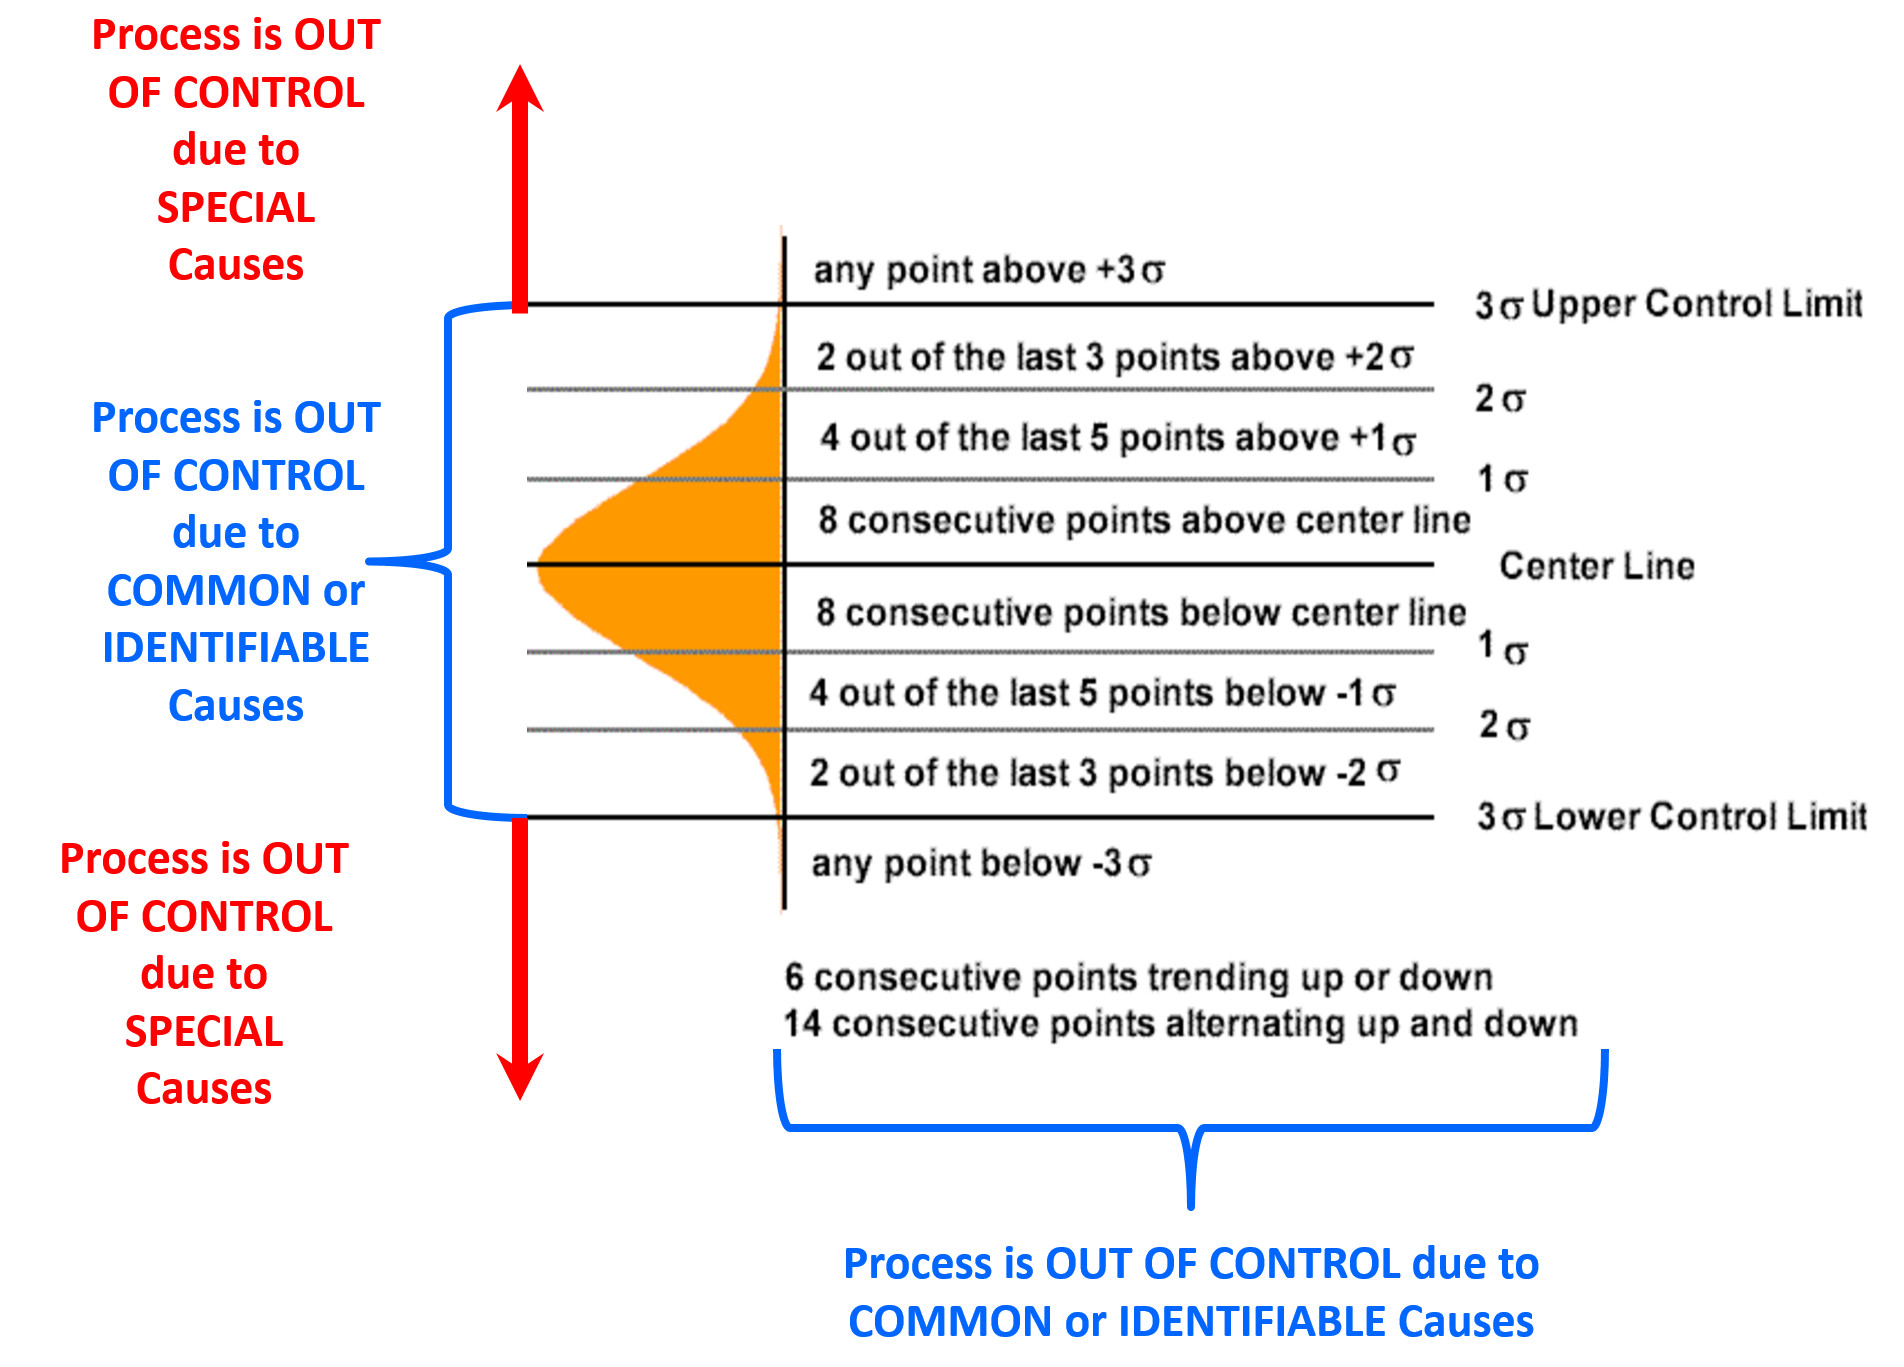
Figure 3 - Examples of how to read and interpret the data from statistical process control charts
Source: Adapted from CQENet (n.d.)
Statistical process control charts are a very powerful tool for contractors to use as well, for any operation which is repetitive and is done using the same or similar crews and/or processes. Welding would be the classic example but the use of SPC can be applied to concreting operations, masonry, trenching or any other operation which occurs frequently enough to generate meaningful cost or productivity data.
As the topic of statistical process controls is far too large to include in this Body of Knowledge below are 4 recommended references which the Guild of Project Controls urges all those intending to sit for any of the certifications. For the Yellow Belt level, you need to know the terminology, the concepts and the formulas and for the Green, Orange and Red belt levels you need to be proficient at being able demonstrate you know how to create these charts, use them and interpret the results for typical project control applications:
- Statistical Process Control (SPC) (n.d.) More Steam
- Berardinell, Carl (n.d) A Guide to Statistical Process Control Charts
- Bauman, Chris ; De Heck, Jennifer; Leonard, Evan; Miranda, Merrick (2009) University of Michigan Chemical Process and Controls Open Text Book
Common data sets that project control professionals would be likely to use SPC or other “Six Sigma” quality tools to analyze are SPI and CPI, productivity, unit costs, number of rejects (particularly useful for welding) or any other data which is generated by an on-going or repetitive process. In Figure 4 below, we can see how the range estimate data coming from the DoE’s Cost Estimating Guide Figure 4.1 on page 14 but the concept can and should be applied to durations, productivity or any other value that project control practitioners need in order to analyse, assess and evaluate project data generated from the project management processes and use that data as the basis to make recommendations to the project team or key stakeholders to improve the processes. (“Continuous Process Improvement” which we covered in Module 1 - Managing Project Controls where we showed how Agyris & Schon’s “Double Loop Learning” can help us improve the work flow processes, and in doing so, reduce the risk of cost or time over-runs.)
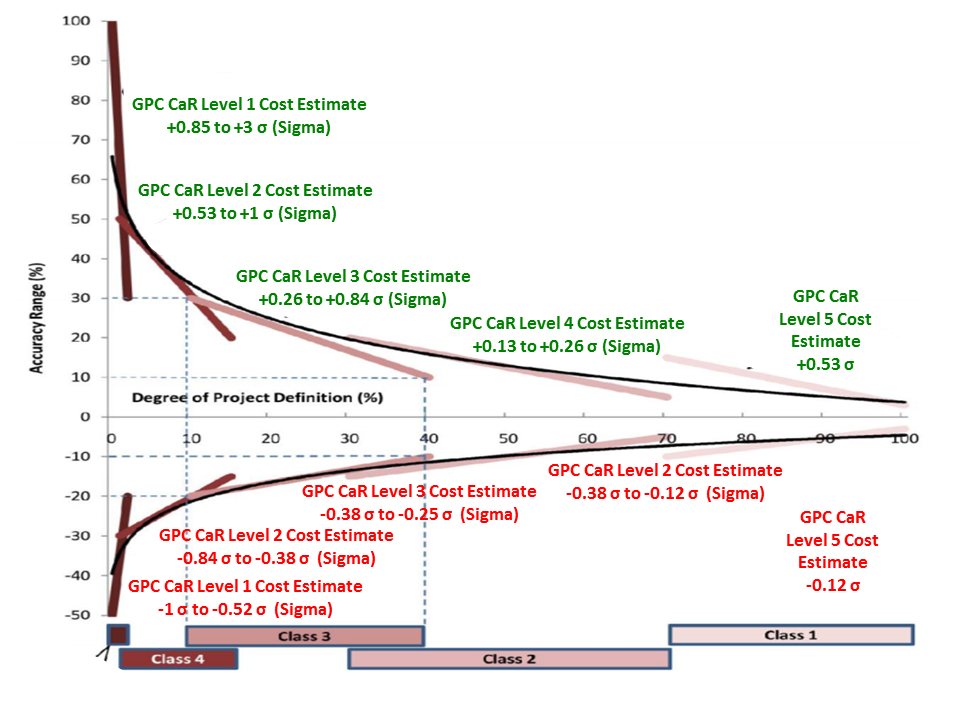
Figure 4 - Range Cost Estimate Data Converted from Percentages to Standard Deviations
Source: Adapted from DoE Cost Estimating Guidelines
In the example above, we can see how the OWNER would use statistical analysis (3 or 6 Sigma which is the same formula as we use for PERT calculations) to analyse the evolution of costs over the 5 project life span phases.
04.6.3.02 - Pareto Analysis
Another powerful and useful tool/technique for both the owner’s and contractor’s professional project control practitioner to master is how to use Pareto Charts. Pareto’s Law tells us that “80% of the problems come from 20% of the potential causes” or explained more simply, a Pareto Analysis enables the project control practitioner to identify the “significant few” from the “insignificant many” and use that information to prioritize which problems should be addressed. While this tool/technique is useful for all project control professionals to know and understand, it is especially useful for planners/schedulers.
Applied in the context of risk/opportunity monitoring and control, once a risk or opportunity decision has been made and either a strategic or tactical risk intervention has been initiated, there needs to be some way to track and measure whether that intervention did or did not achieve the intended or desired results.
Once the interventions have been in place, the project controller needs to go back and conduct a follow on assessment to see if in fact the interventions worked.
Below is an example of a “Before and After” Pareto Analysis as a typical example of the kind of risk or opportunity analysis a project control professional is likely to create.
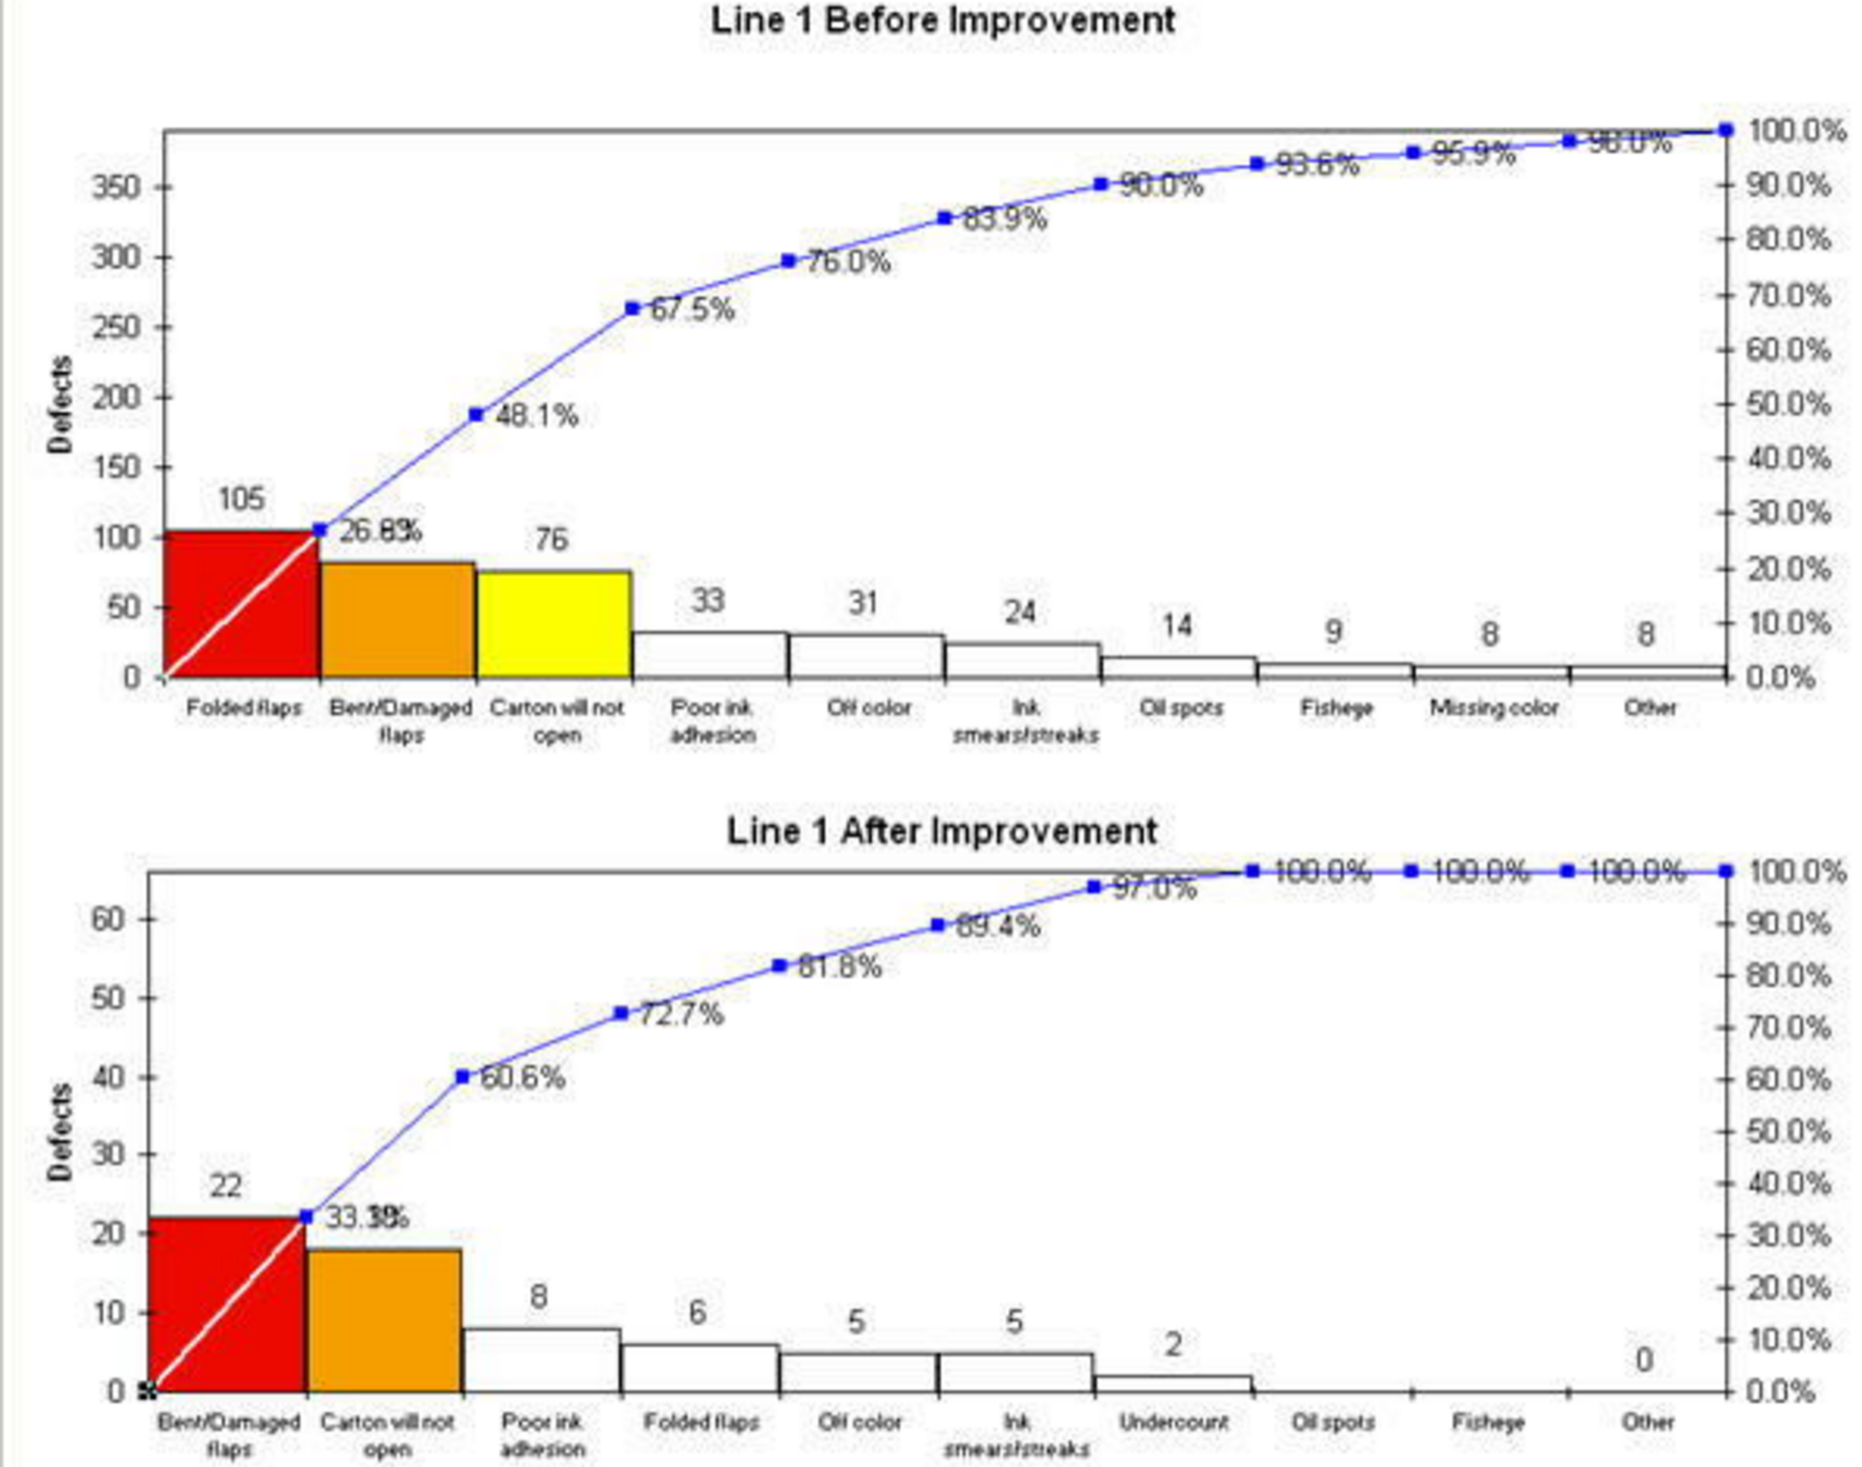
Figure 5 - Illustrating Pareto Charts- Before and After Analysis
Source: Knowware International (2016)
In the example above we can see that whether owner or contractor, risks or opportunities were identified, the risks or opportunities were rank ordered based on the frequency of occurrence and then “corrective action” or “interventions” were made to the process. Then a “before” and “after” analysis was performed to see if the interventions or corrective actions actually solve the problem or did it make things worse?
Explained another way did our strategic or tactical risk response strategies actually work or did they make the situation worse?
For an example from construction, Pareto Analysis is often applied to analyse why welds are being rejected.
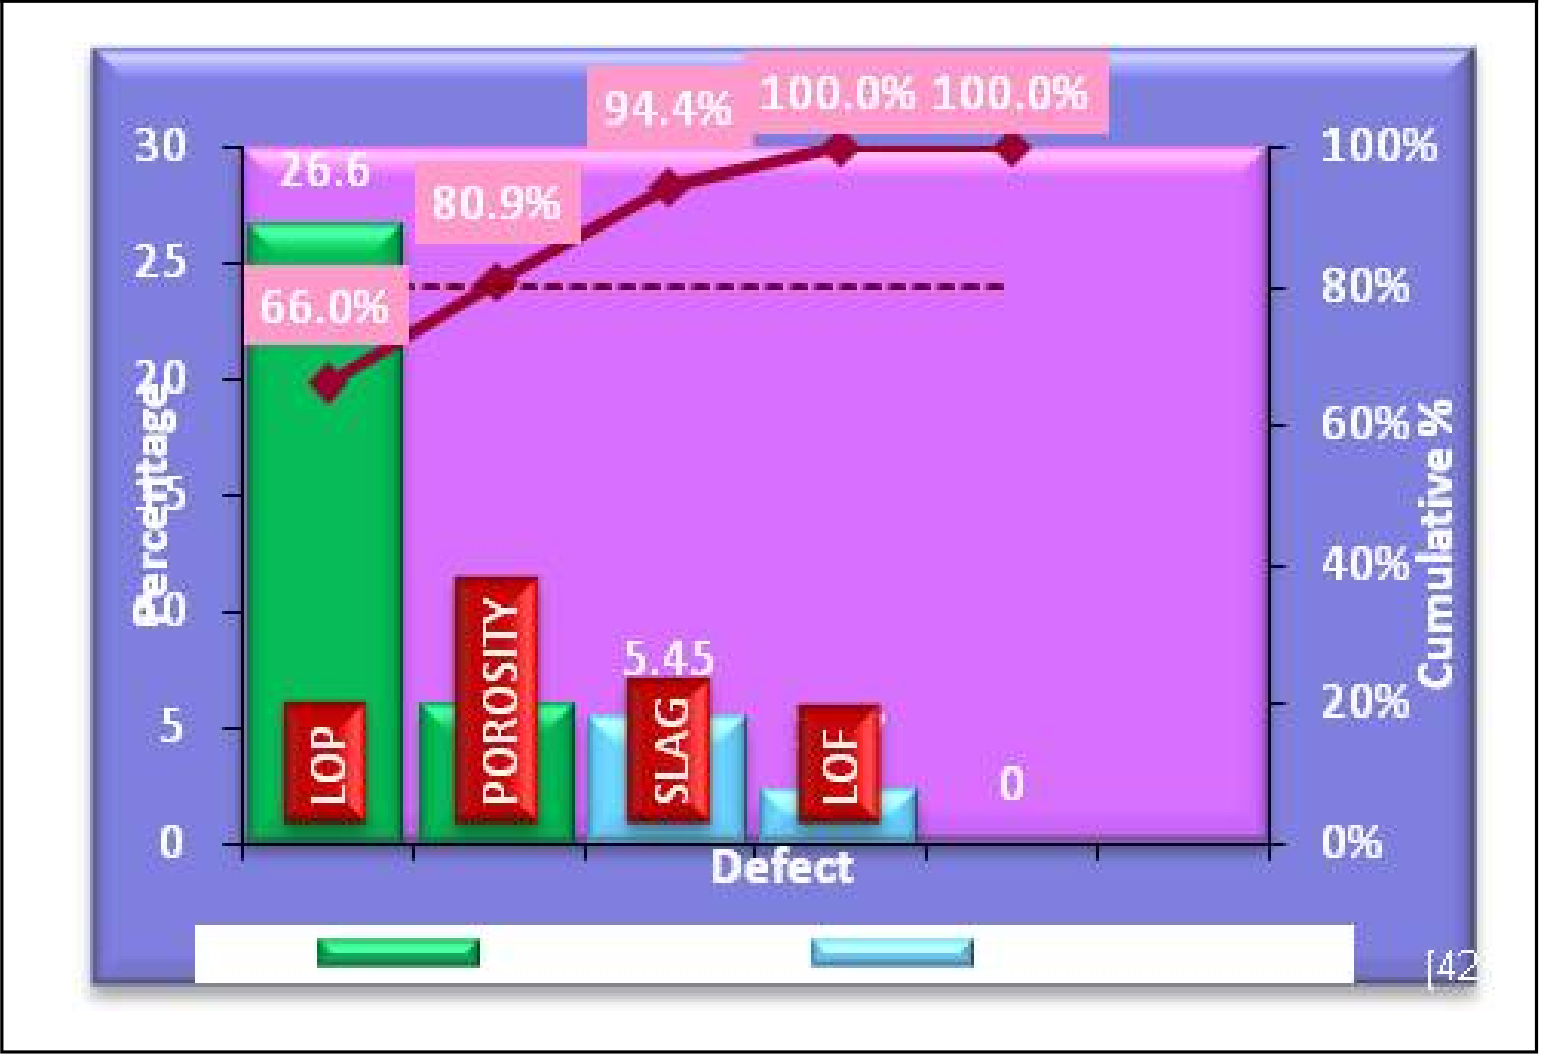
Figure 6 - Pareto Analysis
Source: Shashank Soni, Ravindra Mohan, Lokesh Bajpai and S K Katare (2013) “Reduction of Welding Defects using six Sigma Techniques” International Journal of Mechanical Engineering and Robotics Vol. 2, No. 3, July 2013)
In Figure 6 above we can see how the majority of the welds (66%) were rejected because of LOP (Lay Out Problems) while another 14.9% were the results of porosity of the welds. ( Shashank Soni, Ravindra Mohan, Lokesh Bajpai and S K Katare (2013) “REDUCTION OF WELDING DEFECTS USING SIX SIGMA TECHNIQUES” International Journal of Mechanical Engineering and Robotics Vol. 2, No. 3, July 2013)
For contractors this is a perfect tool to use to measure and assess the causes of PUNCHLIST ITEMS, which is a RISK event that has the potential risk to delay the final payment as well as an OPPORTUNITY, for if the contractor establishes a track record of promptly correcting punchlist items, then this may represent the opportunity to request release of retention. This will example will also help both owners and contractors find out which crews or subcontractors are not doing a good job and helps them identify which causes need to be prioritized.
As this topic is too broad to include everything written on it, the Guild of Project Controls has selected what we believe to be the best supplemental references. For the practitioner these references have been selected to help you implement the use of this tool/technique as part of your work responsibilities.
- Pareto Principle Explained (n.d.) http://www.businessballs.com/pareto-principle-80-20-rule.htm
- QIMacros (n.d.) http://www.qimacros.com/pareto-chart-excel/pareto-chart-compare-multipl…
- Creating a Pareto Chart in Excel http://www.excel-easy.com/examples/pareto-chart.html
04.6.3.03 - Process Capability Analysis
Because so much of project management is process driven, another tool/technique project controller and especially planners/schedulers, needs to know and understand in the context of risk and opportunity monitoring and control, whether owner or contractor, is PROCESS CAPABILITY.
Essentially, in process capability analysis we take the statistical process control charts we created earlier and then OVERLAY the technical requirements (specifications) and what we find in all too many cases is that the process we are using is either not capable of producing the quality specified or is not optimized to produce the quality at the best cost. By having a process which is not optimized results in what is known as “gold plating”- a process which produces products which exceed the specifications but result in a more costly product, thus providing the end user with features which they neither need nor want. A perfect example of this are the many software programs available. How many features do you really use in MS Project or Primavera?
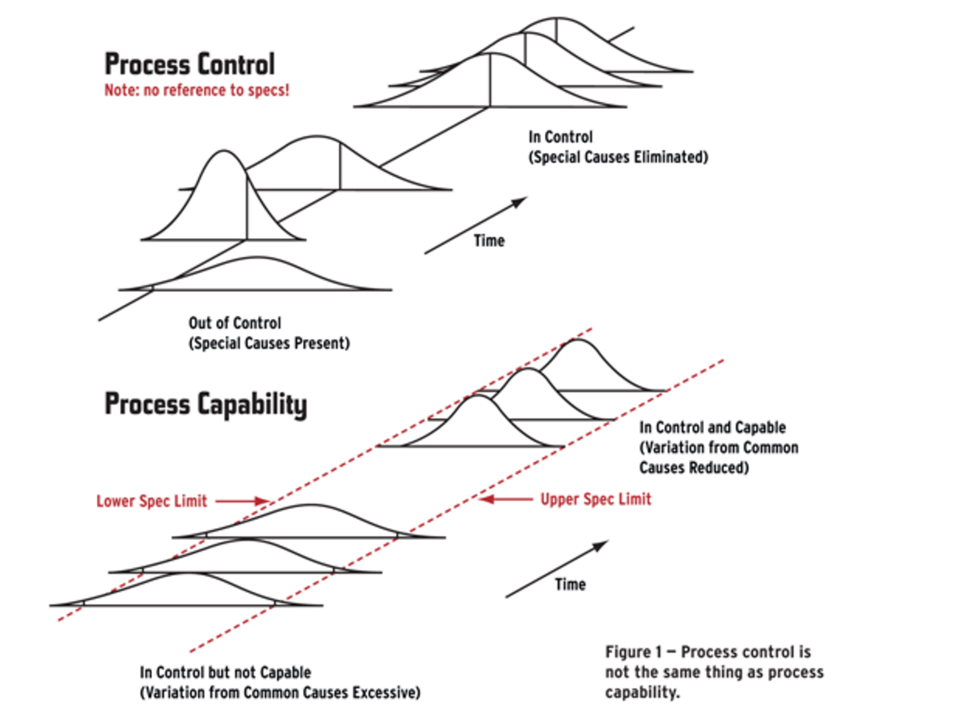
Figure 7 - Process Control & Capability
Source: Neubauer, Dean (2011)
In the example above (Figure 7), we can see that looking at process control alone can tell us whether a process is in control but CANNOT tell us if the process is capable of meeting the technical specifications. In order to assess this, we have to take the technical specifications and overlay them on the process control chart and when we do that, we often find that while the process is in control, that it is not capable of delivering a product or end result which is optimized to exactly meet the technical specifications.
This is the essence of process re-engineering and while our colleagues in manufacturing have been using this for many years, those of us in construction have not been as proactive as we could or should have in adapting these concepts to the world of project management. As this is recognized as a “best tested and proven” tool/technique, it is expected that the professional project control practitioner master this skill and practice and incorporate it into his/her analysis. As this topic is too broad to cover in this GPCCAR, supplemental references have been provided to help you prepare for your chosen exams as well as become more competent practitioners.
As an example of how process capability is used as both a risk and opportunity assessment tool:
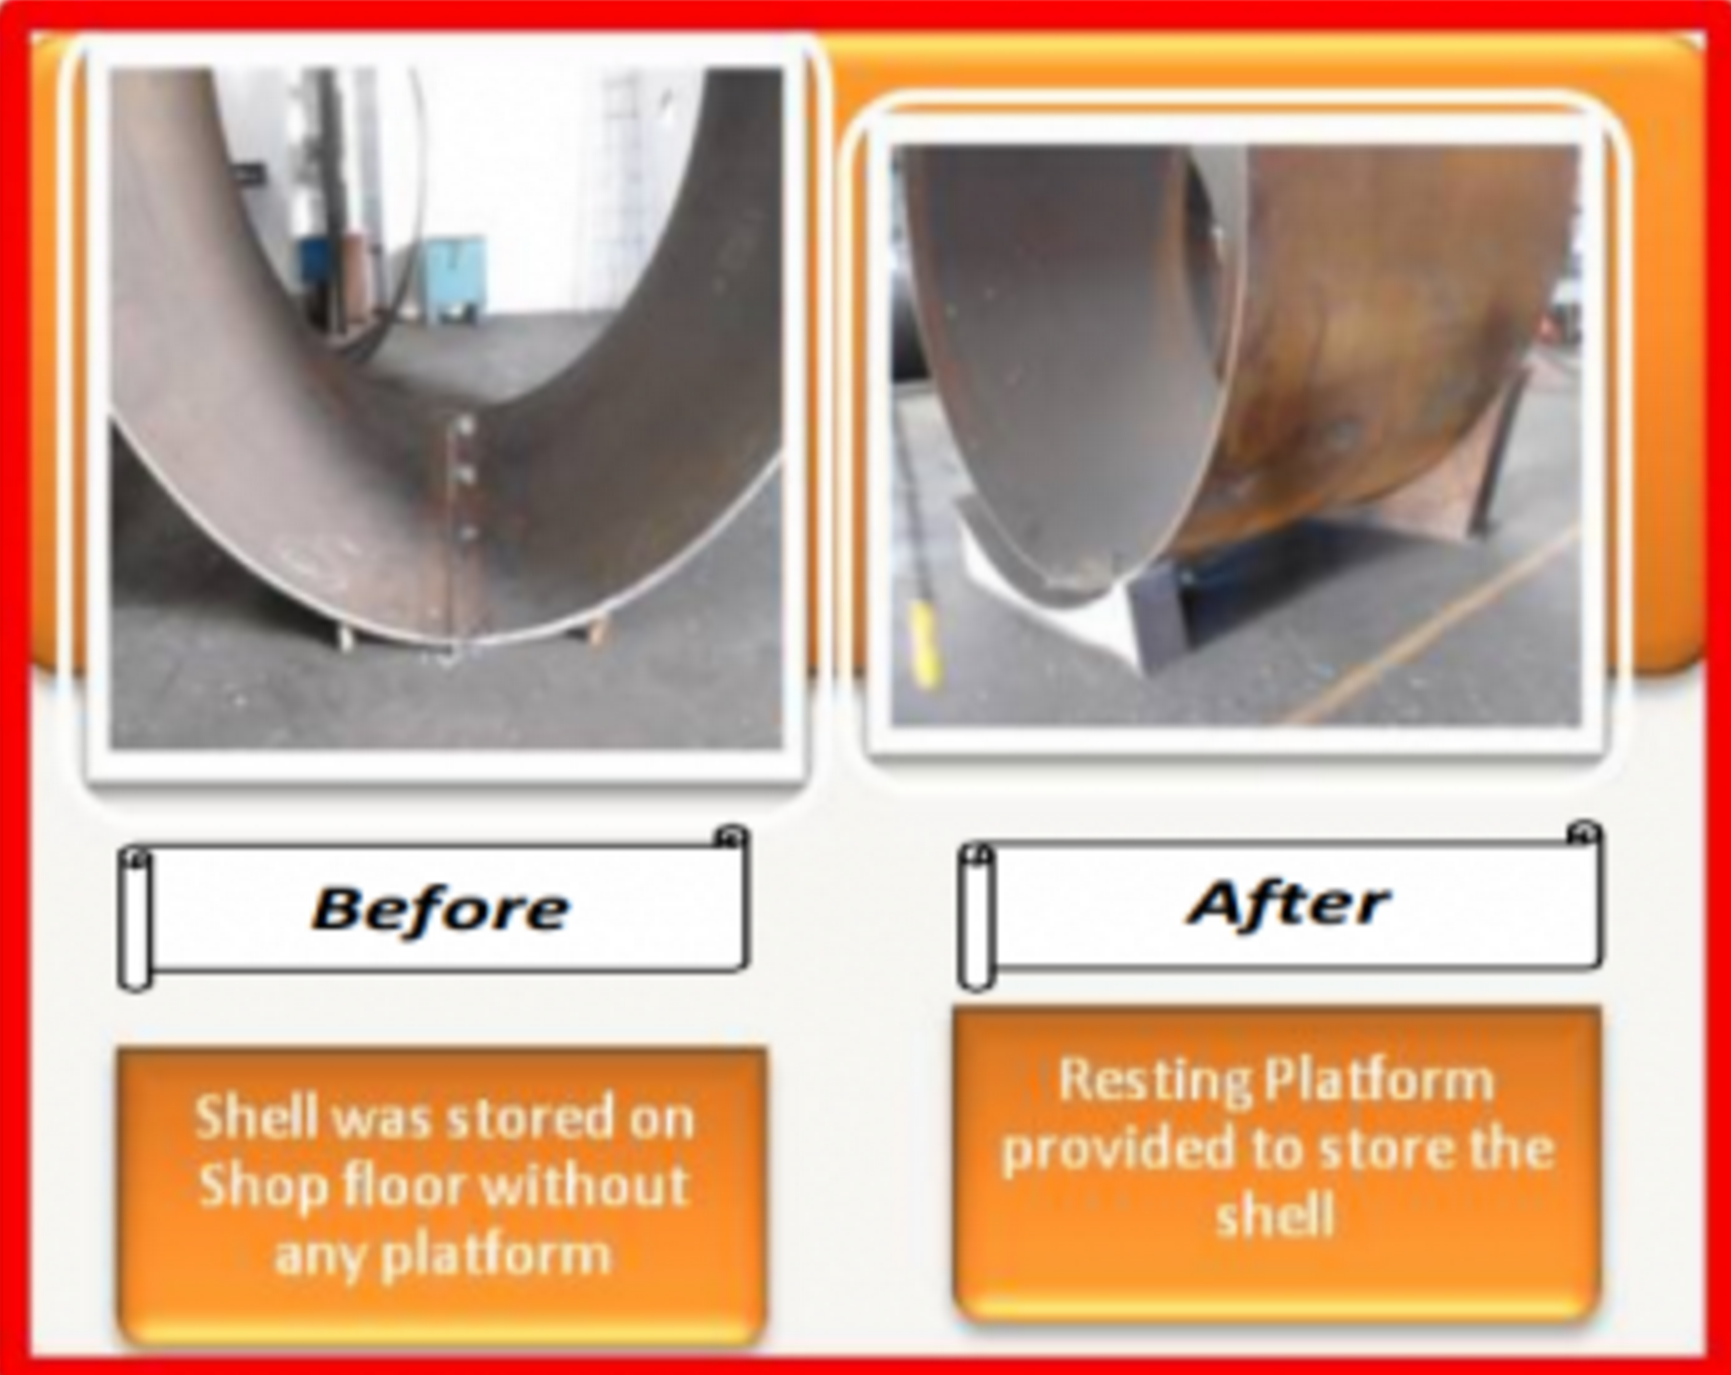
Figure 8 - Example of Process Capability in Welding
Source: Shashank Soni, Ravindra Mohan, Lokesh Bajpai and S K Katare (2013) “Reduction of Welding Defects using six Sigma Techniques” International Journal of Mechanical Engineering and Robotics Vol. 2, No. 3, July 2013)
The Figure 8 above shows an example of a welding process which was producing distortion (out of round) in the finished product.
Clearly the process being used (“before”) was not capable of producing an end product which conformed to the technical specifications. After applying the process capability processes common to 3 and 6 sigma quality control a resting platform was used (process improvement) which resulted in the finished product conforming to the technical requirements prior to the joint being welded.
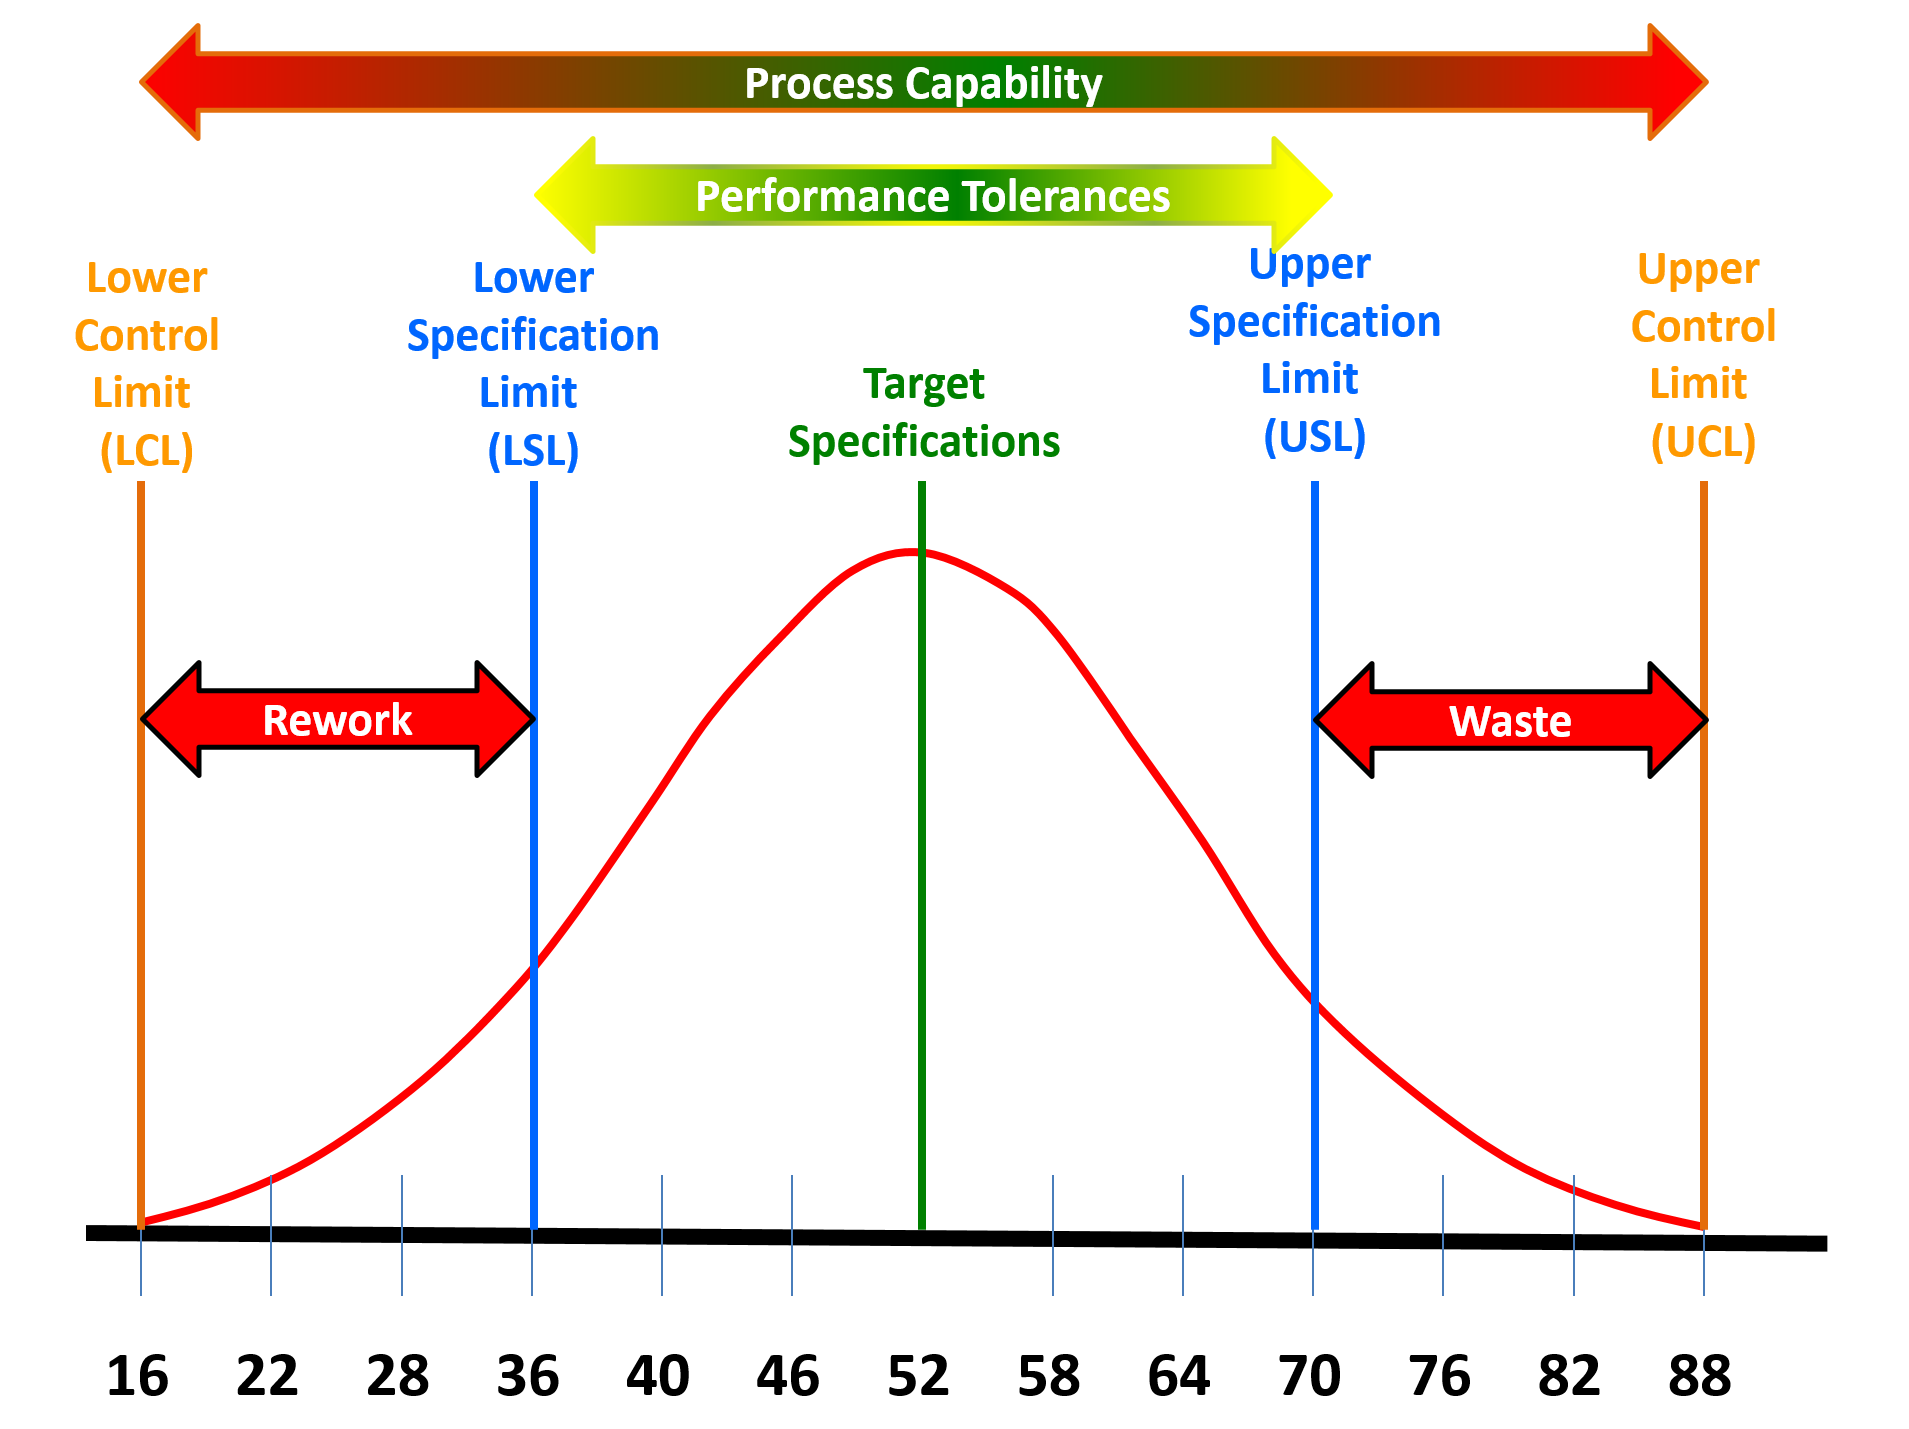
Figure 9 - Applying Process Capability on Repetitive Processes
Source: Source: Shashank Soni, Ravindra Mohan, Lokesh Bajpai and S K Katare (2013) “Reduction of Welding Defects using six Sigma Techniques” International Journal of Mechanical Engineering and Robotics Vol. 2, No. 3, July 2013)
These tools and techniques can be applied to any repetitive process (Figure 9 above)
To help clarify why comparing the process capabilities against the technical requirements, we can see even if the process is in control, if it is unable to consistently produce deliverables which conform to the technical specifications, then there will either be waste or rework on those deliverables which do not meet the minimum specifications and on the cost side of the equation, deliverables which exceed the upper specifications are providing the end user with MORE than they need or wanted and this “added features” is known as “gold plating”- giving the customer more than they need or want, understanding it costs the vendor or contractor more to provide these added features.
An example of where we, as project control professionals would use process capability analysis is for any repetetive process such as welding or excavation. For welding in cold climates, the pieces to be welded need to be warmed
- Arthur, Jay (2010) Supplemental References for Process Capability Analysis SPC Simplified - Capability Analysis with Histograms, Cp and Cpk (2010) https://www.youtube.com/watch?v=5H46qs64eFs
- MIT OpenCourseware (2008) http://www.slideshare.net/Sixsigmacentral/16660-16853-esd62j-introducti…
- Neubauer, Dean (2011) Understanding Process Capability ASTM http://www.astm.org/SNEWS/MJ_2011/datapoints_mj11.html
- Process Improvement (n.d.) Purdue University- http://www.stat.purdue.edu/~jdobbin/stat301T/admin/ProcessCapabilitySpr…
- What is Process Capability? http://www.itl.nist.gov/div898/handbook/pmc/section1/pmc16.htm
- QIMacros (n.d.) http://www.qimacros.com/process-capability-analysis/cp-cpk-template/
04.6.3.04 - Accuracy vs Precision vs Reliable Data
Another analysis we can use to measure or assess both risk and opportunity are charts we can develop which enables us to measure, visualize and explain Precision, Accuracy and Reliability of our data sets.
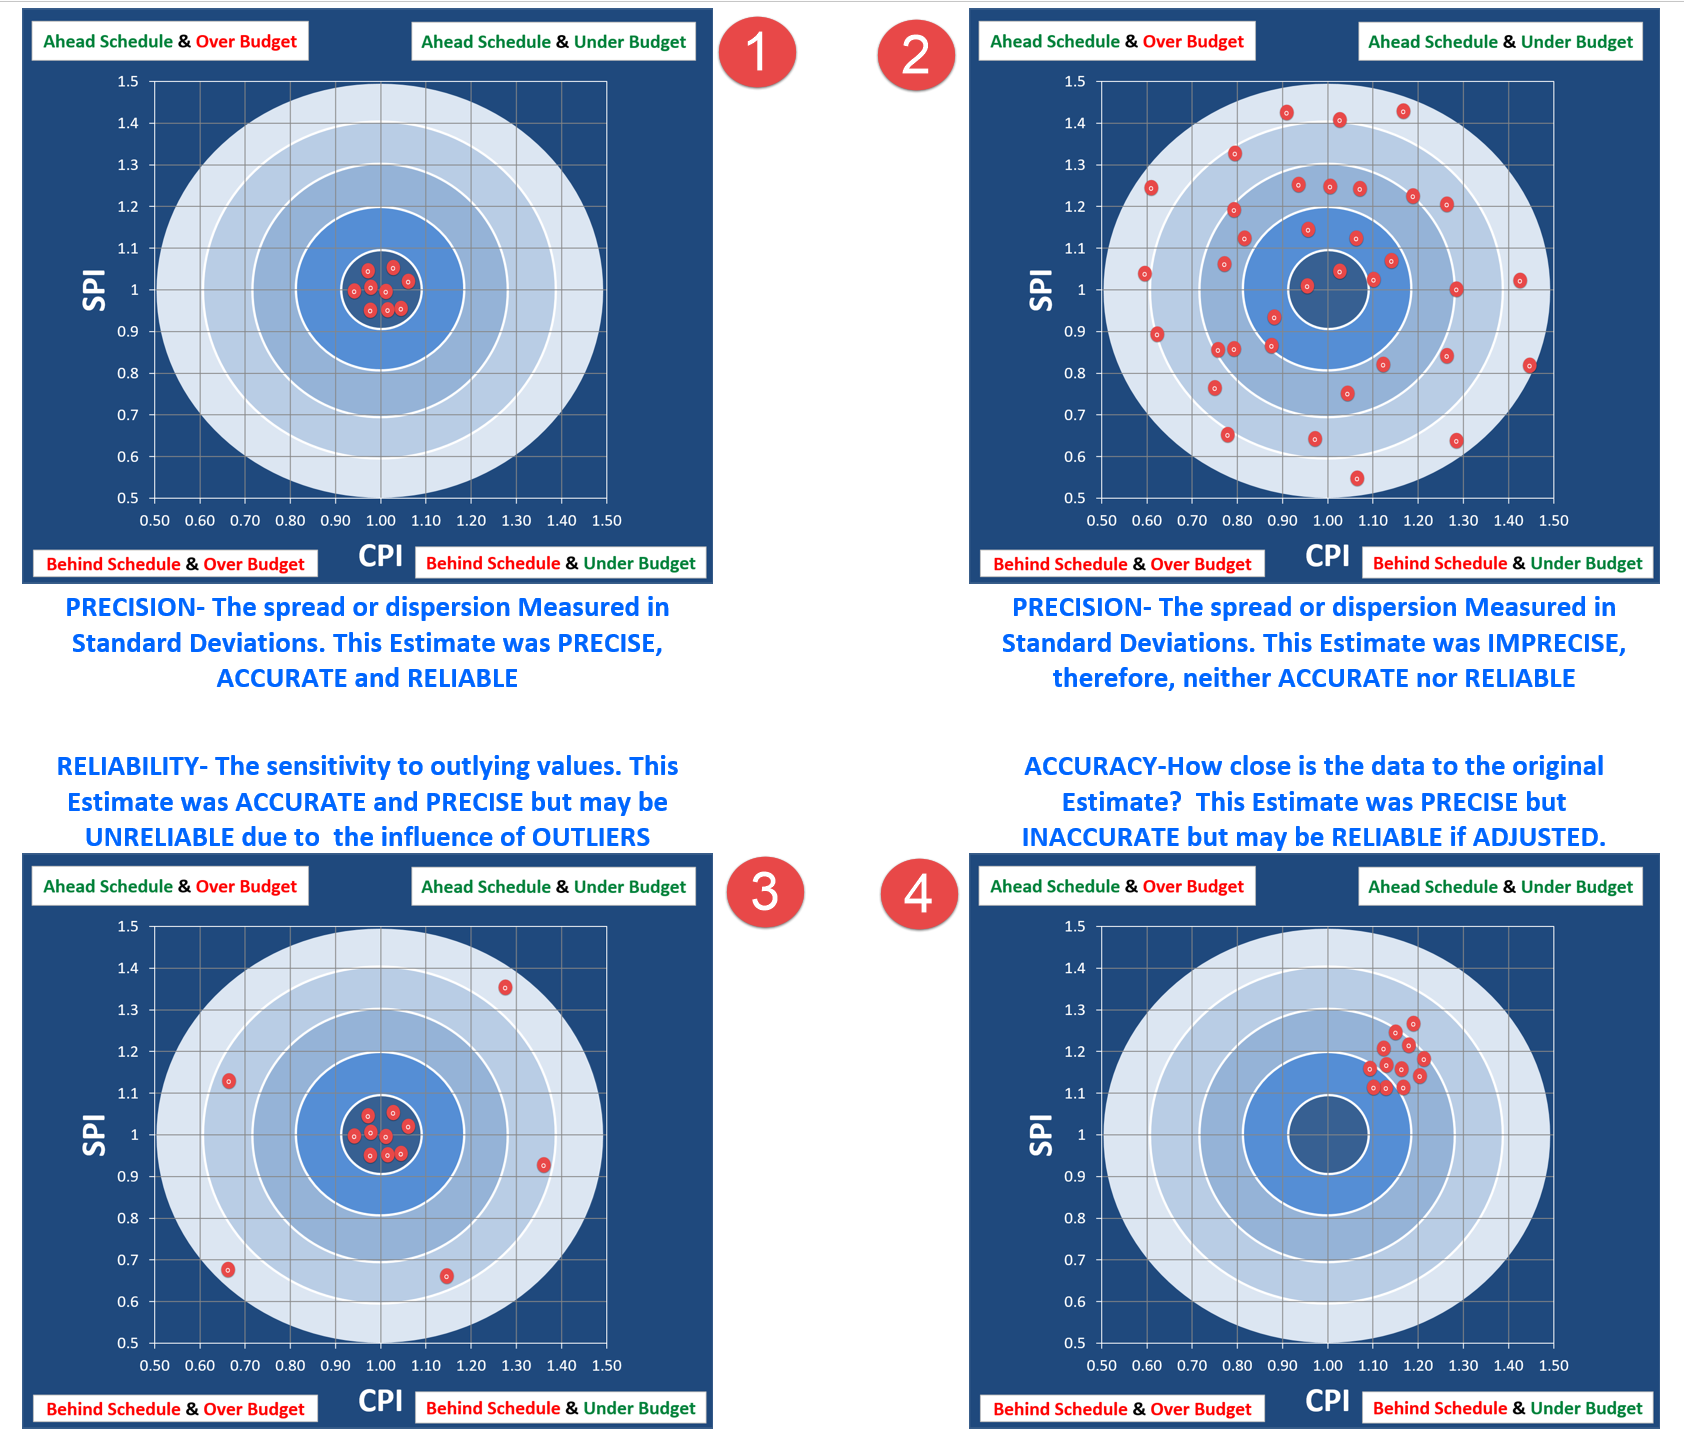
Figure 10 - Precision, Accuracy and Reliability Illustrated
Source: Giammalvo, Paul D (2015) Course Materials. Contributed Under Creative Commons License BY v 4.0
Like the use of Statistical Process Control Charts this analysis could be applied to any of the productivity or cost data from the database examples above.
04.6.3.05 - Contingency Draw Down Graphs
The final risk management tool we need to introduce is the Contingency Drawdown Chart. As with the previous tools/techniques, this is one that both owners and contractors are likely to be using, even though the owner’s time and money contingency may be very different from the contractors.
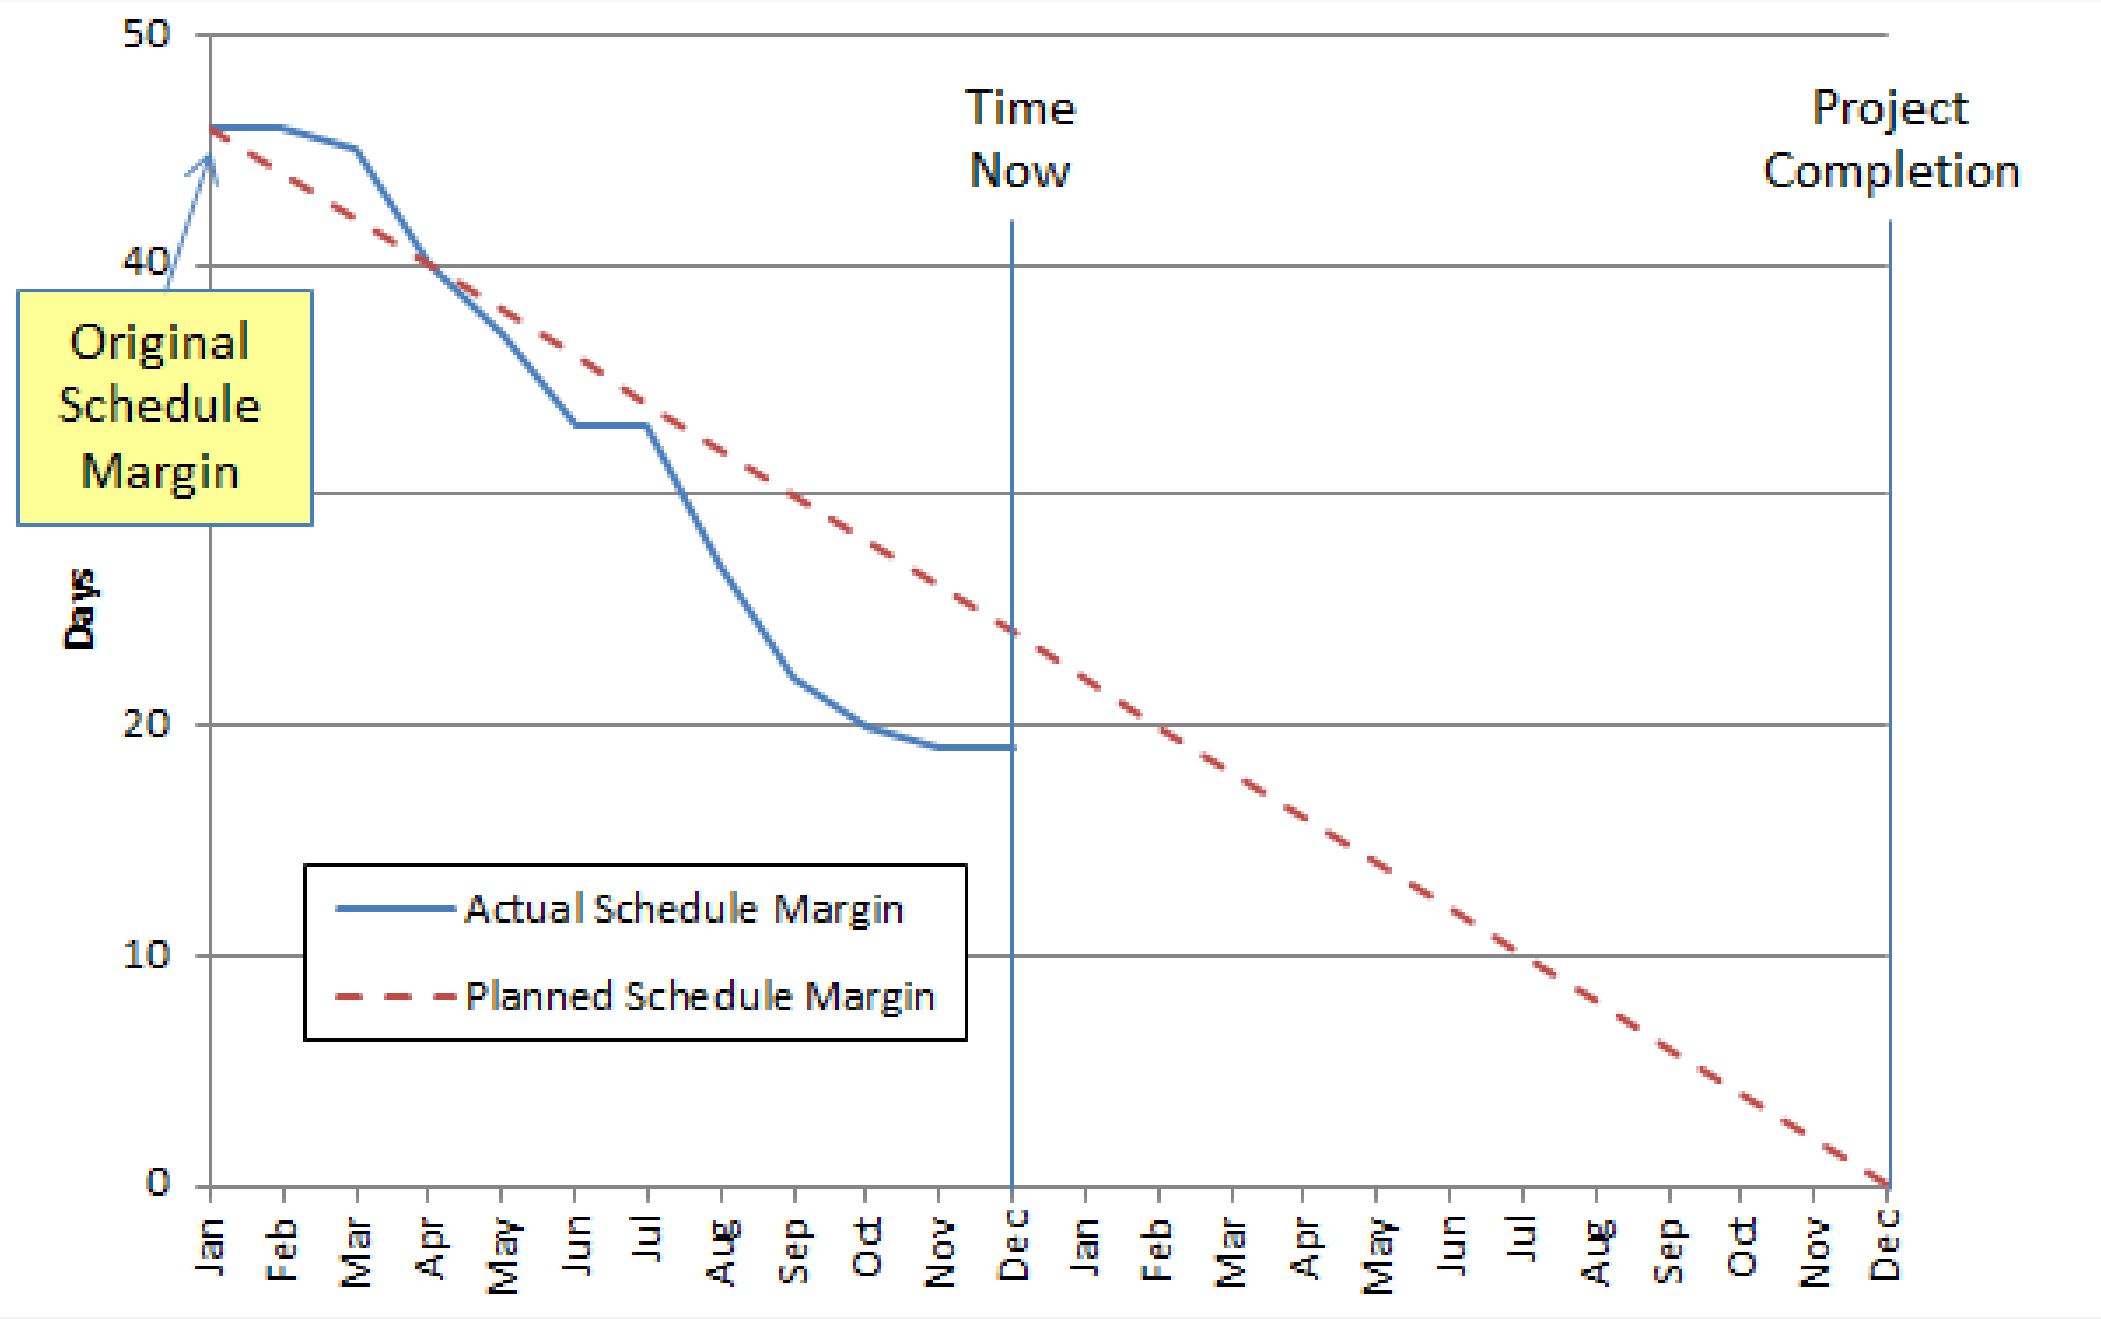
Figure 11 - Schedule Margin Burn Down
Source: NDIA’s Guide to Managing Programs Using Predictive Measures (2014)
From Figure 11 above, we can see a scheduling example where the total contingency or margin (the difference between the P50 value and whatever P level management has accepted) is summed at the start of the project and then as the project is executed, the actual use (draw down) of that contingency or margin is measured and reported.
As we can see, any actual readings to the left of the planned (dashed) line mean we are consuming contingency at a lower rate than planned while any readings to the right of the dashed line mean we are consuming contingency faster than planned.
While the example shown is for schedules, the same calculation and report can be used for costs as well. (Reference NDIA (2013) Guide to Managing Programs Using Predictive Measures.
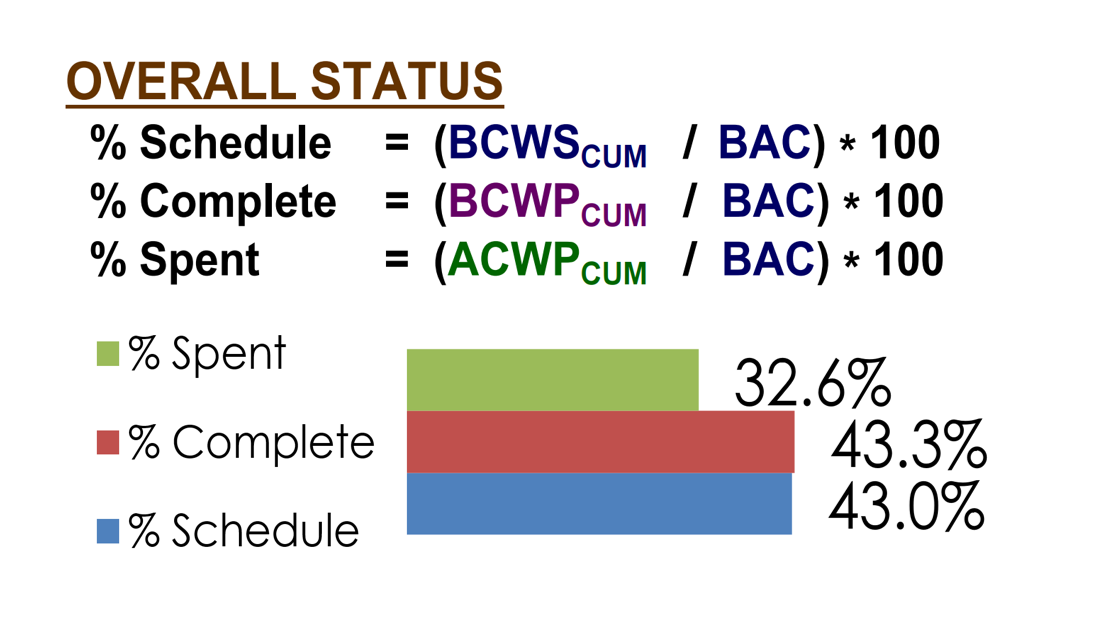
Figure 12 - Comparrison of Elapsed time vs. Percentage of Money Expended
Source: DAU Gold Card (2015)
Figure 12 is the simplest form of “Drawdown” Charts seen on many dashboards to compare the % of Elapsed Time vs the % of Money Expended vs the Physical Amount of Work Completed.
As the data date or time now line is shown by the vertical pink line, we can see at a glance that the project is actually in good shape, at least over all. We are less than 2% behind schedule and we are only a fraction of a percent under budget. This is the typical kind of “big picture” report that we would present to top management but would be of little use to the owner or contractors project manager. From a risk perspective this is telling us that this project does not have any obvious risks in terms of time or costs. However, should the gap or discrepancy between these three variables widen, this becomes a perfect example of a “risk trigger” or “early warning sign” that SOMETHING is going wrong and that the project control professional needs to apply other quality control tools such as Fishbone Diagrams or other “root cause” analysis tools to determine what the reason is and what fixes or corrective actions are appropriate.
- NDIA Predictive Measures Guide Figure 29 on page 81
- DAU Gold Card (2015)
04.6.4 - OUTPUTS
- CLOSE OUT OF RISK/OPPORTUNITY EVENTS IN THE RISK REGISTER
- CHANGES (+/-) TO CONTINGENCY BUFFERS
04.6.5 - REFERENCES & TEMPLATES
- Process Capability (CP, CPK) and Process Performance (PP, PPK) – What Is The Difference? (N.D.)
- NDIA (2013) Guide To Managing Programs Using Predictive Measures Chapter 5
- US Dept of Transportation (2013) Transportation Risk Management: International Practices For Program Development and Project Delivery H
GPCCAR M04-6 - Risk & Opportunity Monitoring and Control, Revision 1.00