09.0 - MANAGING PROJECT PROGRESS
09.1 - MODULE 09-1 - INTRODUCTION TO MANAGING PROJECT PROGRESS
09.1.1 - WHAT IS THE PURPOSE OF MANAGING PROJECT PROGRESS
The purpose of the Managing Progress Module is to introduce tools, techniques and methodologies associated with Earned Value Management, that have been identified as being “best tested and proven” practices and which have been found to work on “most projects, most of the time”; provide a logical or rationale sequence showing when those tools or techniques would normally and customarily be used and in selected instances, show how to use those tools/techniques and/or where to find additional information on how to use or apply them.
Earned Value Management (EVM) is a system consisting of a “toolbox” of tested and proven project management tools, techniques or methods for capturing physical progress, measuring, assessing and evaluating that physical progress against an approved baseline and looking at both historic performance and predicted or forecast performance, analyzing and evaluating the impacts and making recommendation. These recommendations along with the supporting analysis are then formally presented to the appropriate stakeholders as the basis for them to make decisions based on as close to real time progress against the plan as possible, and for owners to use in paying contractors promptly for their performance against the plan.
The roots of “earned value” originated on the factory floors of the 16th and 17th century Industrial Revolution in the form of a “pay for performance” or “work incentive” scheme, which was popularized by the work of Henry Gantt during the early 1900’s. Attesting to the success of this incentive scheme, “pay for performance” remains in use today by most factories and production shops in the form of the work incentive programs known as “piecework”. Based on this track record of success, to realize the full value earned value management offers, the Guild advocates linking performance based on earned value to prompt payment for work done in substantial conformance to the specifications and requirements and otherwise meeting or fulfilling the contractual requirements.
“Performance management” or “pay for performance” is the process which integrates the planning and scheduling processes (Module 7) and the cost estimating and cost budgeting processes (Module 8) to produce a Performance Measurement Baseline (PMB) which is approved by the appropriate levels of management. Once approved, this “PMB” which normally is shown as an “S Curve” becomes the basis against which all physical progress is captured, analyzed and evaluated. Applying the appropriate formula, each tool produces measures of progress that are articulated or communicated in terms of cost, schedule and technical performance. It includes, but is not limited to, techniques and metrics for analyzing and evaluating progress expressed not only in terms of the 4 primary or core process outputs (Module 3- Scope, Module 7, Schedule. Module 8, Cost and Module 5- Contracts) but as well, the outputs coming from the secondary or supporting processes such as Managing Risks (Module 4), Managing Resources (Module 6) and Managing Change (Module 10). The outputs from these modules also become the primary INPUTS to Module 12, Managing Forensic Analysis.
It is generally recognized and accepted that an Earned Value Management System (EVMS) consists of some 32 guidelines or criteria, which are both scalable and adaptable for use by government agencies and their contractors as well as for private sector owners and contractors, on both cost plus and firm fixed price contracts. The primary difference between how the public and private sectors uses EVMS being in how rigidly the guidelines are enforced and whether or not the EVMS system is or is not subject to being independently audited.
09.1.2 - WHAT ARE THE PROCESS MAPS FOR MANAGING PROJECT PROGRESS
This module is about taking the “Performance Measurement Baseline” (PMB) created as an OUTPUT of the integration or combination of Module 7 and Module 8, as a “fully cost and resource loaded CPM schedule”, and once accepted or approved by the appropriately authorized stakeholders, the PMB becomes the primary INPUT to the Managing Progress processes, serving as a baseline against which to capture, measure and evaluate physical progress not only in terms of the outputs generated from the 4 primary or core processes (Module 3- Scope, Module 7, Schedule. Module 8, Cost and Module 5- Contracts) but as well, the outputs coming from the secondary or supporting processes such as Managing Risks (Module 4), Managing Resources (Module 6) and Managing Change (Module 10).
The graphic below comes to us from Module 7.12 and Module 8.9 and serves to recap the interfaces between the Contractor’s and Owner’s project control teams to obtain the initial Notice to Proceed (NTP) and then prepare, submit and assess periodic updates.
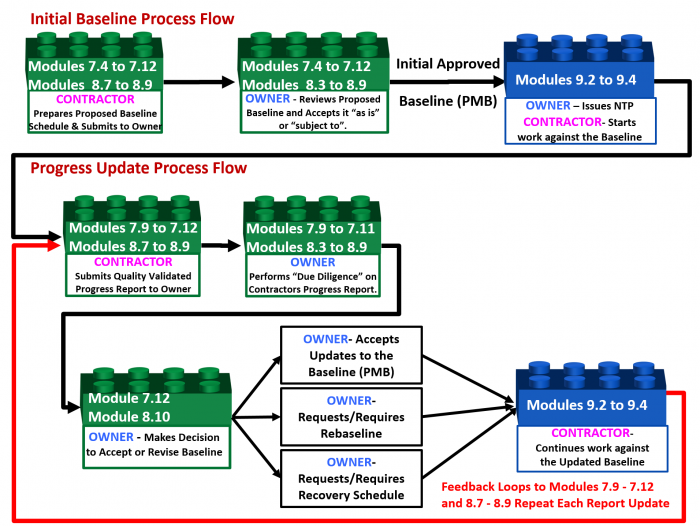
Figure 1 – 1,000 Meter View Showing the Interfaces Between Contractor and Owner for Modules 7- Managing Planning & Scheduling, Module 8- Managing Cost Estimating and Budgeting and Module 9- Managing Project Progress
Source: Guild of Project Controls
Figure 2 below looks at this same process, but from the perspective of the Module 9 processes rather than from the perspective of Modules 7,12 and Module 8.9 processes, where the schedule was cost and resource loaded producing the early and late date S curves which, when approved form the Performance Measurement Baseline (PMB). As this process map is so critical for the Project Control professional to know and understand, and appreciating the fact that the people doing the progress updates may very well not be the same people who created the initial PMB, emphasizes how important it is that everyone not only knows and understand the work flow, but is following the same procedure.
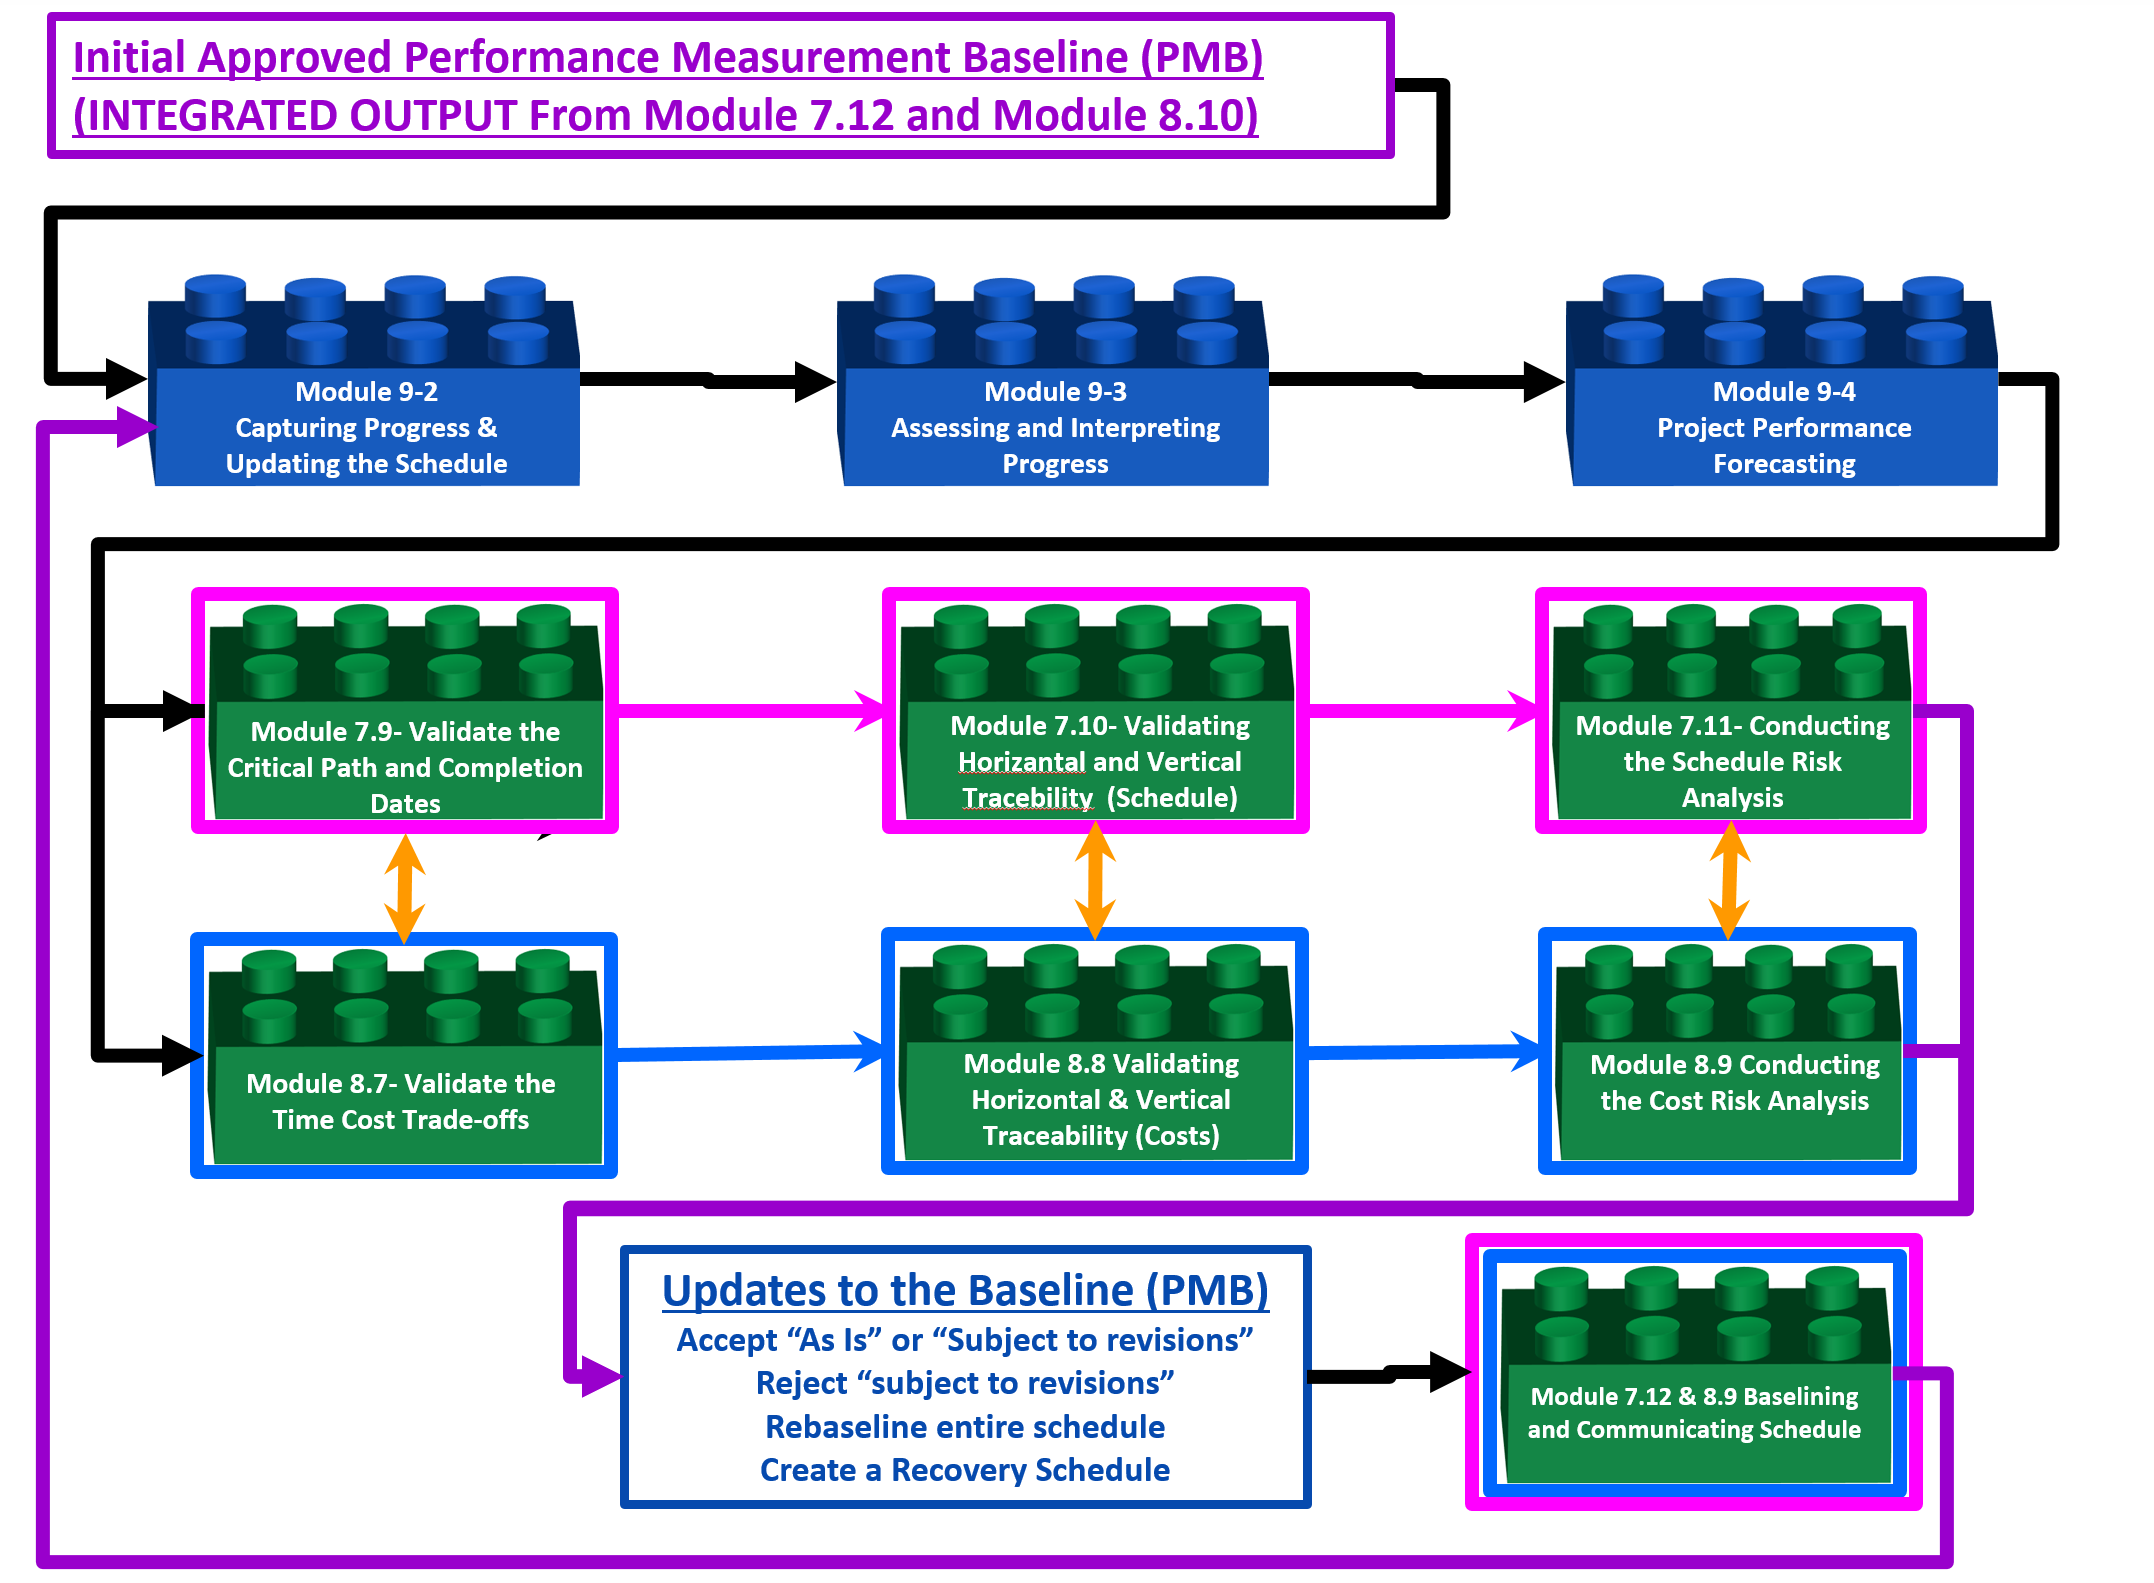
Figure 2 - 1.000 Meter Level Typical Process Flow Chart for Module 9- Managing Progress, as it relates to Module 7- Managing Cost Estimating and Budgeting and Module 8- Managing Cost Estimating and Budgeting
Source: Guild of Project Controls
As we can see from the process flow chart, starting with the approved PMB as the input, we begin the process by capturing and recording physical progress from the field, updating each activity. Then we assess the history to date from the beginning to the current data date, followed by applying the appropriate formulas to forecast both cost and completion dates. We present this information along with our analysis and recommendations to the appropriate stakeholders in as close to real time as possible, for them to make decisions. Using our expert analysis and recommendations, the decision makers can:
- Accept the updates “as presented” or “subject to” any changes or revisions they deem appropriate and necessary to best reflect what is really happening on the project;
- Reject the update subject to clarifications, corrections or recommendations of the project controls leadership;
- Rebaseline the schedule to reflect the existing reality in terms of time, cost, scope or other risk or opportunity impacts, including resource constraints;
- Direct the contractor to create a recovery schedule, taking whatever steps deemed appropriate and necessary to complete the project per the contractual or agreed to delivery dates.
As noted in Modules 7 and Module 8, in functionally structured organizations, where the planner/schedulers are separate from the cost estimators/cost budgeting team, it means the management of each functional group needs to coordinate the efforts between the planning/scheduling functions and the cost estimating/cost budgeting functions. However, if the organization is structured cross functionally as a project management office, (PMO), Project Support Office (PSO) or Project Controls Office (PCO) this integration between the three modules may well be done by the same people either separately or more commonly, simultaneously.
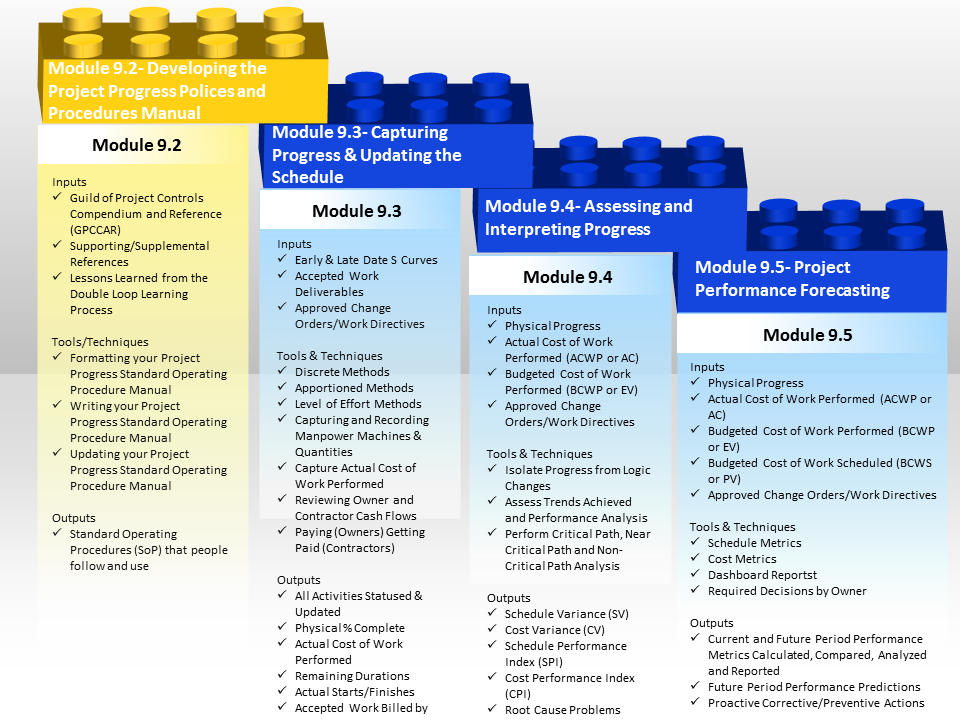
Figure 3 - The Managing Project Progress Process Map 100 Meter Level of Detail
Source: Guild of Project Controls
As with all other processes, the step which initiates Module 9- Managing Progress s the Policies and Procedures Manual (SOP) which should be developed and maintained by those who are actually executing these processes to ensure they buy into them, know and understand them and actually follow them.
The second step is a CONTROL step where we go to the field, capture actual progress and update the CPM schedule based on the physical progress to date.
The third step is to look at the progress from the beginning of the project until the current data date and compare what actually was done to what was planned to be done by this date and using that information, analyze and report the “as is” situation.
The fourth and final step is knowing we cannot change past history, is to use the data to date and applying the appropriate analyses tools/techniques, forecast into the future what the past performance history indicates is likely to happen.
The outputs from these process provide a direct feedback to Module 7- Managing Planning and Scheduling and Module 8- Managing Cost Estimating and Budgeting, and also forms the primary inputs to Module 10- Managing Change, Module 11- Managing Databases and Module 12- Managing Forensic Analyses.
While this 100 Meter level of detail provides a more granular look of the processes and how they interact than the 1,000 Meter view, there is yet another deeper level of detail which the Guild calls the “ground” or “working level”. It is the next level deeper which contains the explanation for each of the modules shown above, telling more about what inputs are required, including providing some examples; what tools, techniques are typically used, including providing examples or templates, and in selected instances, specific step by step instructions or links to additional resources, showing how to use each of these tools or techniques consistent with the Guild’s commitment to identify and advocate “best tested and proven” practices.
09.1.3 - BACKGROUND INFORMATION FOR MANAGING PROJECT PROGRESS
This module represents the completion of the Planning Phases of the project and the start of the Execution Phase of the project.
The primary references supporting this module are:
- GAO’s “Cost Estimating and Assessment Guide: Best Practices for Developing and Managing Capital Program Costs” (GAO-09-3SP) (2009) Chapters 18, 19 and 20
- GAO’s “GAO Schedule Assessment Guide: Best Practices for Project Schedules” (GAO-12-12OG) (2012) “Best Practices” #9 and #10
- DAU “Gold Card” (2015)
- NDIA’s “Guide to Managing Programs Using Predictive Measures” (2014)
These documents have been chosen as the Guild of Project Controls (GPC) believes they represent the most complete and concise applications of progress measurement in general and applied earned value management from both the OWNER’S and CONTRACTOR’s perspective) Together, these references represent over 750 pages of knowledge, which has been summarized in this module into a little bit more than 100 pages.
At the completion of Module 7 - Managing Project Planning and Scheduling and Module 8 - Managing Cost Estimating and Budgeting, we, as both OWNER and CONTRACTOR’s project control practitioners, have created what is known as a PERFORMANCE MEASUREMENT BASELINE (PMB).
For OWNERS, the PMB is a fully cost and resource loaded schedule which enabled the desicion to procure and award the project to a CONTRACTOR and helped to define the owners WBS, the owners Cost Estimate and owners Risk/Opportunity Register. Nonetheless, as a practitioner operating in either an OWNER organisation (defining and awarding a project) or CONTRACTORS organisation (implementing the project), we should have created a fully Cost and Resource Loaded schedule which forms the heart of the PMB.
The major difference between the Performance Measurement Baseline prepared by the owner vs the Performance Measurement Baseline prepared by the contractor is the contractor's PMB contains the contractor’s SELLING PRICE while the owner’s PMB contains their COST for these same activities. This seemingly small difference becomes important later on.
The Performance Measurement Baseline is most often is viewed as what is known as the “S” Curve and it should consist of not one but TWO curves which have been defined by the projects Cost and Resource Loaded schedule:
- Early Date Curve - generated with all activities scheduled to start AS SOON AS POSSIBLE (ASAP)
- Late Date Curve - generated by constraining all activities to start AS LATE AS POSSIBLE (ALAP)
This is what the PMB should typically look like from both the owner and contractors perspective:
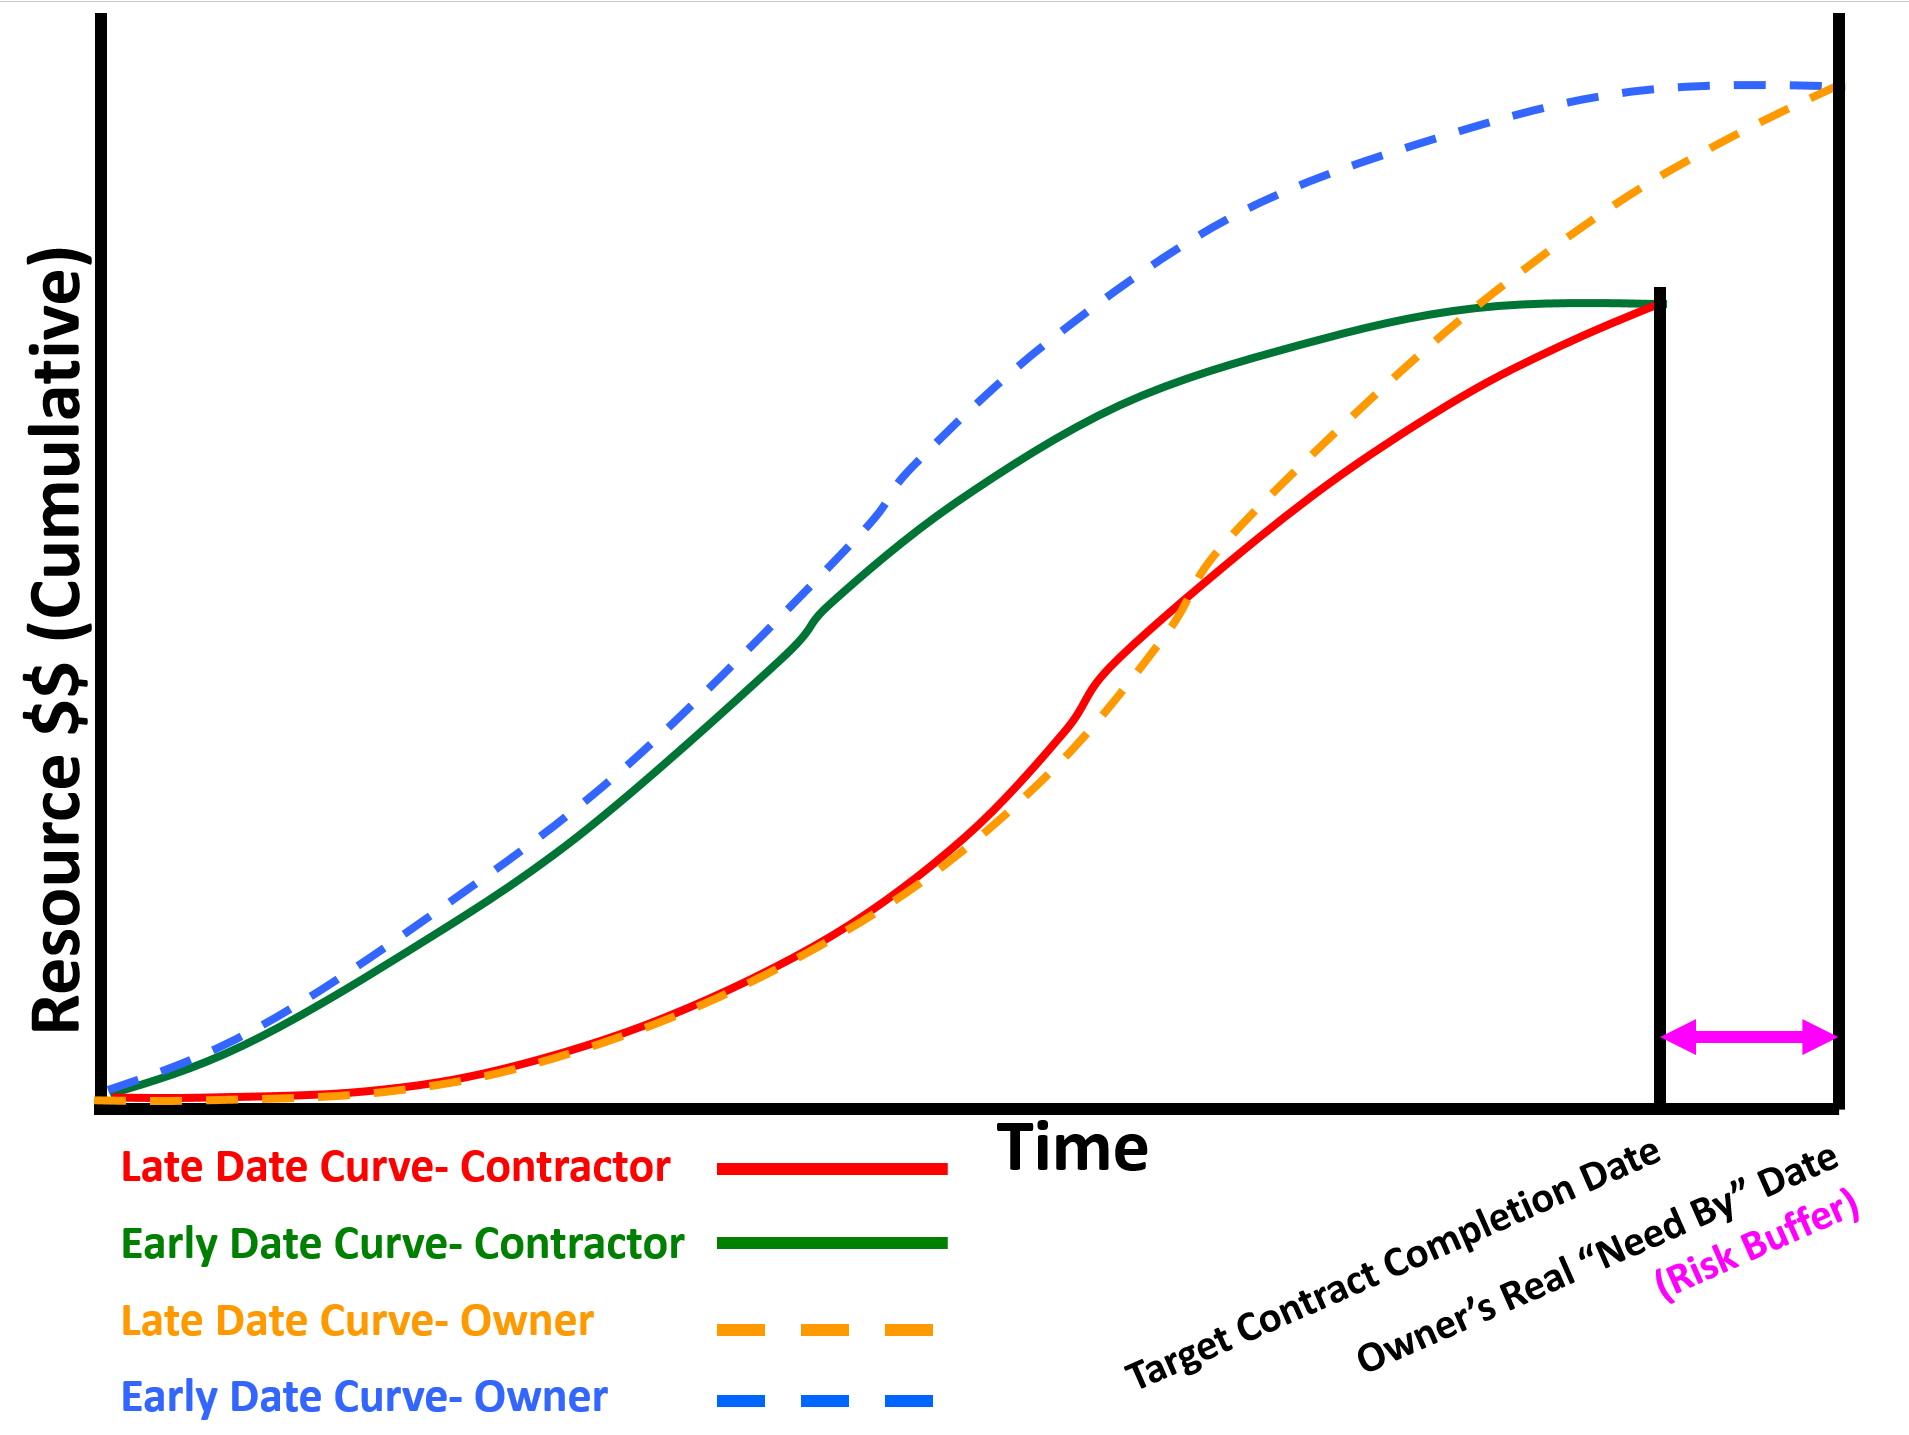
Figure 4 - Showing Owners Early and Late Date Curves vs Contractor’s Early and Late Date Curves
Source: Adapted from Humphrey's Gary (2015) Project Management Using Earned Value, 3rd Edition
Given that credible evidence exists supporting that project management is not working as well as it could or should for both owners and contractors alike, it is important to note that because one of the primary or most important objectives of a CPM schedule is to generate the early and late date “S Curves” or Performance Measurement Baseline (PMB) it requires that for both owner and contractor that every single activity be cost (resource) loaded. Failure to fully cost and resource load each activity in the schedule will produce an S Curve which is incomplete and/or does not reflect the full and true scope of work as expressed in money over time. (Time phased budget).
Implicit in this, especially for large schedules, that “rolling wave planning” be used to avoid having to produce Level 5 or 6 activities far into the future. Explained another way, for large schedules containing 5,000, 10,000 or more activities, while each and every activity should be cost/resource loaded, by changing the level of detail from greater to lesser the further into the future we get, enables us to generate accurate S Curves (both owner and contractor) without having to cost load each activity down to Level 4, 5 or 6.
The reason these curves are not the same is when the contractor SUBMITS the Cost and Resource Loaded Schedule to the owner for acceptance / approval the owner has to ADD to that schedule:
- Owner’s Management Activities (i.e. Project Management, Project Controls, Safety, QA/QC etc)
- Owner Supplied Equipment or Materials
- Owner’s Risk Contingency (i.e. both Time and Cost)
In Figure 5 below, using our case study developed in Module 08.6.3.2 to Module 08.6.3.6, we can see this is what the S-Curve or Performance Measurement Baseline (PMB) would look like coming from the CONTRACTOR to the OWNER. Once the owner has APPROVED and ACCEPTED this baseline, to make it of full value to the OWNER, the owner will have to ADD activities to cover:
- Owner’s Management Activities (i.e. Project Management, Project Controls, Safety, QA/QC etc)
- Owner Supplied Equipment or Materials
- Owner’s Risk Contingency (i.e. both Time and Cost)

Figure 5 - The S-curve
Source: Giammalvo, Paul D (2015) Course Materials. Contributed Under Creative Commons License BY v 4.0
By adding activities to cover these three additional items provided by the OWNER, and by extending the completion date to beyond the contractual completion date to cover owner’s testing and commissioning activities, will almost always result in the OWNER’S PMB being LARGER than that of the contractor as well as LONGER DURATION than the contractor’s PMB or S-Curve. This can be seen conceptually in both Figures 1 above and Figure 3 below.
To explain a different way, it is NOT a “best tested and proven” approach for the owner to track project performance against the contractors PMB alone. Why? Because without the OWNER capturing his/her own costs for work over and above the owners’ costs of the work done by the contractor, is going to give the owner an overly optimistic Cost Performance Index (It will usually remain at 1.0) and unless the Owner’s and Contractor’s completion dates are exactly the same (which also is not usually the case) it will give the owner an unrealistically optimistic SPI as well.
To see more on how to the OWNER can track their own costs against their PMB, see Module 09.3 - Capturing Progress & Updating the Schedule - Closing the Accounting Time Gap, Figure 11. Following this “best tested and proven” practice, the owner will be able calculate and use their own SPI and CPI which in most cases will NOT be the same as that of the contractor.
This is what the PMB should typically look like utilising the Contractors PMB, Owner’s PMB and Owner’s Approved for Expenditure (AFE):
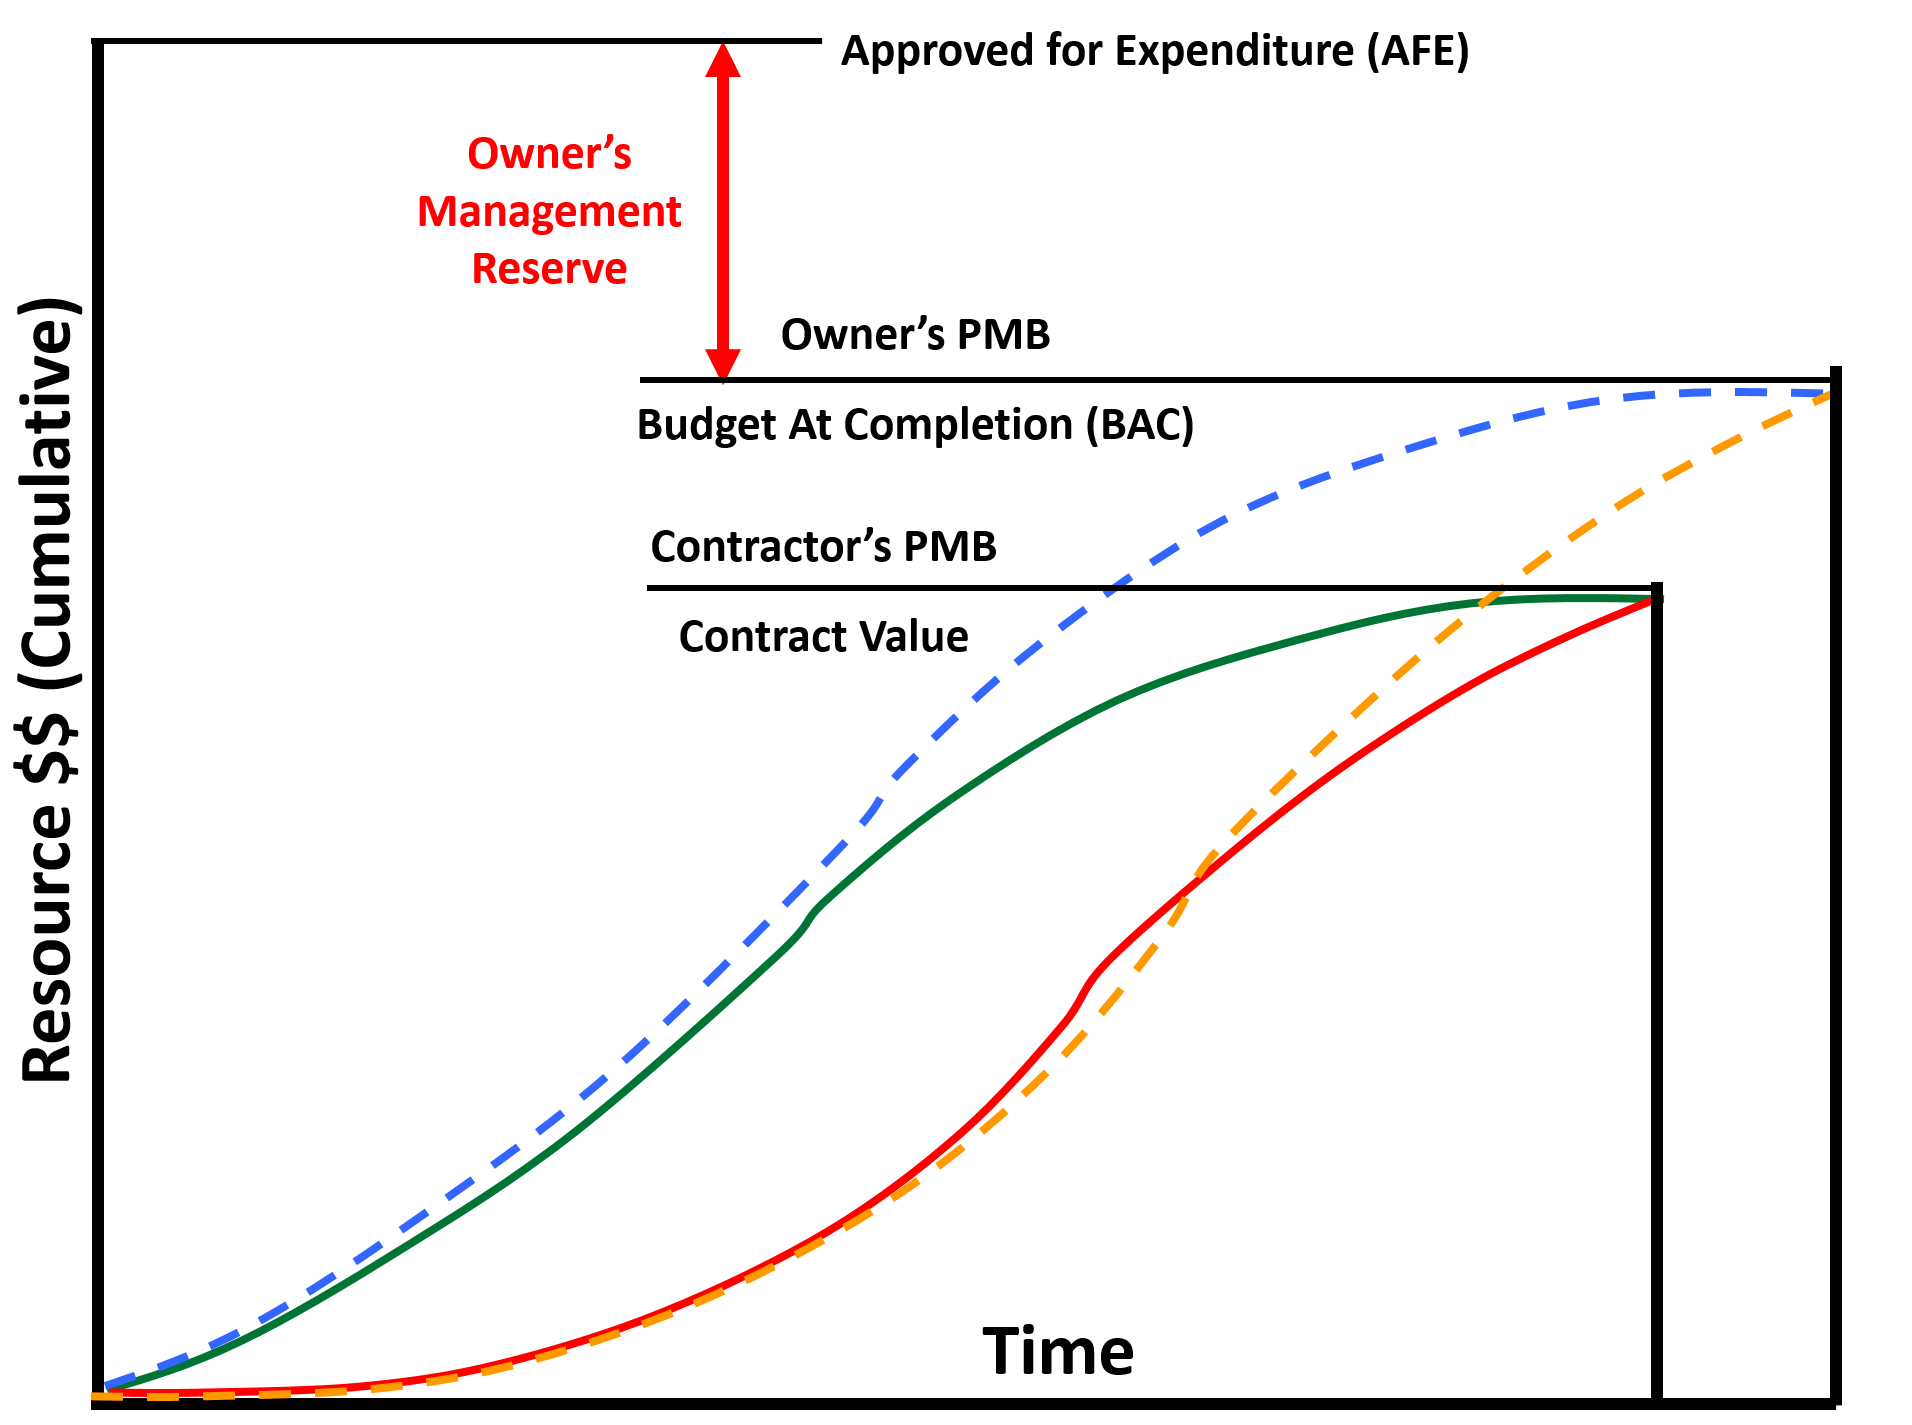
Figure 6 - Illustrating Contractors PMB, Owner’s PMB and Owner’s Approved for Expenditure (AFE)
Source: Giammalvo, Paul D (2015) Course Materials. Contributed Under Creative Commons License BY v 4.0
What the OWNERS “S” curve should NOT contain is undistributed money, known as MANAGEMENT RESERVE. For OWNER’s undistributed budget is NOT allowed to be included in the S Curve as it does not belong to the Owner’s project manager to spend, but as the name implies, belongs to the SPONSORING management who are free to allocate it as they deem appropriate, based on recommendations and / or requests from their project manager.
While CONTRACTOR’s are unlikely to ever see the OWNER’s S curve they both will be tracking project progress against the Contractor’s PMB, as the CONTRACTOR’s EARNED VALUE (BCWP or EV) becomes the OWNER’s ACTUAL COST of WORK PERFORMED (ACWP or AC) for the contractors activities. This will be covered in more detail below.
Introducing “Earned Value Management”- the CONCEPT
To help us get started, we need to know and understand where earned value came from and how it works. Worth keeping in mind is that many project control professionals, both owner and contractors use some form of or some parts of “earned value management” even though they may not call it that. As we move through the various tools and techniques, even those who don’t believe they use “earned value” are likely to find that you are using some or even all of it.
Earned Value is not a complicated concept to understand. It is based on the legal principal of “Quantum Meruit” or the value deserved. Our Business Dictionary definition tells us “Quantum Meruit” is a “Court order or a provision in a contract that the client or customer should pay proportionately for a partially completed contract or order. This rule may not be applicable where it is essential that an order is completed or a contract is performed in full. Latin for, as much as deserved.
More from the Legal Dictionary - “The doctrine of quantum meruit was developed in the seventeenth century by the royal Court of Chancery in England. This court worked apart from the common law courts to grant relief that was due under general principles of fairness but could not be obtained under the strict legal precedents of the common law courts”.
The system of basing decisions on basic principles of fairness became known as Equity. The Chancery Court developed quantum meruit along with other equitable doctrines that allowed a person to recover or collect for other valuable acts performed without a contract, such as the delivery of goods or money. Some of the first cases of quantum meruit involved recovery by persons in so-called trades of common calling, such as innkeepers, tailors, blacksmiths, and tanners.
As service industries increased, so did claims for recovery under quantum meruit, and the doctrine was adopted by colonialcourts. U.S. courts now apply quantum meruit principles in a wide variety of cases, including cases involving attorneys' fees, physicians' fees, construction work and government contracts.
Courts have crafted four basic elements that the plaintiff must prove before she may recover under the doctrine of quantum meruit:
- that valuable services were rendered;
- that the services were rendered to the defendant;
- that the serviceswere accepted, used, and enjoyed by the defendant; and
- that the defendant was aware that the plaintiff, in performing the services, expected to be paid by the defendant.”
As we will see in the next graphic, here is a simple process flow which is consistent with how Earned Value Management can and should be understood and then used. 
Figure 7 Showing the Underlying Concept of Earned Value Management
Source: Giammalvo, Paul D (2015) Contributed Under Creative Commons License BY SA v 4.0
In Figure 7, we can see the basic concepts upon which earned value is or was based on. The first important aspect is that the underlying assumption is the buyer or customer knows the fair market value of the goods or services they are purchasing. Secondly, the buyer does not necessarily have to select the lowest possible price, but the price they perceive as being “Best Value for the Money”. Next, the buyer or customer does not have to purchase goods or services which are substandard, containing either latent or patent defects. They get to test for the quality of the product or services they are purchasing and it is up to the seller to provide sufficient proof that the products, goods or services meet the requirements established by the buyer. The next step is to measure the physical quantity taken (which we learned how to do in the previous module) and then the part which is often missing in most Earned Value textbooks is we pay the seller PROMPTLY for what we as buyers, received. Nothing more, and nothing less.
Given one of the leading causes of disputes and claims on projects not to mention poor performance by the contractors comes about because they are being starved for working capital, project control professionals, especially those working for owner organizations, need to know and understand this concept if they want to get the best performance from their contractors.
Additional Notes for Contractors and Owners Project Control Practitioners
As project control practitioners, especially those coming from the contractor’s side, we need to know and understand what owners are looking for in the way of information about their projects. While we may or may not use all these metrics, as practitioners we need to know when and how to use them because they will be of interest to other project stakeholders.
From the contractor’s perspective, getting paid promptly for work done (“cash flow management”) remains one of the biggest issues for contractors and is covered in detail below. This is important for owner's project control practitioners to know and understand as well, as cash flow has a definite impact on how well contractors are able to perform on a project.
Frequency of Reporting
There is another “rule of thumb” worth introducing; it is generally recognized and accepted that you start with the frequency of the reporting and TRACK progress one level lower than is being reported and CAPTURE progress data TWO levels lower than being reported.
- For example, if you are reporting MONTHLY, then you would be advised to TRACK progress weekly. Why is that? Because if a problem starts to develop you want to be “on top of it” so that when you issue your report to management you already have developed options to fix the problem for them to choose from. (good practice suggests that we NEVER go into a management meeting with a problem and no suggested solutions!). Likewise, if you TRACKING weekly, then you need to be capturing data DAILY.
The application of Earned Value has been broken down into three parts.
- In Module 09.3 - Capturing Progress & Updating the Schedule, we will be focusing on the progress from the beginning of the project up until the current data date or time now line.
- In Module 09.4 - Assessing and Interpreting Progress Data, we will be focusing on how to capture and apply the money which was actually spent to accomplish the work we have done, which hopefully is equal to or less than the amount we had originally budgeted. In Module 9.3, we will focus on using the tools and techniques of earned value to analyse what happened from the beginning of the project to the current data date and;
- In Module 09.5 - Project Performance Forecasting, we will be forecasting or trying to predict from the current data date or time now line into the future, with the objective being to influence the future outcomes to be favourable.
Under the heading of “Managing Progress", we will establish a holistic integrated progress measurement and schedule update process and procedures manual based on the best tested and proven practices available on the internet, and made available under open source or creative commons license. Then we will explore the various ways to measure and record physical percent complete, followed by using the information generated by capturing and applying physical progress, first by looking backwards to see where we have been and then in the last module we will take the same data and use it to look forward, using forecasting to be proactive in keeping our project on time and within budget.
09.2 - Module 09-2 - Developing the Managing Project Progress Policies & Procedures Manual
09.3 - Module 09-3 - Capturing Progress & Updating the Schedule
09.4 - Module 09-4 - Assessing and Interpreting Progress Data
09.5 - Module 09-5 - Project Performance Forecasting
GPCCAR M09-1, Revision 1.02