4.0 - MANAGING RISK & OPPORTUNITY
04.1 - Module 04-1 - Introduction to Managing Risk & Opportunity
04.2 - Module 04-2 - Develop Risk & Opportunity Policies & Procedures Manual
04.3 IDENTIFY RISKS & OPPORTUNITIES
04.3.1 - INTRODUCTION
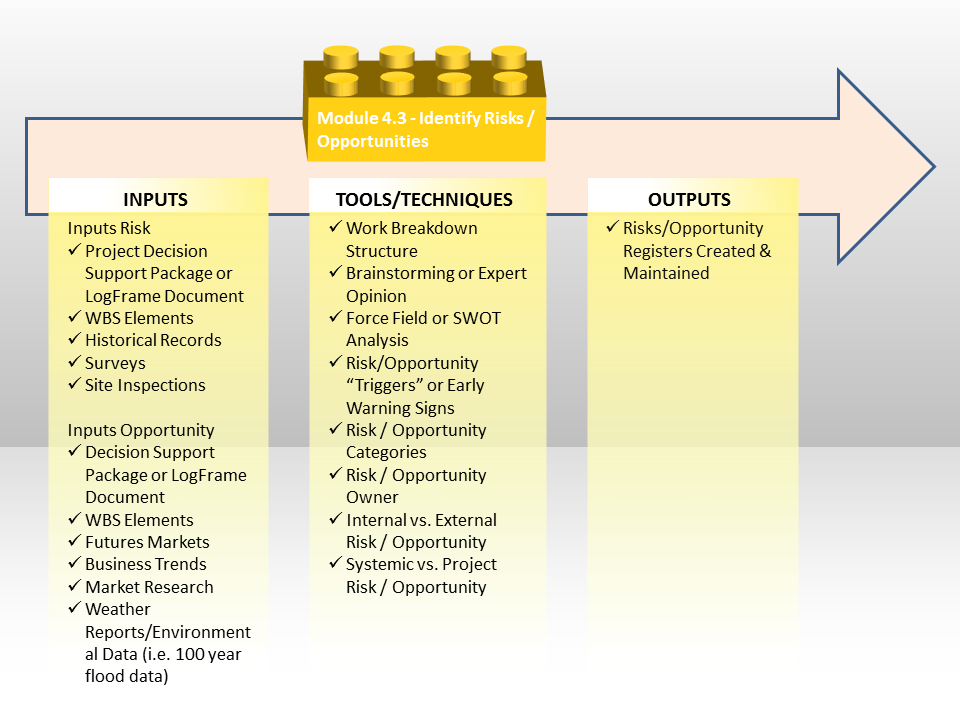
Figure 1 - Identify Risks and Opportunities Process Roadmap
Source: Guild of Project Controls
Whether you are working in an Owner or a Contractor role the actions remain largely similar. This Module relates to setting up the risk/opportunity register which should initiate the production of BOTH a Project Risk Register and a Project Opportunity Register that at MINIMUM contains these headings or fields:
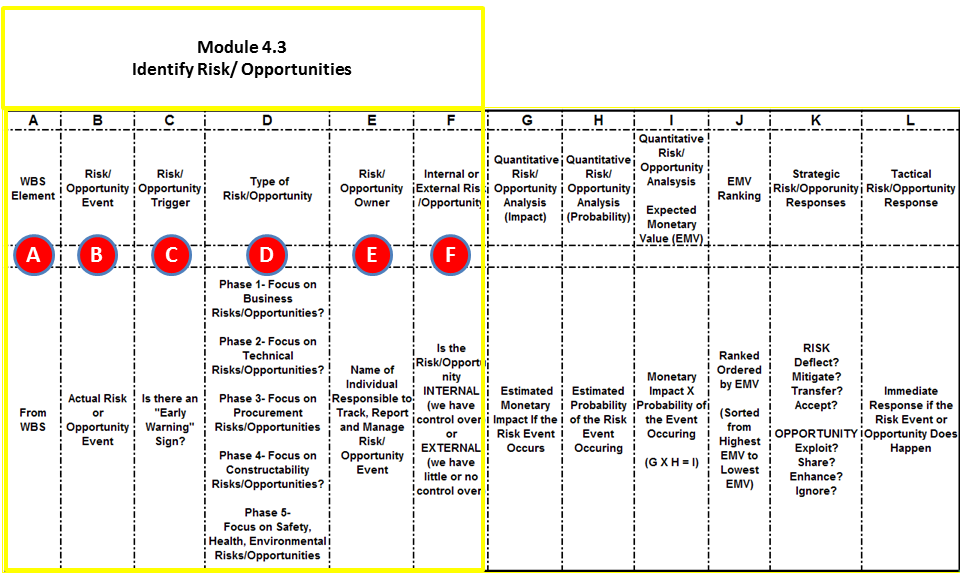
Figure 2 - Sample Risk Register Template
Source: Giammalvo, Paul D (2015) Course Materials. Contributed Under Creative Commons License BY v 4.0
As can be seen by the golden color coding, for the purposes of project controls, this module, Module 4-3 - Identifying Risks/Opportunities is considered to be an INITIATING process. As with other processes, “garbage in/garbage out” applies and failure to invest time and effort as a part of each and every phase gate review process to identify risks is almost surely to result in either or both risks and opportunities not being identified by someone during the phase gate review process.
For contractors, the major source of potential risks and opportunities comes from reading and understanding the contract documents. It is through the contract documents that owners TRANSFER risks to contractors. For more on this refer to Module 5- Managing Contracts, but suffice it to say that many times owners intentionally or otherwise, pass along risks to contractors over which the contractor has no more ability to control than does the owner.
Below is one example of what a real Risk/Opportunity Register Document might look like:
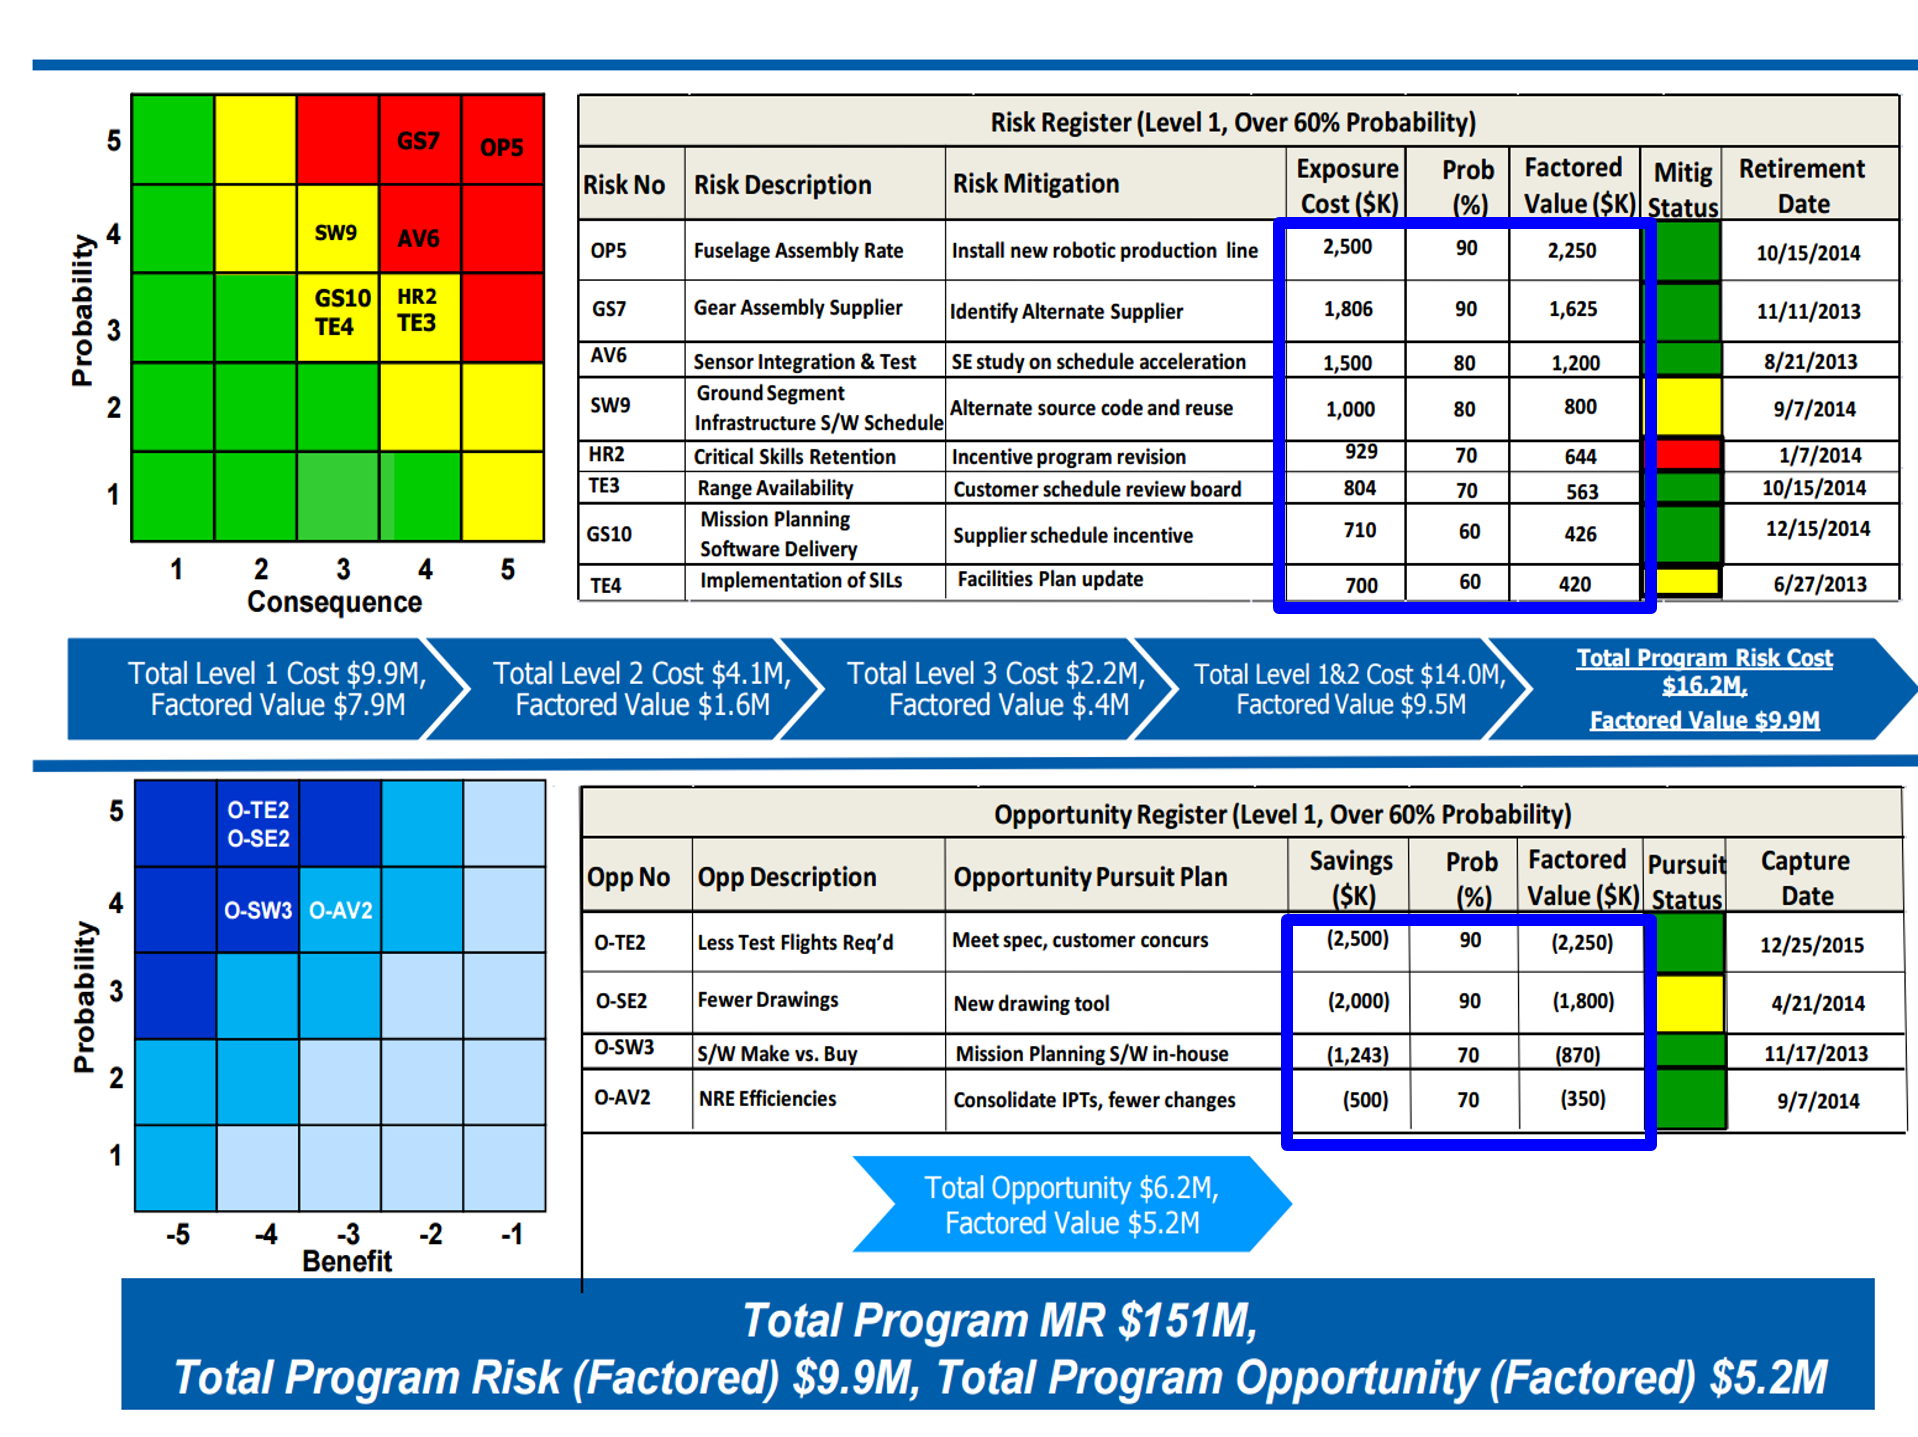
Figure 3 - Example of a Partially Complete Risk & Opportunity Template
Source: NDIA’s “Guide to Managing Programs Using Predictive Measures” (2014)
What is interesting with this example is it combines both QUALITATIVE (colored matrix on the left) with QUANTITATIVE analysis (Tables on the right) into a single graphic.
While this is one example, when compared against the risk/opportunity template shown above, you can see it is not the best or most complete example of a risk/opportunity register template. You need to look at the headings shown in the “best tested and proven” sample risk/opportunity register template shown at the beginning of this section and select which ones are important to you, understanding you can add other parameters (fields) if your stakeholders so require.
As noted above, in order to produce meaningful numbers that project control professionals can use, we need to be able to convert the values shown in the Probability/Consequence and Probability/Benefit Matrices on the left hand side, into actual losses or savings and the probability of them happing.
Explained another way, while the two matrices on the left hand side (Probability vs Consequence and Probability vs Benefit) may be eye-catching, they provide little or no useful (quantifiable) information for the project control professional. What we need is the more specific QUANTIFIED information (expressed in terms of money and/or time and/or probability) contained in the 4th, 5th and 6th columns. (Highlighted in the graphic above, outlined in blue.)
The objective is for the Project Control practitioner to add a line item to the risk/opportunity register to cater for each risk (or opportunity) element that may arise. Explained another way, because the risk/opportunity register is or should be set up as a relational or object oriented database, adding other additional fields (i.e. Systemic vs Project Specific) should not be difficult.
Types of Risk:
- Known-Unknowns are those items which we have identified and know to be required on a project but don’t know exactly how much they will cost or how long they will take. An example is your monthly electricity bill. You know it will come every month and while you don’t know exactly how much it will be, you can develop an educated guess of how much it will be for any given month and set that aside to cover the bill and perhaps build in a buffer or contingency just in case it runs more than you budgeted.
- Unknown-Unknowns are the “surprises” that you never anticipated would happen but did happen. An example would be your 5 year old refrigerator breaking down. It is out of warranty but well below its expected useful life. Many households have set aside an emergency fund to cover these unforeseen/unanticipated events. In the world of project management, this “emergency fund” is known as “management reserve” and as the name implies, it does not belong to the project manager or project controls team but to management and to access those funds, the project manager/project control team need to prepare a case justifying or rationalizing why they need this money, which may or may not be approved by management. Worth noting, in a contractor’s organization their management reserve is their profit margin and any “unknown-unknowns” which occur on a project are funded from the profit margin.
04.3.2 - INPUTS
Risk Inputs
- PROJECT DECISION SUPPORT PACKAGE OR LOGFRAME DOCUMENT
- WBS ELEMENTS
- RISK/OPPORTUNITY POLICY AND PROCEDURES MANUALS
- HISTORICAL RECORDS
- SURVEYS
- SITE INSPECTIONS
Opportunity Inputs
- DECISION SUPPORT PACKAGE OR LOGFRAME DOCUMENT
- WBS ELEMENTS
- RISK/OPPORTUNITY POLICY AND PROCEDURES MANUALS
- FUTURES MARKETS
- BUSINESS TRENDS
- MARKET RESEARCH
- WEATHER REPORTS/ENVIRONMENTAL DATA (I.E. 100 YEAR FLOOD DATA)
04.3.3 - TOOLS & TECHNIQUES
04.3.3.01 - The Work Breakdown Structure
Refer Column A in Figure 2 above - The WBS structure becomes the primary or most important foundation to the risk analysis process because if done correctly, the WBS should define exactly 100% of the Project scope. Figure 2 above shows how we use the WBS as the basis for a structured approach to risk and opportunity identification.
As noted earlier, we start with the WBS for our Risk and / or Opportunity assessment there are a MINIMUM of 4 dimensions or attributes we have to analyse:
- That the Scope will change (+/-)
- That the Time will change (+/-)
- That the Cost will change (+/-)
- That the Quality will change (+/-)
As noted earlier, we start with the WBS for our Risk and / or Opportunity assessment there are a MINIMUM of 4 dimensions or attributes we have to analyse:
In addition, Safety, Health and the Environment (SH&E) is another possible dimension or attribute along with any others the stakeholders deem important to measure and monitor, but at minimum there are 4.
04.3.3.02 - Primary and Secondary Risk Analysis
As we can see from Figure 4 below, starting with the WBS for each element of the WBS (at whatever LEVEL we are working with) we conduct a PRIMARY risk assessment, asking the question “what can go wrong in terms of Quality, Time and Cost.”
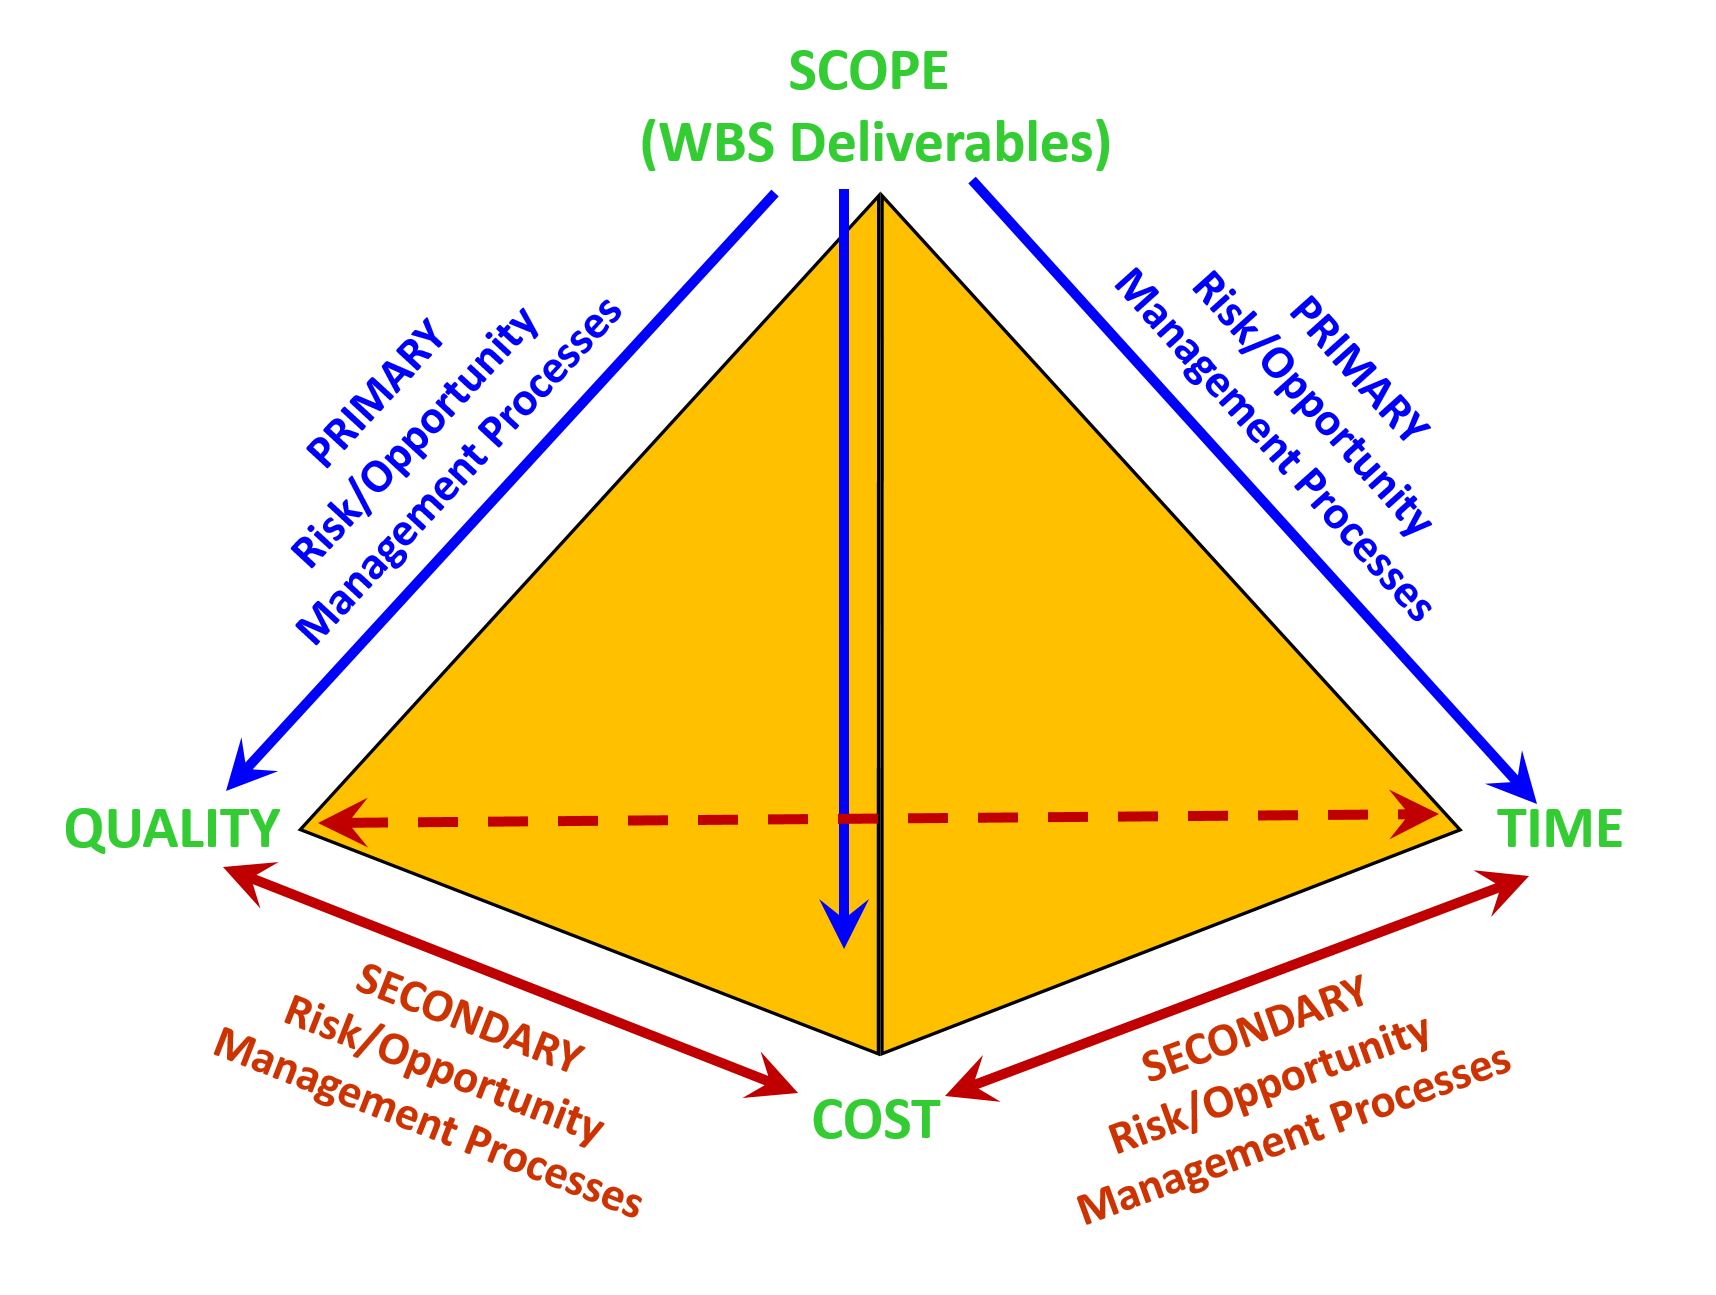
Figure 4 - Primary and Secondary Risk Analysis
Source: Giammalvo, Paul D (2015) Course Materials. Contributed Under Creative Commons License BY v 4.0
Then having done the PRIMARY risk assessment, we conduct a SECONDARY risk assessment, asking the questions
“If something negative impacts QUALITY, what is the impact on time? On costs?"
We repeat the secondary assessment by asking the same question-
“If something negative impacts TIME what is the impact on Quality? On Costs?”
Then likewise for Costs-
“If something negative happens to COSTS, what is the impact on Time? Quality?”
Obviously enough, we take the same approach to opportunity, starting with the WBS elements, then asking as the primary question
“What opportunities does this WBS offer in terms of Time? Costs? Quality?" Then we follow on with the secondary analysis comparing Time vs Costs vs Quality.
What project controllers need to understand and appreciate is that an opportunity for one element may represent a secondary risk. For example, we may have an opportunity to air freight a piece of equipment getting it to the project site early, but the risk being that the costs will increase.
As noted previously and as can be seen in Figure 4 above, the risk processes are or should be EMBEDDED into everything we do. That is, risk is not a separate function but a way of thinking, so that risk management processes are an integral part of every process we execute.
History has shown that when we separate risk and treat as a stand-alone process, we find that we may do one or two risk meetings and then forget about the risk until something goes wrong. By integrating risk and giving it the same importance as we do time and cost and quality, as shown above, we are less likely to end up with unpleasant surprises.
Explained another way, we need to treat ALL risk categories with the same seriousness and focus that we do for SAFETY, which is just one of many of the faces of “risk”.
Towards that end, the Guild has included the discussions and considerations of risk and EMBEDDED them in the relevant Modules: Risk Meeting and Agenda Items in Module 1 (Asset and Project Decision Support Package Meetings) and Module 2 (Communications and Stakeholder Management)
Schedule Risk assessment as agenda items in Module 7 Cost Risk assessment as agenda items in Module 8 Progress Risk assessment as agenda items in Module 9.
Given that risk management, as evidenced by the relativey high “failure rates” of both projects and/or the products projects create or produce is one of the weakest areas in project management, this represents an ideal opportunity for project control professionals to demonstrate our “value proposition” by saving more money and/or time than we cost. Explained another way, it is important that we can demonstrate that project controls is not merely another overhead cost but that we not only pay for ourselves but generate a measurable return on our professional services.
04.3.3.03 - Brainstorming or Expert Opinion
Refer Column B in Figure 2 above - Brainstorming and the use of Subject Matter Experts (SME’s) is probably one of the most effective and efficient ways to identify risks and opportunities for the register.
In addition to arguably the most effective means of populating the Risk Register which is to convene the appropriate Subject Matter Experts and ask them to provide input as to what could go wrong (risk) or what opportunities might be exploited. There are also several other brainstorming tools and techniques we can employ:
- Nominal Group Technique (NGT)
- Delphi Method
- Analytical Hierarchy (AGP) Method
- Rely on previous “Lessons Learned”
- Historic records
- Commercial databases
Regardless of the name, the underlying process remains the same - gathering people who know or should know from experience what can go right or wrong, then picking their brains and capturing their combined knowledge into the risk register.
Understand that this process applies to both owners and contractors, but in the case of the contractors, the focus of the risk analysis is on cost estimating, productivity (durations) and constructability risk events, (Can the project be built as designed?) The contractors also have to worry about safety, health and environmental violations as well as what is known as the “shall clauses” in the contract documents. Each time the contractor sees the phrase “Contractor Shall…” it is both a line item cost element as well as a potential risk event for the contractor.
Once we have convened the appropriate subject matter experts, (SME) we start with each WBS element at whatever level has been defined at the time we conduct the risk analysis. Then we bring together the appropriate subject matter experts (SME’s) and for each WBS element, we create a Strengths, Weaknesses, Opportunity, Threats (SWOT) Analysis by ask the following questions:
(1) What are the THREATS that can have a negative impact on QUALITY for this WBS Element or Work Package?
(2) What are the OPPORTUNITIES to improve QUALITY for this WBS Element or Work Package?
(3) What are the THREATS that can have a negative impact on COST for this WBS Element or Work Package?
(4) What are the OPPORTUNITIES to improve COST for this WBS Element or Work Package?
(5) What are the THREATS that can have a negative impact on TIME for this WBS Element or Work Package?
(6) What are the OPPORTUNITIES to improve TIME for this WBS Element or Work Package?
As noted previously, this is just a simplified example using the traditional “Scope, Time, Cost, Quality” triangle. It would be expected that additional questions could be asked about safety or any other attribute identified by key stakeholders as being how they want to define the “success” of the project.
This is known as a PRIMARY Risk/Opportunity Analysis.
Then if we really want to do an in depth analysis then we ask the SECONDARY set of questions which are:
(1) If something negative happens to QUALITY, then what is the impact on TIME? COST?
(2) If something negative happens to COSTS, then what is the impact on QUALITY? TIME?
(3) If something negative happens to TIME, then what is the impact on QUALITY? COSTS?
(4) If there is an OPPORTUNITY that impacts QUALITY then with will have on TIME? COSTS?
(5) If there is an OPPORTUNITY that impacts COSTS then with will have on TIME? QUALITY?
(6) If there is an OPPORTUNITY that impacts TIME then with will have on TIME? COSTS?
This is admittedly a lengthy boring process HOWEVER, if risk management is important to your project then this kind of structured, detailed risk analysis is essential.
04.3.3.04 - SWOT Analysis
Refer Column B in Figure 2 above - Another very powerful tool to help us identify both risks and opportunities for the entire project, each phase of the project on down to each WBS element or Work Package, the easiest and most common tool to apply is a SWOT Analysis.
In the example below (Figure 5), we would first fill in the Opportunities and Threats and then the second step would be to analyse our strengths and weakness which either make us vulnerable to the risks or strengths which we can take use to take advantage of any opportunities which present themselves.
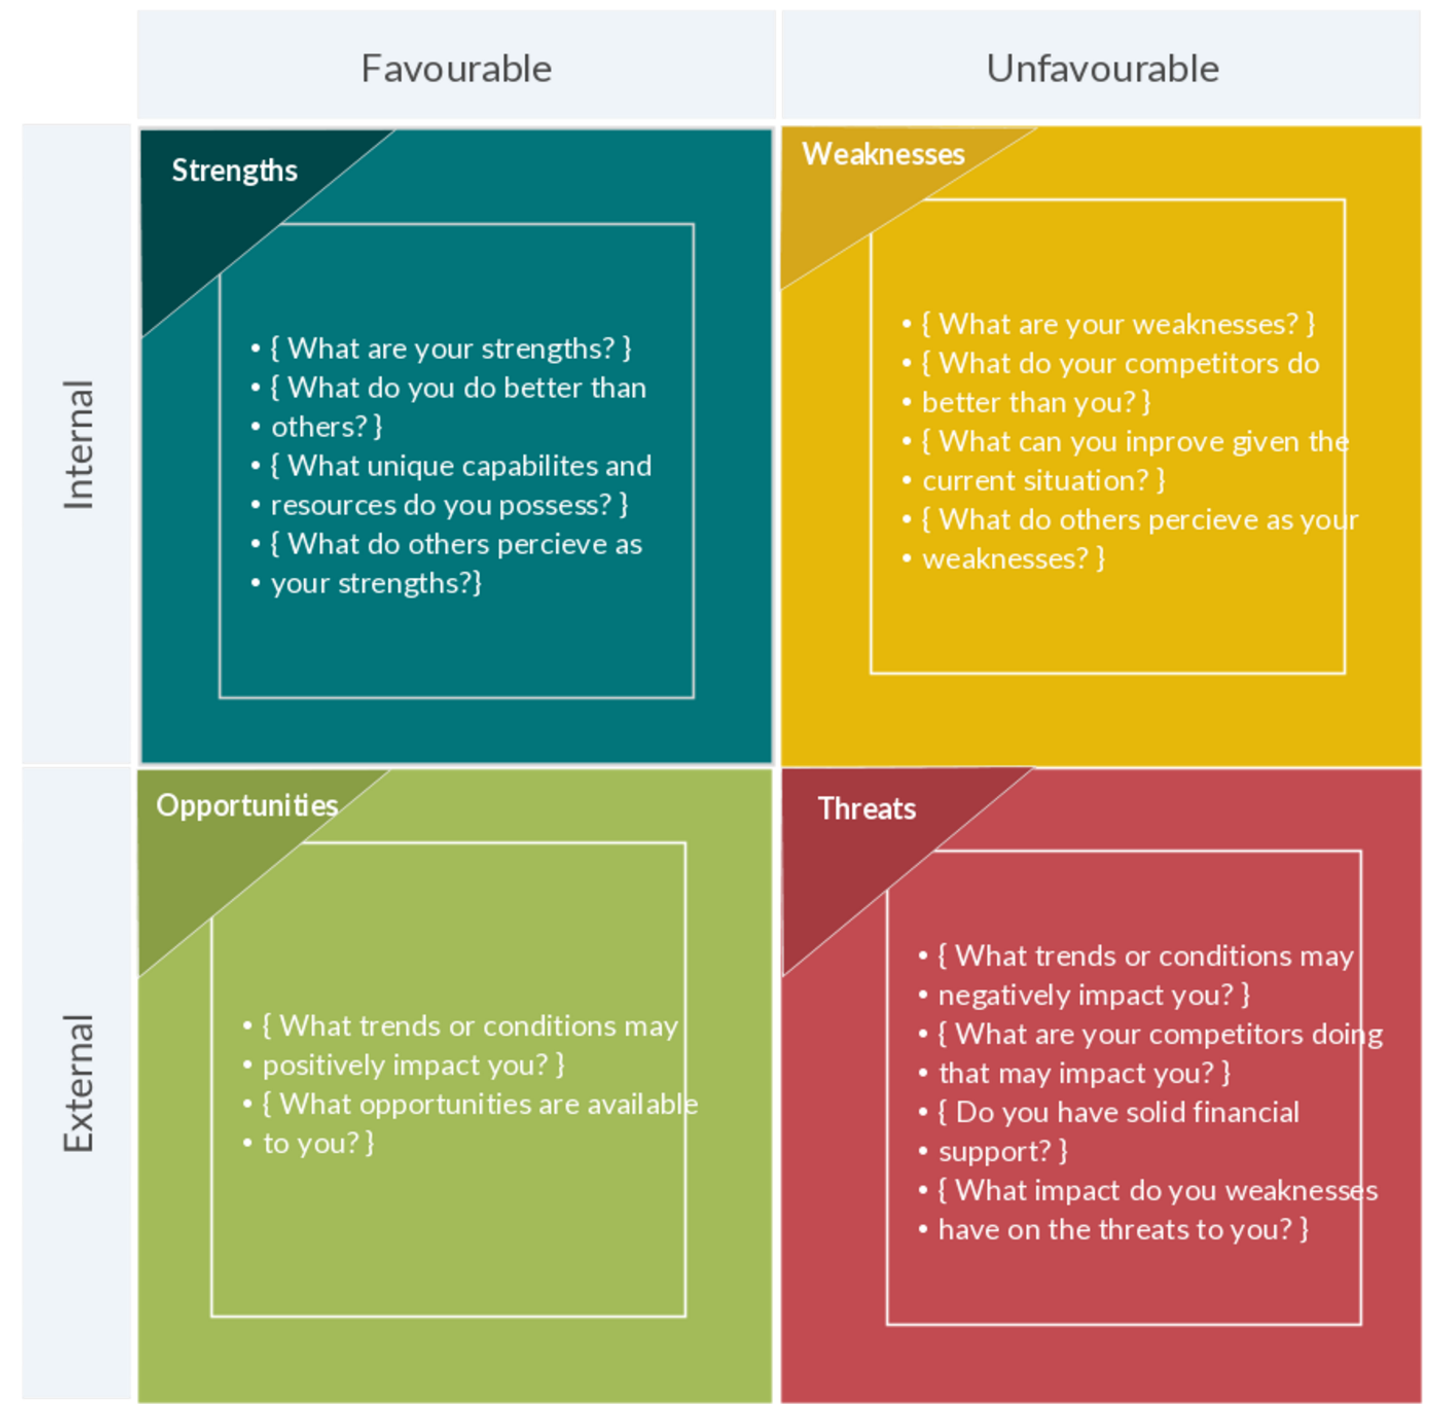
Figure 5 - SWOT Analysis
Source: Creately (2012)
Referring back to Figure 2 the use of a SWOT analysis will help us not only IDENTIFYING risks (Column B) but also to help us when it comes time to develop one of the four possible RISK response strategies: (Column K, Module 4-5 – Risk / Opportunity Response Strategies and Tactics)
Worth noting at this point is what may be considered or identified as a THREAT from the owner’s perspective (i.e. change orders or claims) may well be perceived as an OPPORTUNITY from the perspective of the contractor. Unfortunately, there are many contractors who if they perceive that an owner has missed large amounts of scope, will “buy” the project (bidding at or even below cost) with the expectation they will win the bid and then make up for it through change orders.
04.3.3.05 - Risk / Opportunity “Triggers” or Early Warning Signs
Refer Column C in Figure 2 above - Research on disasters, especially those involving plane crashes and industrial accidents, such as BP’s Deepwater Horizon Project have provided us with some important “lessons learned” that we can and should be applying in our projects. One of those “lessons learned” is that relatively few disasters happen spontaneously - that there are almost always warning signs, many of which are either ignored or misinterpreted. This is why the Guild of Project Controls advocates including a field containing those early warning signs.
For planning and scheduling, one of the early warning signs is a steady consumption in float (contingency). The same goes for cost management. The whole purpose of TREND ANALYSIS which we will cover in Module 11- Managing Project Progress is all the earned value metrics but especially the trends provide us with those early warning signs. Likewise, positive trends can be an indication of potential opportunities which also should not be overlooked.
Figure 6 - Showing “Early Warning” signs for SPI and CPI
Source: NDIA’s “Guide to Managing Programs Using Predictive Measures” (2014)
The above Figure 6 is but one example illustrating the concept of “early warning signs” or “risk triggers”. In this case, these risk triggers apply to both owner and contractor.
On the positive side, the same concept applies equally to opportunities. A prime example for project control professionals would be if we expect prices to rise on a particular bulk product, we could either lock in a fixed price via a contract OR purchase futures in that commodity in order to hedge the risk of price increases. While project controllers most likely do not have the formal authority to make these kinds of decisions, we do or at least should have the expertise to be able to put together a business case to present to the project sponsors/project manager or other key stakeholders in order for them to make decisions.
04.3.3.06 - Risk / Opportunity Categories
Refer Column D in Figure 2 above - Given the reality that rarely is a project manager much less a project control practitioner empowered to make all tactical much less strategic decisions, it is important to know what type of risk or opportunity each event represents, understanding that different risk or opportunity events require the project controls team to communicate information regarding these risks/opportunities to different stakeholders to enable them to assess the event and make appropriate decisions.
The list of potential risk / opportunities can be summarised as follows:
- Business Risks / Opportunities
- Technical Risks / Opportunities
- Procurement Risks / Opportunities
- Constructability Risks / Opportunities
- Execution Risks / Opportunities (i.e. productivity, safety, health, environmental, weather etc)
Done correctly and completely, by the time the information contained in the Decision Support Packages has reached the point where project control departments are ready to start tracking and reporting physical progress on the project (i.e. during the Execution phase, Phase 5), most of the risks should have already been identified during the risk management activities carried out by the Owner. The Contractor does not usually get to see the risk elements previously identified by the Owner and as such needs to build the register with mainly “Execution Risks”.
As noted previously, what may be a risk for the owner may well prove to be an exploitable opportunity for the contractor? So while the templates used by owner and contractor are identical, what items they identify as “risks” or “opportunities” are likely to be very different.
Consistent with the Guild’s endorsement of relational and object oriented databases and the adoption of multi-dimensional WBS sorts, the Risks/Opportunities can also be sorted on any of the fields contained in the Risk/Opportunity Register, or if additional sorts are desired, (e.g. Systemic vs Project Specific Risks/Opportunities) new fields can be added, thus providing maximum flexibility in how the project team sorts, organizes and views their risks/opportunities.
04.3.3.07 - Risk / Opportunity Owner
Refer Column E in Figure 2 above - Consistent with the concept of accountability established when we established the Single Point of Contact (SPOC) for each control account, likewise we need to identify a single point of contact responsible to “own” each risk event. A perfect example of this is on many projects, we have appointed a Safety Officer who functions both as a safety auditor to watch our operations to ensure they are being done safely as well as a “subject matter expert” to provide expert advice and recommendations before the work is executed.
04.3.3.08 - Internal vs. External Risk / Opportunity
Refer Column F in Figure 2 above - Also important that we know and understand the difference between INTERNAL and EXTERNAL risks or opportunities.
- INTERNAL opportunities or risks are those over which we have some reasonable control. Things like productivity, optimized work flows, appropriate number of cranes or other pieces of equipment etc.
- EXTERNAL risks or opportunities are those over which we have little or no control over. These include the weather, market prices for materials or whatever product our project is going to be producing, politics or currency fluctuations.
It is important we identify and fill in all this information as we go as project controllers are going to need this information to help us provide expert analysis and advice to the project team and other key stakeholders as to how we are going to prepare for and eventually respond to risk events if they happen and opportunities if they present themselves.
This portion of the risk identification applies to both owners and contractors alike. The danger is in the event that an owner pushes an external risk onto the contractor that the contractor has no better chance than the owner or in some cases, a worse ability to manage that risk. Material price increases are one of those external events that neither party has control over, yet owners are quick to try to pass this along to the contractor. This is why we are seeing a move towards more risk sharing in contracts. (See Module 5- Managing Contracts for a more detailed analysis).
04.3.3.09 - Systemic vs. Project Risk / Opportunity
For those who follow the work of Buerty or AACE’s RP’s et al, this could also include Systemic Risks/Opportunities or Project Specific Risks/Opportunities or if desired, another column could be added to the Risk Register where we could capture this information.
Because risk is identified in terms of "cause-risk-impact", the risk identification activity described above accounts for project-specific risk (an artifact of the project) which is duly recorded in the project risk register. Project Risk Registers have been used extensively for many years but they suffer from a number of flaws of which the assumption of independence between risk events is a major one. Row-based lists of risks do not account for the interaction between risks, for example, the occurrence of one risk exacerbating other risks or portfolios of risks being more significant than the sum of the individual risks. This leads to the need to consider “risk systemicity” as a part of risk identification and analysis.
- According to Buertey, systemic risk accounted for more than 66% of the cost drivers related to construction cost uncertainty (Buertey, J.I.T., (2014), Project Cost Risk and Uncertainties: Towards a Conceptual Cost Contingency Estimation Model. International Journal of Construction Engineering and Management. 3(5): p. 144-155)
Systemic risk is an attribute of the project or process system e.g. the level of scope definition, process technology, and project complexity (Hollmann, J.K., (2007), Driver-Based Contingency Estimating)- (Figure 7). The AACE defines systemic risk as “uncertainties (threats or opportunities) that are an artifact of an industry, company or project system, culture, strategy, complexity, technology, or similar over-arching characteristics” (AACE, (2015), 10S-90: Cost Engineering Terminology)
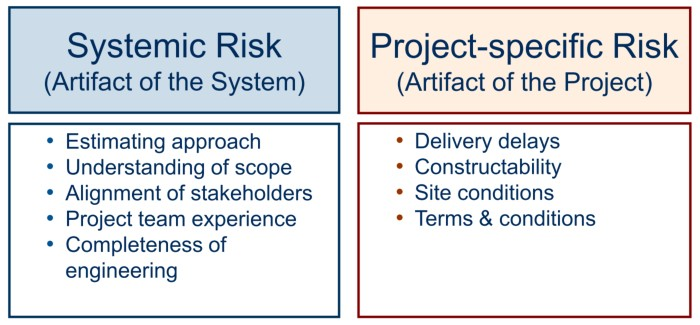
Figure 7 - Systemic Risk vs Project Risk
Source: Hervert, L., (2011), Contingency Risk Estimating Model)
The risk register therefore needs to include not only project specific risks, but also systemic risks that may affect all projects in the organization. Several tools and techniques have been developed to assist in the identification and analysis of systemic risk within the construction, process, infrastructure and process industries. An example of one such technique is the Project Definition Rating Index (“PDRI”) published by the Construction Industry Institute (“CII”).
04.3.4 - OUTPUTS
RISK REGISTER CONTAINING...
- WBS CODE
- RISK EVENT NAME
- RISK TRIGGER OR EARLY WARNING SIGN
- RISK TYPE
- RISK OWNER
- INTERNAL RISK OR EXTERNAL RISK
- OTHER RISK TEMPLATES
OPPORTUNITY REGISTER CONTAINING...
- WBS CODE
- OPPORTUNITY EVENT NAME
- OPPORTUNITY TRIGGER OR EARLY WARNING SIGN
- OPPORTUNITY TYPE
- OPPORTUNITY OWNER
- INTERNAL RISK OR EXTERNAL OPPORTUNITY
- OTHER OPPORTUNITY TEMPLATES
04.3.5 - REFERENCES & TEMPLATES
- US Federal Aviation Administration Risk Management Handbook (2009)
- NASA Risk Management Handbook (2011)
- Jardine, Scott Pricewaterhousecoopers (2007) Managing Risk In Construction Projects
- University Of Adelaide (N.D.) Risk Management Handbook
- US Dept Of Transportation (2013) Transportation Risk Management: International Practices For Program Development And Project Delivery
Templates
- Imperial College- London
- Australian Capital Territory Insurance Authority
- California Dept Of Transportation (Caltran) (2012) Project Risk Management Handbook- A Scalable Approach
04.4 - Module 04-4 - Assess, Prioritize and Quantify Risks / Opportunities
04.5 - Module 04-5 - Risk / Opportunity Response Strategies and Tactics
04.6 - Module 04-6 - Risk / Opportunity Monitoring and Control
GPCCAR M04-3 - Identify Risks & Opportunities, Revision 1.00