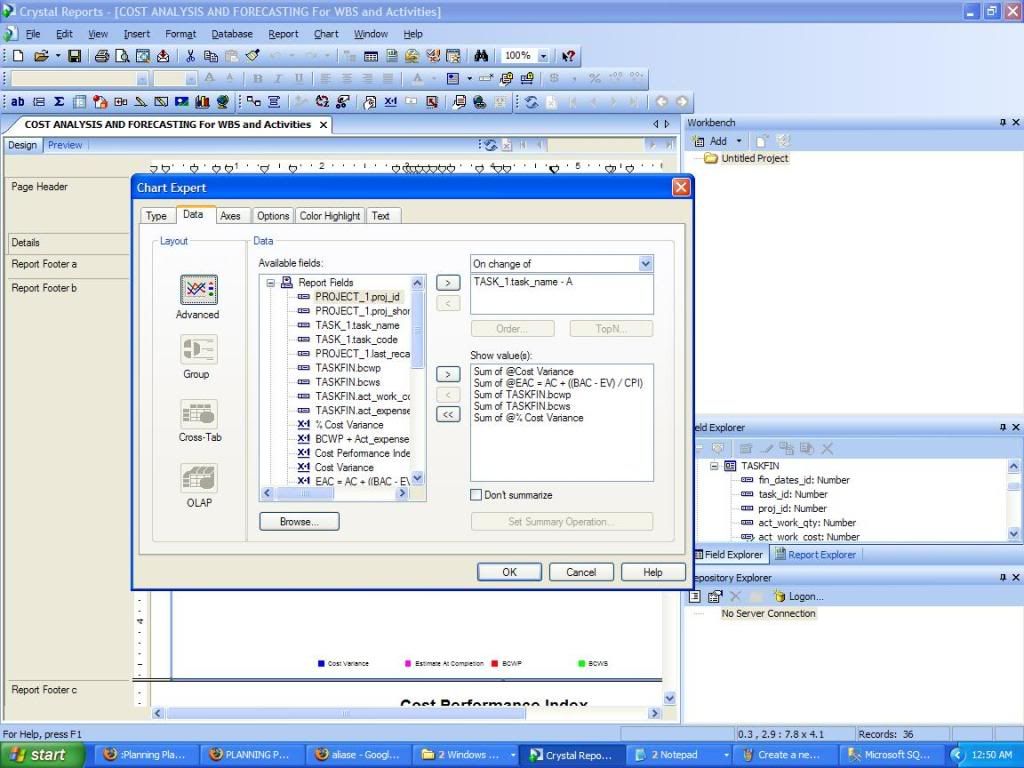
The first tab allows you to select the type of chart. Choose Bar, and on the right side of the screen, choose the specific type of bar chart (e.g. side-by-side, stacked bar, etc.).
On the second tab, you define the data for the graph (Figure 9). You need to provide two definitions. For the first definition (the On change of label), you need to define the division and subdivision. The division for a bar chart is the X-Axis definition (each month), and the subdivision includes any groupings within each month (the cost categories). So drag the two data columns that represent the month and cost categories into the On change of section. The second definition (show value) represents the actual data that Crystal Reports will chart, so drag the data column that contains the actual numeric data into the Show value(s) section.
This Summary Report Contains EV Periodic Progress % & Cumulative Progress %. This Report is based on Fin Period Work Perf: Earned value for the Project in the period.
Member for
17 years 1 month
Member for17 years1 month
Submitted by Jose Ramirez on Fri, 2009-10-02 02:52
Here is my first Earned Value Report With Crystal Report 11.2 and Primavera...Wow its easier to make this in Excel..lol..This is just a test. Let me know what else i should do to add a little more oomph!!! This is also a test project n i havent started anything on this project....
Hey Arnold, Thank you so much...Yeah, def. this is what i was looking for. I dont know why i didnt used this .xls file for this purpose. I have had this xerFileParserBuilder.xls for while and i never thought about using it to see what info. the columns on the tables contained. thank you again, and now back to making my report...
I would suggest using the “PATTLNK_632006_536-xerFileParser&Builder” in order for you to find easily what you really want and this is only intended for individual project. You can download it here:
Member for
17 years 1 monthRE: Earned Value Report With CRYSTAL REPORT 11.2
The first tab allows you to select the type of chart. Choose Bar, and on the right side of the screen, choose the specific type of bar chart (e.g. side-by-side, stacked bar, etc.).
On the second tab, you define the data for the graph (Figure 9). You need to provide two definitions. For the first definition (the On change of label), you need to define the division and subdivision. The division for a bar chart is the X-Axis definition (each month), and the subdivision includes any groupings within each month (the cost categories). So drag the two data columns that represent the month and cost categories into the On change of section. The second definition (show value) represents the actual data that Crystal Reports will chart, so drag the data column that contains the actual numeric data into the Show value(s) section.
Hope this answers your Q
Member for
17 years 1 monthRE: Earned Value Report With CRYSTAL REPORT 11.2
i got it now...
my problem now is to have a crosstab report, if that’s how it’s called.
this is how i want it to look like.
-------------------- (dates) ------ 2/12 ------ 2/19 ------- 2/26 -------- 3/5
ACTUAL COST
CUMM ACT COST
BUDG COST
CUMM BUDGE COST
and make a graph out of this..
thanks again in advance...
Member for
17 years 1 monthRE: Earned Value Report With CRYSTAL REPORT 11.2
when i try to link primavera database to ms access and run query of dbo.TASK, nothing comes out. When i run dbo.PROJECT i see all the projects...
I am hoping for some help. Thanks in advance
Member for
17 years 1 monthRE: Earned Value Report With CRYSTAL REPORT 11.2
Member for
17 years 1 monthRE: Earned Value Report With CRYSTAL REPORT 11.2
SPI: (SCHEDULE ANALYSIS AND FORECASTING
EVM Performance)
Member for
17 years 1 monthRE: Earned Value Report With CRYSTAL REPORT 11.2
This Summary Report Contains EV Periodic Progress % & Cumulative Progress %. This Report is based on Fin Period Work Perf: Earned value for the Project in the period.
Member for
17 years 1 monthRE: Earned Value Report With CRYSTAL REPORT 11.2
Here is the Real Ver.
Member for
17 years 1 monthRE: Earned Value Report With CRYSTAL REPORT 11.2
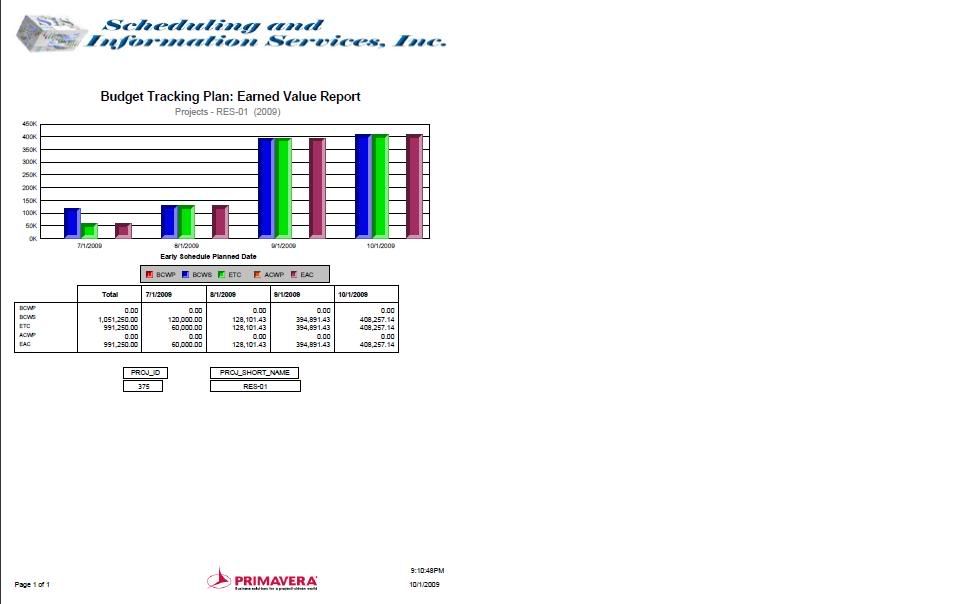
Here is my first Earned Value Report With Crystal Report 11.2 and Primavera...Wow its easier to make this in Excel..lol..This is just a test. Let me know what else i should do to add a little more oomph!!! This is also a test project n i havent started anything on this project....
Member for
18 years 6 monthsRE: Earned Value Report With CRYSTAL REPORT 11.2
Hi Jose,
dbo.TASKFIN & dbo.TASKSUMFIN are different tables but the content are related to one another.
For more details and explanation please check below for documentation:
C:\Program Files\Common Files\Primavera Common\PMSDK\Doc\GeneralTables&Fields.htm
Regards,
Arnold
Member for
17 years 1 monthRE: Earned Value Report With CRYSTAL REPORT 11.2
Hey Arnold,
when you typed this (1. dbo.TASKFIN) you meant--> dbo.TASKSUMFIN (correct)...just checking...
Member for
18 years 6 monthsRE: Earned Value Report With CRYSTAL REPORT 11.2
Hi Jose,
You are most welcome.
Regards,
Arnold
Member for
17 years 1 monthRE: Earned Value Report With CRYSTAL REPORT 11.2
Hey Arnold, Thank you so much...Yeah, def. this is what i was looking for. I dont know why i didnt used this .xls file for this purpose. I have had this xerFileParserBuilder.xls for while and i never thought about using it to see what info. the columns on the tables contained. thank you again, and now back to making my report...
Member for
18 years 6 monthsRE: Earned Value Report With CRYSTAL REPORT 11.2
Hi Jose,
I would suggest using the “PATTLNK_632006_536-xerFileParser&Builder” in order for you to find easily what you really want and this is only intended for individual project. You can download it here:
http://knowledgebase.primavera.com/attachment/PATTLNK_782008_1412-xerFi…
Regarding to your query, you can find the list of the above mainly in the following:
1. dbo.TASKFIN
2. dbo. TASKRSRC
3. dbo.TASK
Hope this helps.
Regards,
Arnold