Can aonyone help ,
I am trying to create a filter for tasks that have slipped at a specific progress period but cant work out how to do this.
Can ayone advise?
Thanks
Chris
Can aonyone help ,
I am trying to create a filter for tasks that have slipped at a specific progress period but cant work out how to do this.
Can ayone advise?
Thanks
Chris
hmmmm
Another option would be to use diagrams and tabular reports to show Start & Finish Variance Trends [slippage] directly from your software [if it can]. For data transfer just select the schedule versions and click. This without using formulas, no need for user defined fields, the software do it all for you.
If using activity calendar days it gets bit tedious and complicated.
Better do it within the software.
If everything else fails I suggest using Excel. If after every update you add 2 new user defined fields to store version Start & Finish dates the copy-paste will be aligned, all prior and current version values will be available for exporting to Excel. Then you can filter and show your tables and charts.
After hiding/filtering some rows the chart becomes easier to read. In the following figure you can see Activity 3 Start trends among update versions.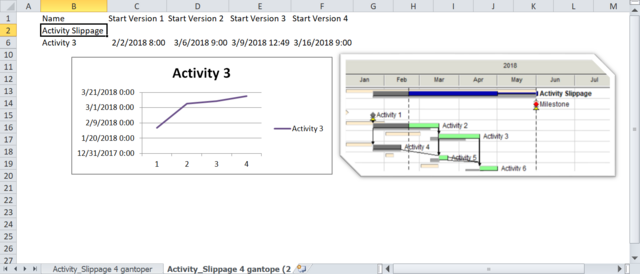
Consider additional columns such as responsibility to help you filter for fields of interest.
Link to Excel Start&Finish Trends Workbook
Chris,
Try right clicking images and selecting open image in new tab or save image. Also try downloading ZIP file from following link:
http://www.mediafire.com/file/xq4zk8j0h9ly99t/Activity_Slippage.zip/file
Let me know if not good enough, the images are screen captures.
Although my example was for months the procedure is not limited to months allowing for update period to span several months. Be warned that decimal values for Spider Project might differ for Asta, I still believe Asta PP can do it.
Note that before DD slippage will not be subject to any further change, after DD slippage is projected and can be subjected to further changes.
Any activity might be delayed because of action of others, there must be some contemporaneous analysis to understand and keep record of each delay.
Best Regards,
Rafael
Rafael,
I cant see those images can you show a different way?
Mike,
Im aware of looking at slippage at a single point in time. Was more how to compare between periods and how to trend slippage of activities.
Regards
Chris
Mike,
Slippage do matter as recognized by PennDOT, I suppose a London suburb. Asta PP must be doing something right.
http://www.dot.state.pa.us/public/pubsforms/Publications/PUB%20615.pdf
3.0.4.1- Time Management. Project managers must properly manage time to avoid schedule slippage and cost overruns.
Chris is going further, he is asking for a way to identify slippage period.
Mike I said something right, not everything.
Best Regards,
Rafael
Hi Chris
Asta has a Red Amber Green facility that will show slippage in a column for each task after each update which compares actual to planned progress.
Once you have established this you can filter on the results.
Alternatively you can compare the actual dates of a task with the as planned dates and show the difference negative or positive.
Again you can filter on that.
Best regards
Mike Testro
Please be reminded that CPM is not only about early dates, late dates do matter, and float does matter. As the schedule is updated it is not unusual for critical path to change as well as for available float.
Good luck with your endeavor.
I hope the following images can give you a clue on how to track slippage per period if using UDF, Formulas and a Script to automate order of formula execution.
If you are to use the procedure among several jobs I suggest using unique codes for UDF, Formulas and Scripts and transfer the tables in this sequence.
You can fine tune many details, for example instead of numbers for slippage period you can use a better descriptive label like Jan18, Feb18 ...
Good Luck,
Rafael
Ben,
Ive already tried support but they said it couldnt be done.
I think there must be a way though by using user defined fields.
Regards
Chris
Hi Chris,
This can likely be done in several ways, as for example a column can be restricted to show the data purely from a specificed Progress Period - and you can add a number of columns for the same field to the spreadsheet at once, each with a different condition. So you could have multiple columns showing the slip per progress period all set up on screen.
Or you could use formula which will certainly be able to do this, or perhaps a multi-statement filter. Unfortuantely some of this is above my head (I only work in sales after all!). Can you fire the question instead at one of our support teams, depending on where you're based? For UK, it's support @ elecosoft. com
Thanks,
Ben
Maybe what you want to do can be done if progress periods are named under a user defined field [UDF], a second UDF used to identify start of activity progress period, a third UDF to identify finish of activity progress period. With the use of complex conditional formulas that will consider period start and finish dates the fields can be populated for each activity on baseline schedule as well as on current schedule. Then you should be able to compare current schedule values to baseline schedule values. If baseline start/finish differs to current schedule then there is slippage. Start/Finish slippage can happen within same period or slippage can be carried over to another period. You can still filter for slippage within same period as well as for slippage carried over to another period. This is kind of complicated.
Activity start might slip one period but still finish within next period, if scheduled finish was this second period activity start was delayed during first period but if finish happened during the second period as originally planned.
What most people do is simply show Baseline Bar as well as Baseline Start and Finish Dates within same Gantt view. As some say a picture spells a thousand words.
The procedure might need to be refined; this is a rough idea on how to tackle the issue within your software. I use different software so this is as far as I can go.
Wish you good luck.
Thanks but not sure what you mean
I have the slip column and can set these to show any of my progress periods. As these are effectively the same column I am not sure how I can create a user defined column and formula for these to give the difference in slippage i.e Slip current - slip previous. Then how to create an sql statement to apply a filter to show those that the slippage is increasing.
Thanks
Chris
Hi Chris,
Depends on your archiving strategy there are solutions.
* If you have an archive of all the updated schedules with attached baselines ( which I always recommend), it would be easy ( but time-consuming)
- Open the updated Xers one by one and filter on the variance BL-Actual greater than zero. Copy paste the list on excel and repeat for all updates. You will have a history of slippages. You can use excel, Code the slippage period for each activity in a user-defined code and use one single import/export to build the column which indicates the slip period.
* If you don't have access to the updates, hopefully, you are using financial periods and store period performance. In this case, you should use a user-defined code, calculate the slip from BL for each period, use another user-defined code and compare periods and create a filter on the result.
I hope it helps
Also a filter to show difference in slip between progress periods?