07.0 - MANAGING PLANNNING & SCHEDULING
07.1 - Module 07-1 - Introduction to Managing Planning & Scheduling
07.2 - Module 07-2 - Develop the Planning & Scheduling Policies & Procedures Manual
07.3 - Module 07-3 - Identify / Capture all Schedule Activities
07.4 - Module 07-4 - Create the Logical Relationships & Sequence Activities
07.5 - Module 07-5 - Assigning Resources to all Activities
07.6 - MODULE 07-6 - CALCULATE THE DURATION OF EACH ACTIVITY
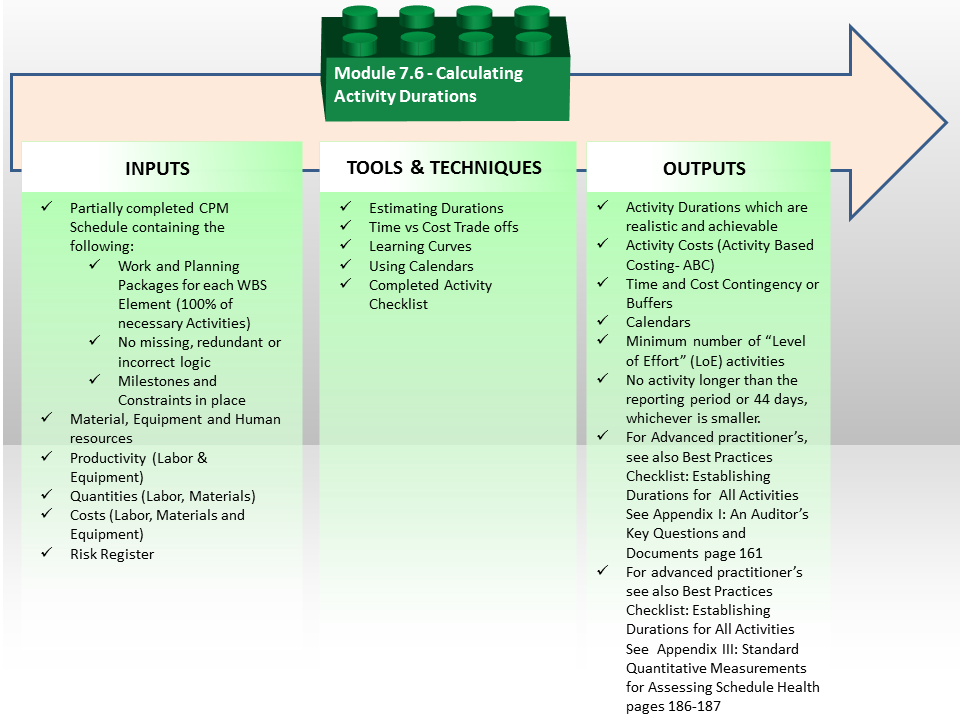
Figure 1 - Calculate the Duration of each Activity Process Map
Source: Guild of Project Controls
07.6.1 INTRODUCTION
Activity durations may be assigned a preliminary estimate when duration does not depend on assigned resources or may be calculated based on assigned resource productivity and activity volume (amount) of work to be done.
As explained above, ensure that activity durations match the planned period of the project reporting; for example, if the project requires you to analyze project performance weekly – activity durations should ideally not exceed one week.
Durations can be calculated using various methods:
07.6.2 INPUTS
Partially Completed CPM Schedule Containing The Following:
- Work And Planning Packages For Each Wbs Element (100% Of Necessary Activities)
- No Missing, Redundant Or Incorrect Logic
- Milestones And Constraints In Place
- Material, Equipment And Human Resources
- Productivity (Labor & Equipment)
- Quantities (Labor, Materials)
- Costs (Labor, Materials And Equipment)
- Risk Register
07.6.3 TOOLS & TECHNIQUES
07.6.3.1 Estimating Durations
(METHOD 1)
ANALOGOUS DURATION ESTIMATING
Which uses an analogy from similar projects; in this case, you will look into your records and pick the best projects which look similar to your project to find the approximate duration for your activity, using professional judgment in that choice.
Durations can be calculated very quickly but accuracy is low.
(METHOD 2)
PARAMETRIC DURATION ESTIMATING
Which is somewhat similar to analogous estimation because it also uses past records to compute the duration estimate. However, this approach uses historical data and factors the previously used duration up or down depending on the size of the current activity and your historical record.
This method is more accurate than the analogous estimation.
For more on how to use this method to calculate activity duration refer to 04.4.3.03 - PERT Formula (Project or Program Evaluation and Review Technique) Figure 26.
(METHOD 3)
THREE POINT DURATION ESTIMATING
Which is a probabilistic technique used to determine the approximate duration of an activity. It uses three time estimates to determine approximate average duration of an activity:
- Realistic / Most Likely: This is the duration used by an activity in most cases.
- Optimistic: This is the duration used by an activity in the most favorable case.
- Pessimistic: This is the duration used by an activity in a worst case scenario.
Duration estimates obtained by this method are more accurate than other approaches and reduce the chances of bias judgment and uncertainty affecting the project duration, as the durations come either from historic databases or by polling subject matter experts.
Once you determine these three estimates, you can calculate the PERT (Program Evolution and Review Technique) Time or Duration Estimate by using the formula: (Pessimistic + (4 x Most Likely) + Optimistic) / 6
For a Case Study on showing how to use PERT to calculate Durations refer to 04.4.3.03 - PERT Formula (Project or Program Evaluation and Review Technique) Figure 26.
(METHOD 4)
BOTTOM UP OR ACTIVITY BASED DURATION ESTIMATING
Which is when activity durations are calculated as once we know how many of each resource is available and what their productivity is. We can the produce an accurate, more reliable and realistic duration estimate. Simply “guessing” or using “average” productivity rates without giving any consideration to the risks, and other factors is less accurate and whenever possible all durations should be calculated as a function of the resource productivity and activity volume.
During the earlier step in the process we identified the two main drivers for activity durations; namely the volume of work to be undertaken and the productivity of the resource assigned to carry out the works. For example if the activity represented 500 CY or M3 of concrete the schedule activity might be loaded with the following resources:
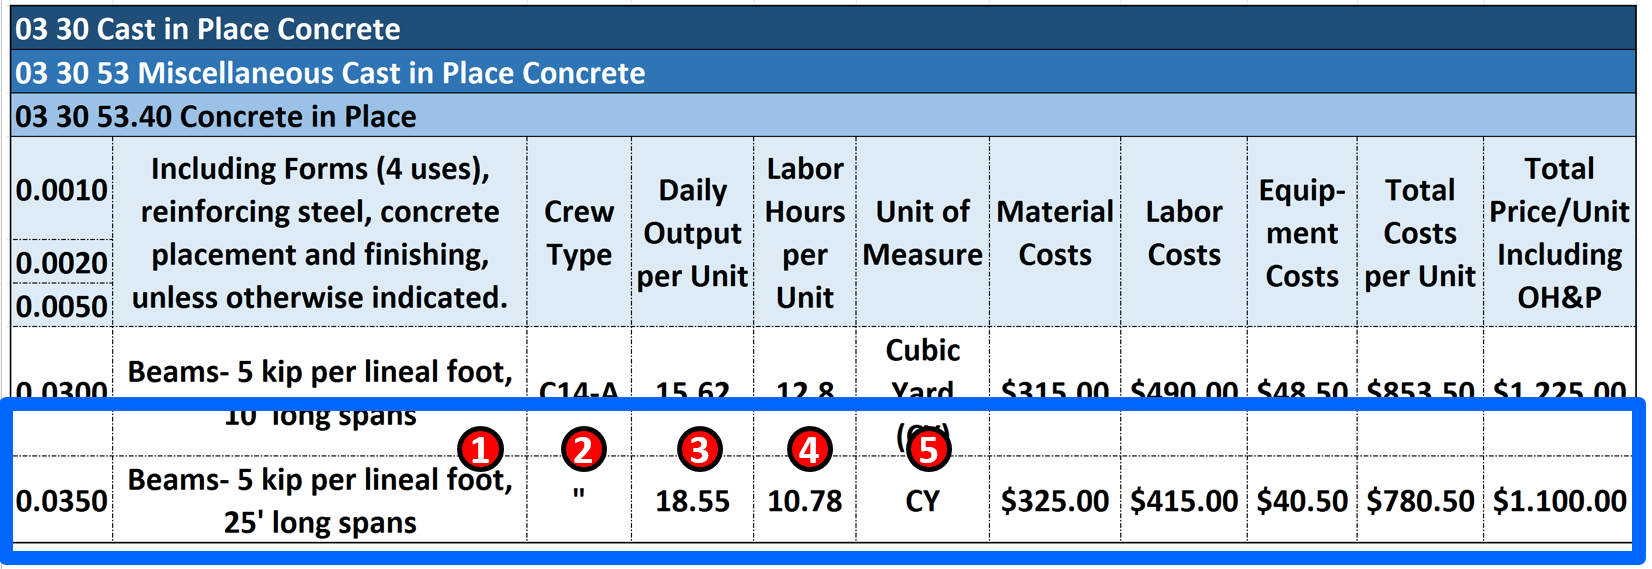
Figure 3 - Case Study Showing How to Use Database Information to Calculate Duration
Source: Giammalvo, Paul D (2015) Course Materials. Adapted from R.S. Means 2008 Facility Cost Estimating Database Crew C-14A. Contributed Under Creative Commons License BY v 4.0
(1) For an ACTIVITY called “Form, Pour and Strip 5 kip Cast In Place 25" Long Concrete Beams
(2) We use a STANDARDIZED Crew in this case, Crew C-14A (See Figure 3 below to see the composition of this crew)
(3) An average DAILY OUTPUT for Crew C-14A of 18.55 Cubic Yards per day
(4) Each Cubic Yard consumes or requires 10.78 crew hours
(5) The unit of measure is Cubic Yard (CY) but it could be Cubic Meters or any other relevant measurement
GIVEN we know from the Bill of Materials or Quantity Take Off that these beams require 500 Cubic Yards of Concrete there are two approaches we can take to calculate the DURATION:
Approach (1)
DIVIDE the 500 CY/ 18.55 Daily output = 26.95 rounded to 27 days duration using Daily Output
Approach (2)
There is a second way to determine activity duration using Crew Hours
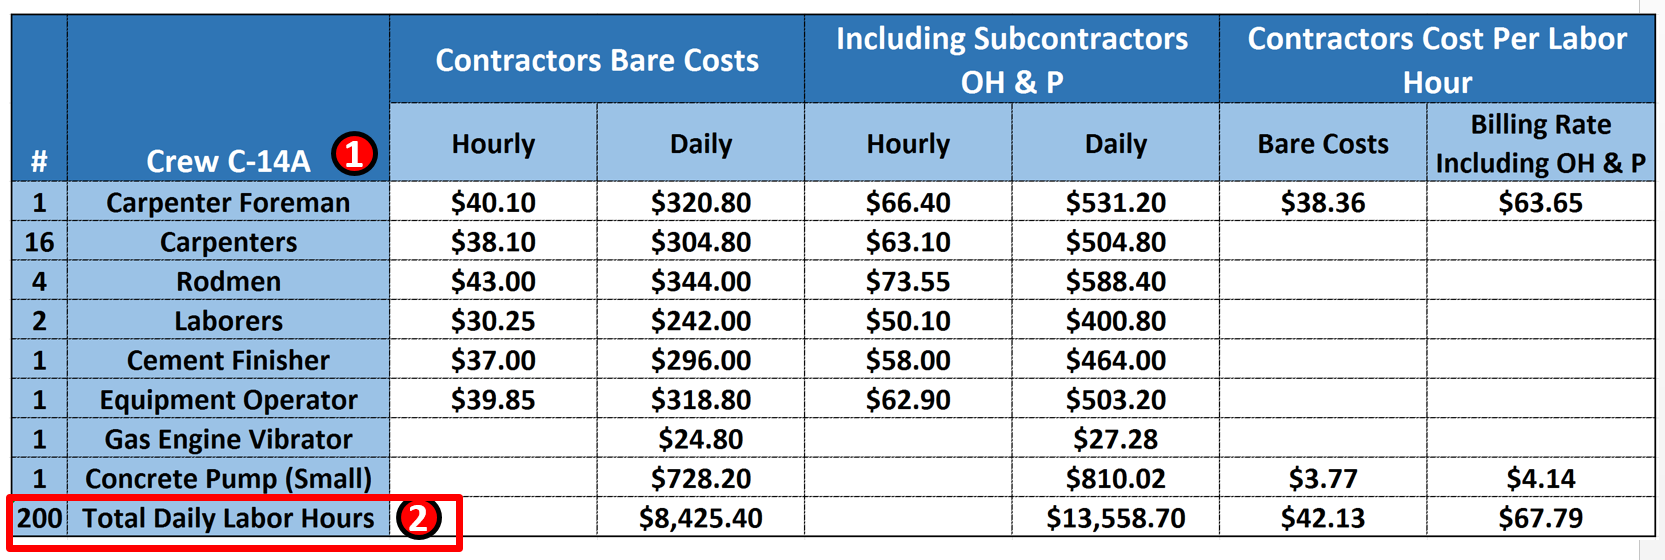
Figure 4 Using Standardized Crew Labor Hours to Calculate Duration
Source: Giammalvo, Paul D (2015) Course Materials. Adapted from R.S. Means 2008 Facility Cost Estimating Database Crew C-14A. Contributed Under Creative Commons License BY v 4.0
(1) We can see the composition of STANDARDIZED CREW C-14A
(2) MULTIPLY 500 CY X 10.78 Hours / CY = 5,390 crew hours total effort then
(3) DIVIDE by the number of crew hours scheduled to be worked each day (see Calendars). In the case study above, there are a total of 25 people working an 8 hour day. 25 people X 8 hours per day = 200 hours. 500 CY X 10.78 Hours / CY = 5,390 crew hours / 200 = 26.95 days rounded to 27 days.
- We would be most likely to use this method if, for whatever reasons, the actual crew size being used in the field contained more or less people than the standardized crew as shown above.
Keep in mind that this is an average value (P50) so to that we have to add in any contingency calculated from Module 4 - Managing Risk & Opportunity.
We also have to adjust for jobsite conditions as well as learning curve. This topic will be explored in more detail in Module 8 - Managing Cost Estimating & Budgeting.
07.6.3.2 Time vs Cost Trade-Offs
There is also a strong correlation between duration and cost, which supports the premise that scheduling and cost estimating need to be fully integrated, either through training to develop planners/schedulers or cost estimators/quantity surveyors into project control practitioner or by assigning schedulers and cost estimators/quantity surveyors to work together on the same project.
- What the planner/scheduler and cost estimator/quantity surveyor need to do is to facilitate a schedule meeting with key stakeholders to explain that rarely are the schedules and costs optimized at the same point. Which means that for any project where COST is more important than SCHEDULE we would use the “normal” durations, whereas if TIME is more important that COST (which is often the case for many owner organizations) then the "optimum" duration means higher COSTS.
The objective of such a time-cost trade-off analysis is to reduce the original project duration, determined form the critical path analysis, to meet a specific deadline, with the least cost (the same can be done when an in-progress project is looking to accelerate a completion date).
The costs associated with a project, or an activity, can be classified as direct costs or indirect costs.
- Direct costs are those directly associated with project activities, such as manpower wages, materials and equipment. If the pace of activities is increased in order to decrease completion time, the direct costs generally increase since more resource must be allocated to accelerate the pace. The planner / scheduler also needs to be aware that whilst five installers may be able to complete an activity in ten days, it may take 15 installers to complete the same activity in five days, hence the direct cost would be 75 days wages rather than 50. So planners / schedulers need to be aware that there are cost and time trade-offs to be considered and discussion with the cost estimator/quantity surveyor is beneficial as "Quicker is not always Cheaper".
- Indirect costs are those overhead costs that are not directly associated with specific project activities such as office space, electricity and rentals etc. Such costs tend to be relatively steady per unit of time over the life of the project. As such, the total indirect costs decrease as the duration decreases.
The project cost is therefore the sum of the direct and indirect costs.
The time required to complete a project is determined by the critical path, so to compress a project schedule the planner/scheduler and cost estimator/quantity surveyor must focus on critical path activities and the activities having the lowest cost per unit of time reduction should be shortened first.
In this way, the planner/scheduler and cost estimator/quantity surveyor can work through the critical path activities and examine the cost versus the project time. The indirect, direct, and total project costs then can be calculated for different durations and the optimal point is the duration resulting in the minimum project cost, as show in Figure 2 below.
Attention should be given to the critical path to make sure that it remains the critical path after the activity time is reduced. If a new critical path emerges, it must considered in subsequent time reductions.
It should also be noted that in order to minimize the cost, those activities that are not on the critical path can be extended to minimize their costs without increasing the project completion time and as practitioners we have an obligation to perform this analysis and communicate it clearly to our stakeholders, especially during the early planning phases.
There are other considerations besides project cost. For example, when the project is part of the development of a new product or facility, timetomarket may be extremely important and it may be beneficial to accelerate the project to a point where its cost is much greater than perhaps the ascertained minimum cost. There may also be incentive payments associated with early completion or penalties associated with late completion which also need to be considered etc.
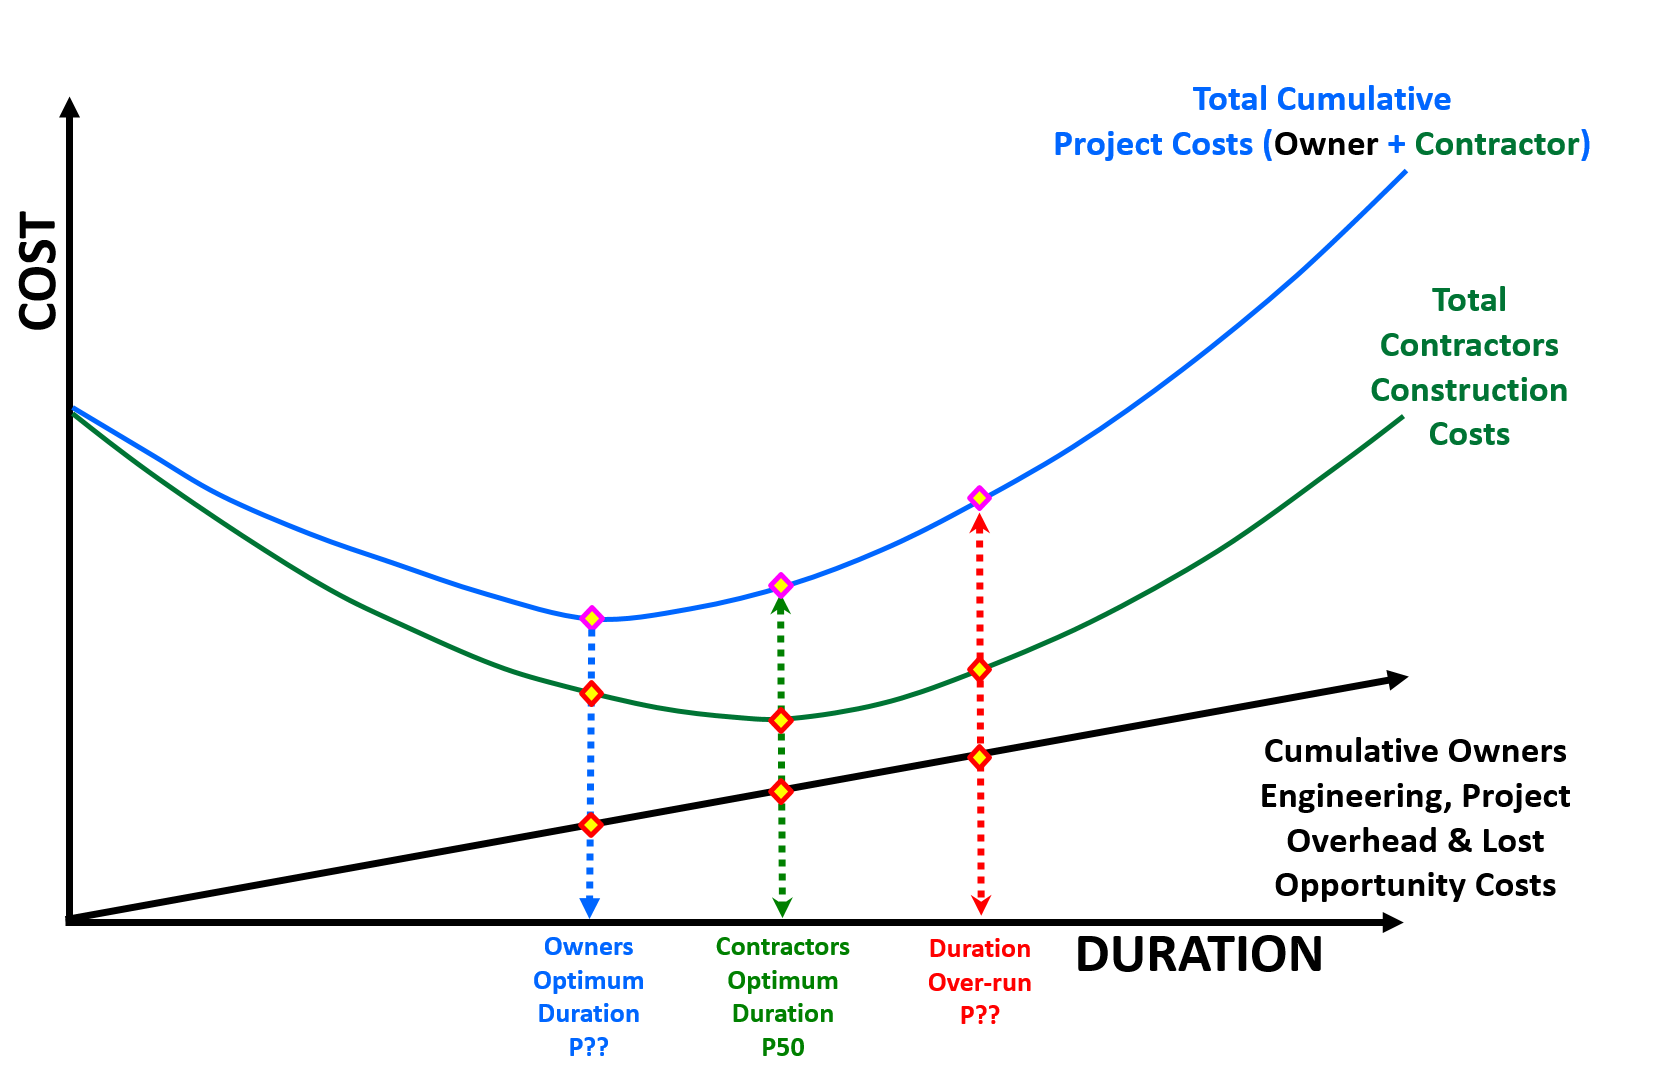
Figure 2 - Showing the Normal and Optimized Cost vs Time Trade Offs
Source: Work Zone Road User Costs Concepts and Applications (2011)
Additional references on this topic are:
- Joe Martin, Theresa Keoughan Burrows And Ian Pegg (2006)
- A. Czarnigowska And A. Sobotka (2013) Time – Cost Relationship For Predicting Construction Duration
- Ammar Kaka & A. D. F. Price (1991) Relationship Between Value And Duration Of Construction Projects
07.6.3.3 Learning Curves
Knowing and understanding how learning curves impact durations is another “tool and technique” that planners/scheduler can utilise to produce more realistic and achievable schedules. It can be used for durations as well as for costs.
It is applicable whenever there is a single activity or series of activities (“fragnets”) which repeat on a project. Examples of this are repetitive floor layouts in a hotel or high rise office building, installing pipelines, hanging doors, installing electrical lighting or any other activity or series of activities which repeat. What learning curves help us do, is knowing how long the first activities are scheduled to take, we can then apply a sound mathematical formula to justify what the subsequent durations are likely to be.
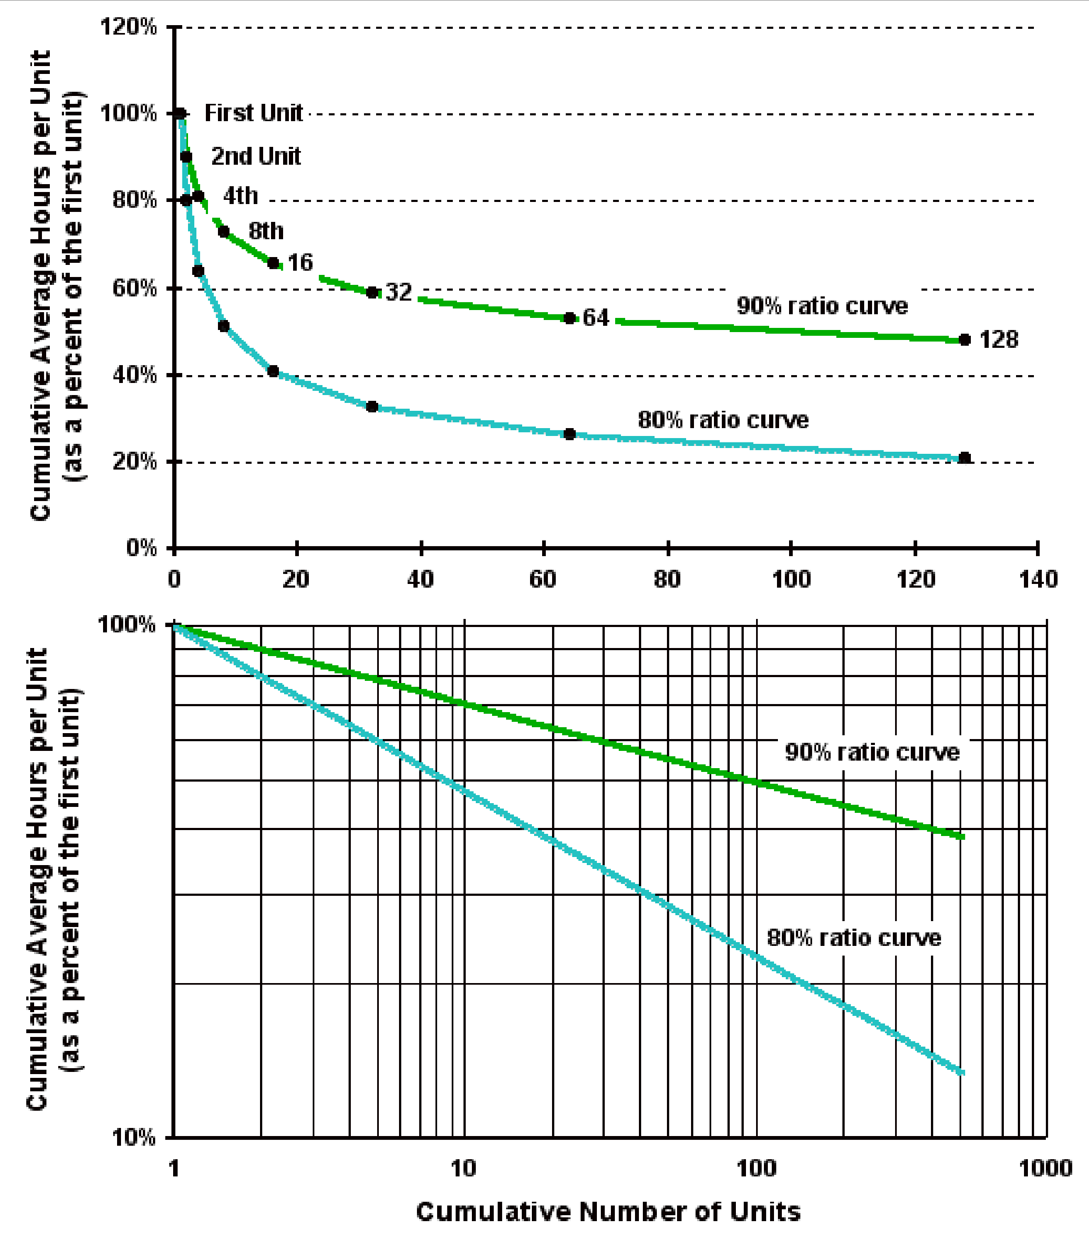
Figure 3 - Learning Curves Explained
Source: Wideman, Max (n.d.) Learning Curve Theory
Whilst many planners / schedulers introduce a slower production rate (say 40 or 50% productivity) for the initial periods or instances for any repetitive operations, a more sound, professionally justifiable approach can also be adopted and applied to the initial periods or instances of the repetitive operations.
The theory behind this is that a learning curve is geometric distribution with the general form “Y = aXb” where:
- Y = cumulative average time per unit or batch.
- a = time taken to produce initial quantity.
- X = the cumulative units of production or, if in batches, the cumulative number of batches.
- b = the learning index or coefficient, which is calculated as: log learning curve percentage ÷ log 2. So b for an 80 per cent curve would be log 0.8 ÷ log 2 = – 0.322.
As we can see from Figure 2 above, we can plot the curve easily using Excel or we can plot it manually using log log paper to generate a straight line.
Explained very simply:
- The first time we execute the activity takes us so many minutes, hours or days.
- The second time we execute the activity, it only takes us between 80% to 90% of the time it took us to do it the first time.
- The fourth time we do the activity, it only takes us between 80% to 90% of the time it took us to execute the activity the 2nd time and so on.
Each time we double the number of times we execute the activity, the time it takes (the number of time periods required) is reduced anywhere between 10% (90% Learning Curve) to 20%. (80% Learning Curve)
As noted, there are two approaches, using units of production or batches and even though the formula is identical. The planner / scheduler can experiment to see which method yields the most accurate results for any specific application.
As this tool & technique is applicable to both time and cost, it is an important one for all project control professionals to master, here are recommended supplemental references:
- Bhatti, Ahmad Tariq (2012) Learnign Curve
- Brookfield, Bill (2005) Management Accounting – Decision Management
- Mirsau, Allen (2014) Video 1 and Video 2
07.6.3.4 Using Calendars
The two most common ways to use calendars is to provide instructions to the field and to get actual performance data back from the field. Especially when working in the developing nations, the field foreman and superintendents may well not understand how to read Gannt Charts. Therefore, one of the most powerful ways to use the "Calendar view" is to send out Weekly or Monthly task assignments:
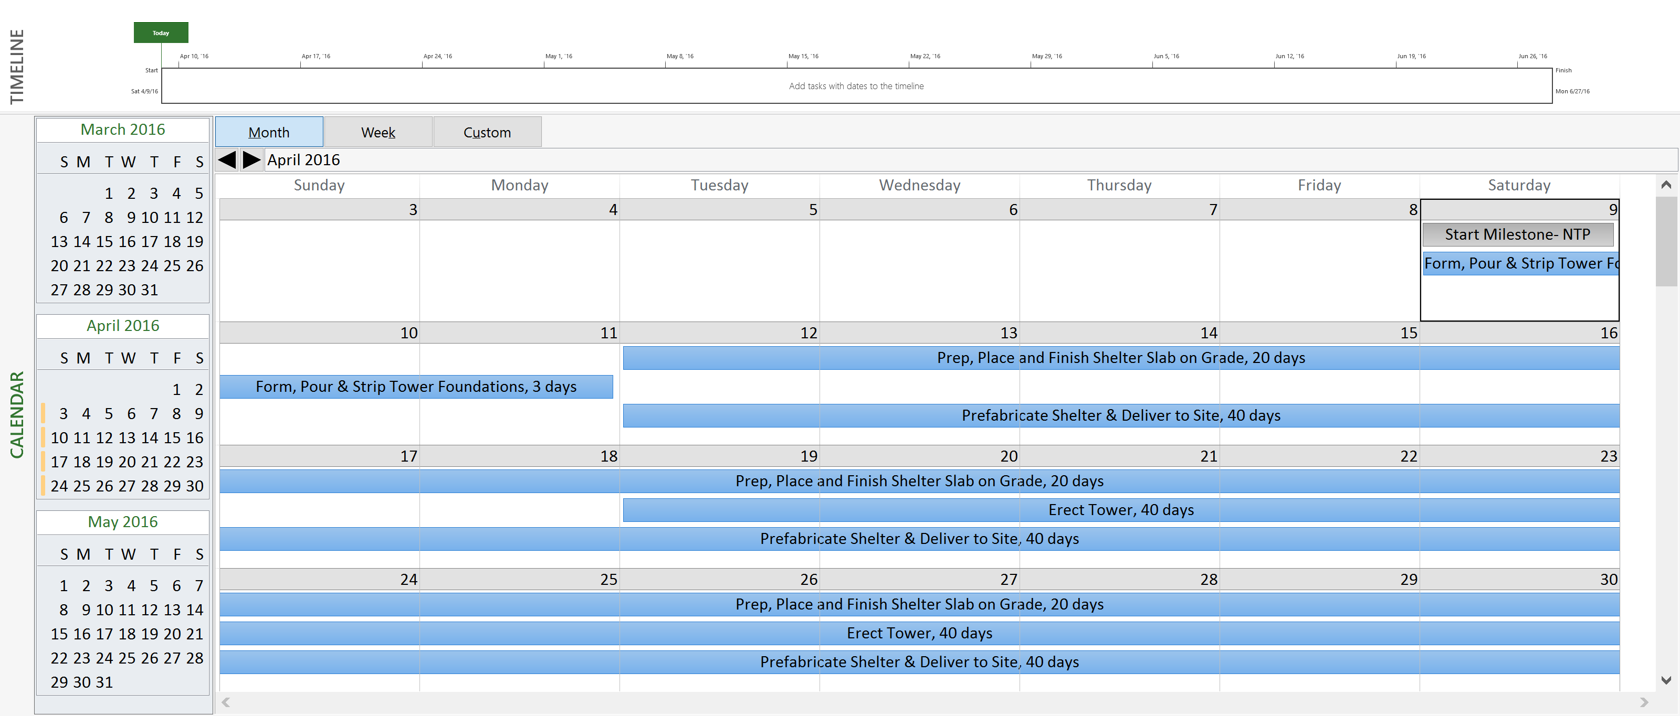
Figure 4 - Showing the Calendar View (MS Project 2013)
Source: Microsoft Project (n.d.)
This has proven to be a very powerful and effective tool to get the field / site people to provide timely and accurate information from the field to the planner/scheduler. This will be covered in more detail in Module 9 - Managing Project Progress.
Define and set working calendars to the project activities and resources:
- Calendars define the standard work week and exception periods when the work week is not standard (i.e. holidays, vacations, short working days, etc.).
- Calendars that reflect non-work periods based on weather, permit requirements or other regulatory issues will assist the project team in effectively modeling the effect of these issues on the project without the unnecessary use of activity constraints.
- It is not unusual for a project to have multiple calendars for this purpose. In practice the use of multiple calendars contribute to a higher level of difficulty in analysis, so calendar use should be limited to the need and not employed for risk, contingency, or float sequestration.
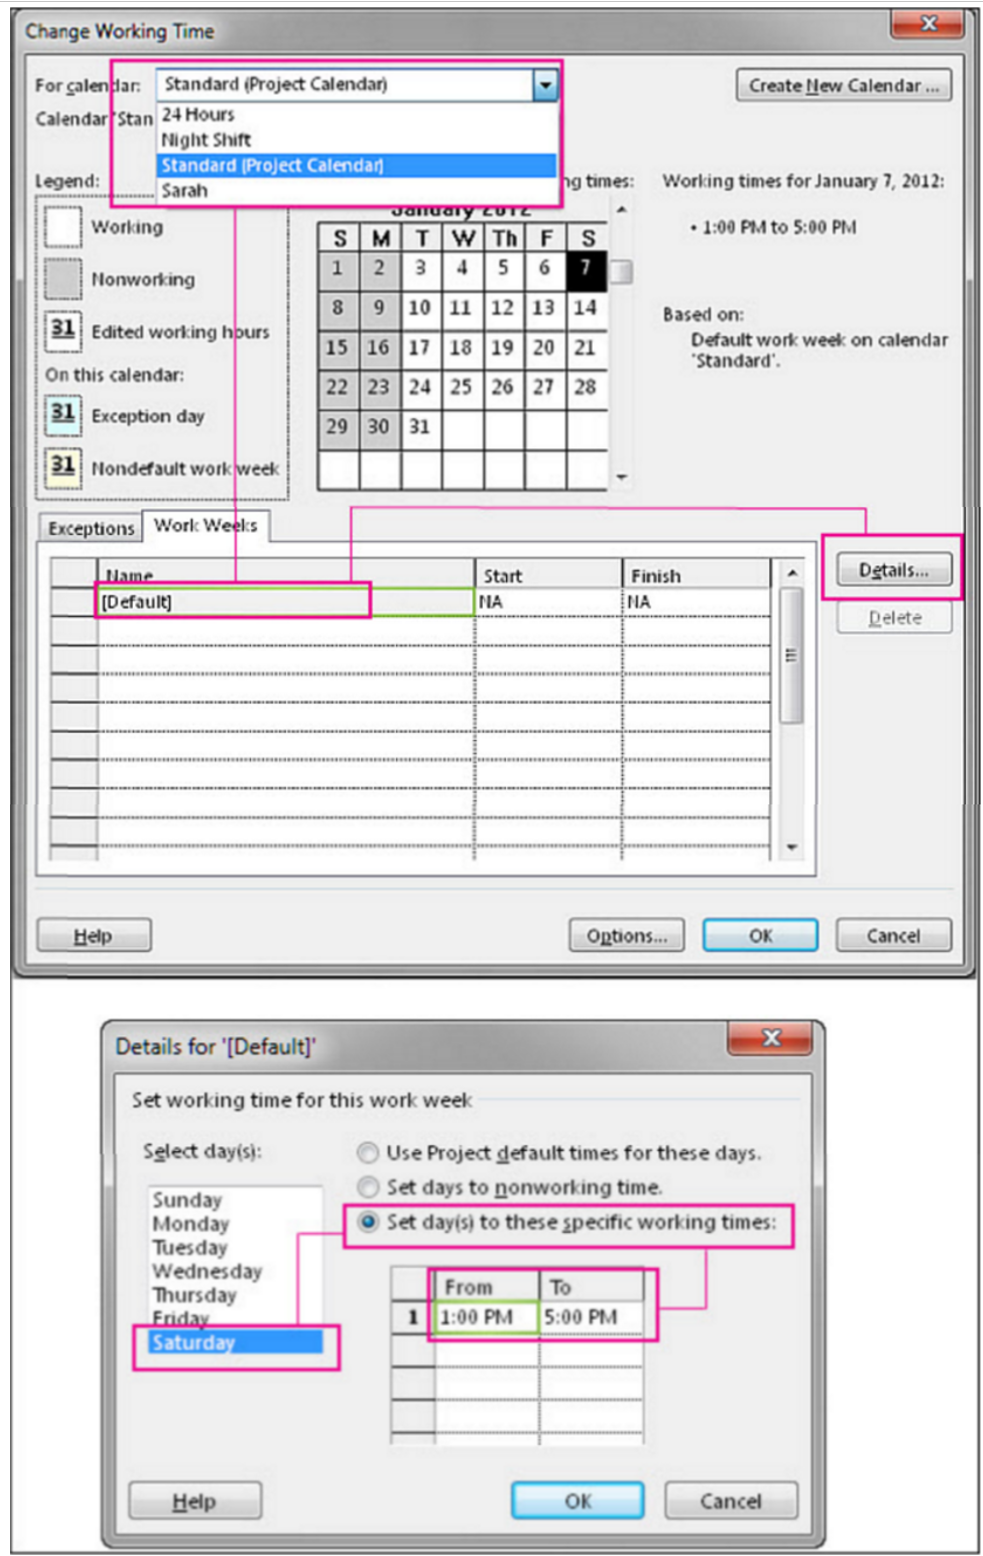
Figure 5 - Setting Work Hours, Work Days, Holidays Typical to Most Scheduling Software Packages
Source: Simon Sez (2013) Assigning Resources in MS Project
It is important to the planner/scheduler to know how to use the calendars to set working time, vacations and holidays. Unfortunately, in far too many cases, planners/schedulers totally ignore the calendars and then wonder why their schedules are always running late. This is particularly important when working in a different country that you not only find out the working hours per day (i.e. in some of the Middle Eastern countries you cannot work your people during the hottest hours of the day) in some countries, the work week runs from Sunday through Thursday and not Monday through Friday as of often the case. These are important pieces of information the planner/scheduler need to know and understand when initially setting up the schedule.
Once again MS Project was used as the example in Figure 4 above for no other reason than it is so common, however all the major scheduling software packages have similar screens where you set the working hours per day, work days per week, holidays, vacations and other time related constraints.
Below are some additional references to help you better understand how to create or modify the calendars in the more popular or common CPM Scheduling software packages. While you will not be tested on any specific software, you are likely to see generic questions about what is typically included and how you would use the calendars.
07.6.3.5 Activity Attribute Checklist
- In order to realize the full capability of our scheduling software, it is essential that all our activities are checked and validated to see if they are "complete".
This step is an essential “quality control” step before we can start to actually analyse our schedule for the critical path, float calculations and for simulation purposes.
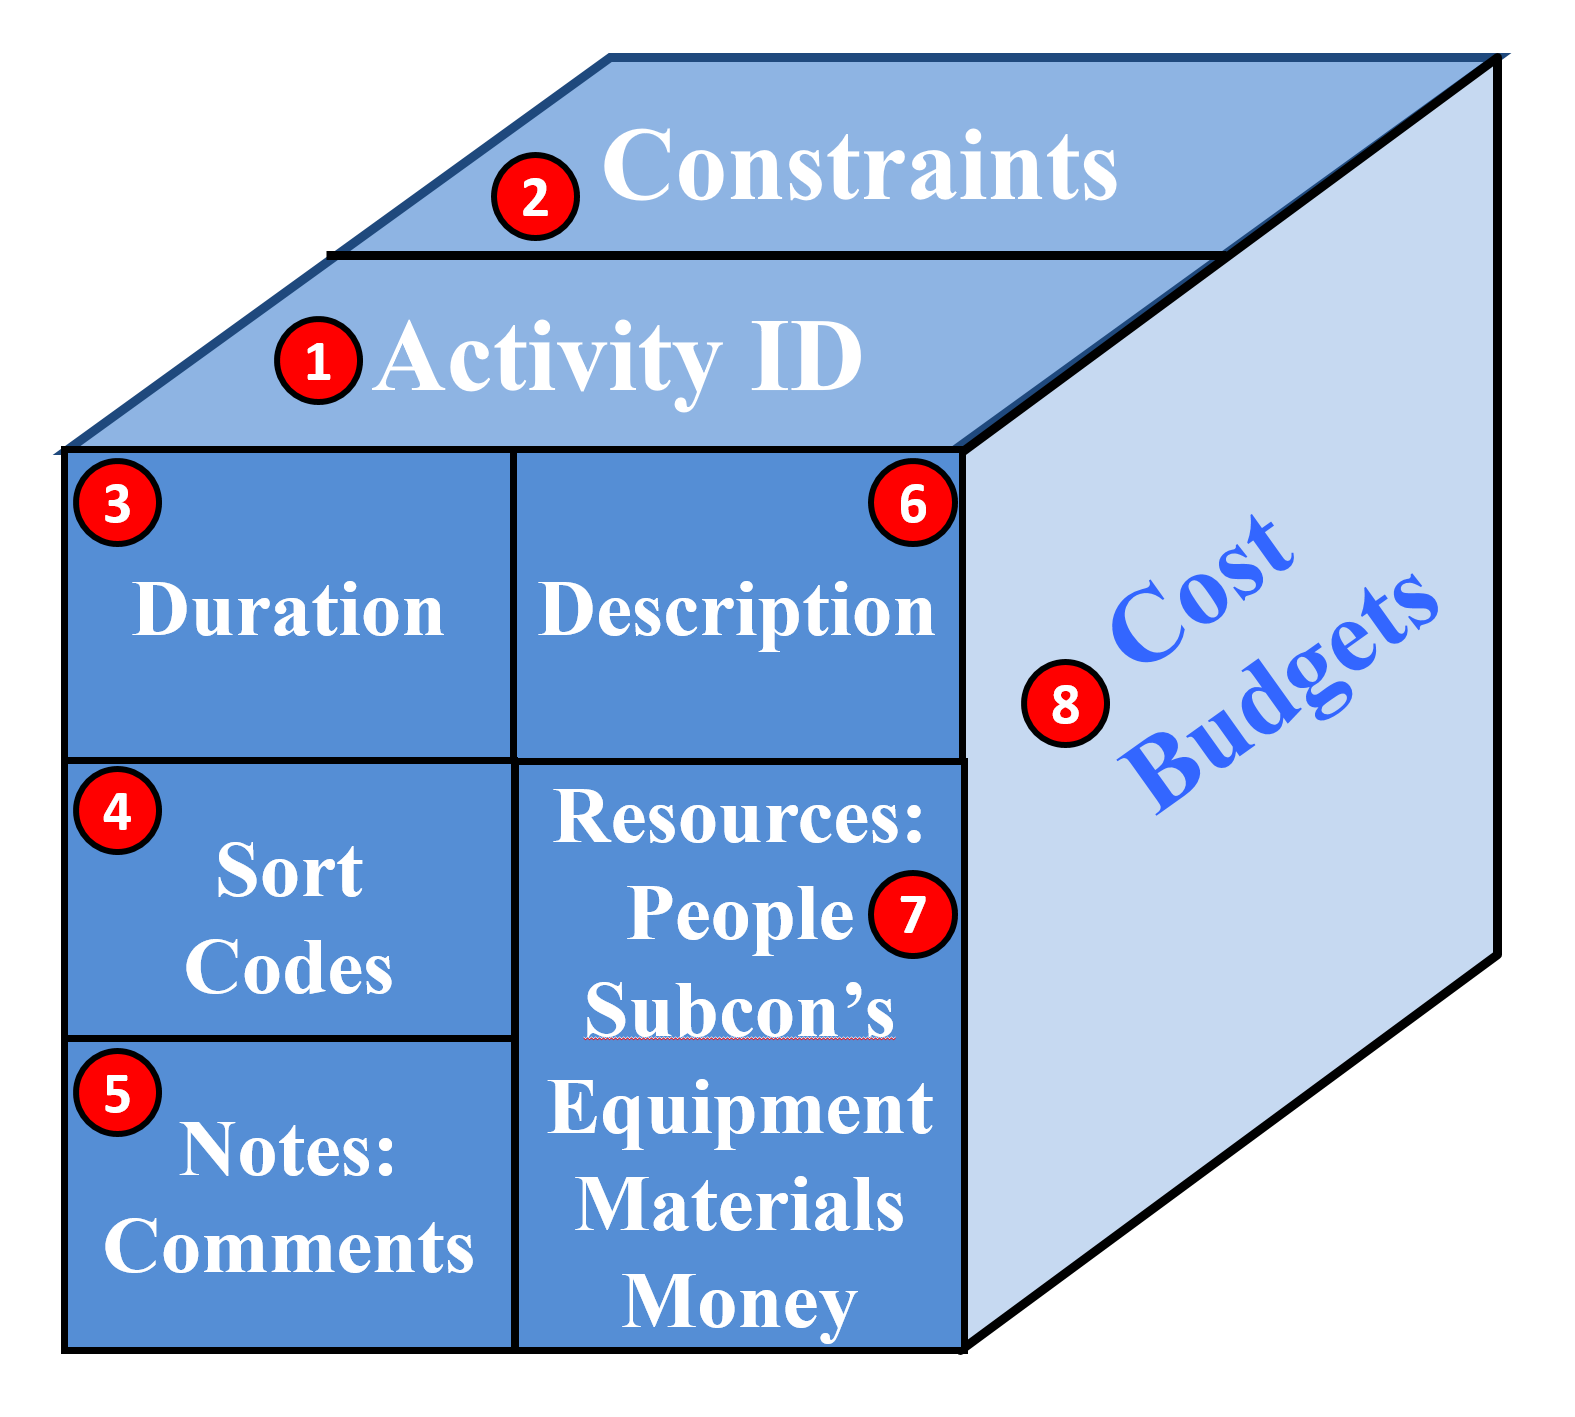
Figure 6 - Elements which Comprise a Complete Activity
Source: Giammalvo, Paul D (2015) Course Materials. Contributed Under Creative Commons License BY v 4.0
Assuming that we have double checked for open ends and other flaws in the logic, we now have to check to ensure that our activities "are complete":
- Activity ID Field - Each Activity should have a unique activity ID. This is the only way that we have to ensure that there are no duplicated activities. Ideally, the activity ID’s should not be complex coding structures but kept as simple as possible. They should also not be sequential but with 5 or 10 values left between each code so we can add activities as needed.
- Constraint Fields - There can be constraints but only when absolutely justifiable. The reason for this is the more constraints, the less flexible the schedule and the harder it is to understand what is happening and analyse what can be done to correct or fix the schedule if it gets off track.
- Duration Field - As noted above, each activity should contain an appropriate level of risk contingency and/or the schedule should have a built in risk buffer. We should NOT be using the average or P50 value. For more on risk adjusted durations, refer to Module 4 - Managing Risk & Opportunity.
- Sort Code Field - As noted above, there are at least 15 different Omniclass sort codes which are known to be useful plus most software packages have plenty of fields available to add user defined sort fields. Sort Codes enable us to view our projects from multiple perspectives which makes it helpful for different stakeholders to see the project sorted and presented in a way which makes sense to them..
- Notes & Comments Field - This is a powerful field which is not used as effectively as it could or should be. This is where assumptions can be listed and is also a great place to list documents related to that activity.
- Activity Description Field - As noted above, all activity names or descriptions should include action verbs and be written as being an instruction for someone to do something. It should also contain some reference to the drawings, specifications or some other additional reference.
- Resource Fields - This includes tangible or physical resources (i.e. People, Equipment, and Materials) necessary to perform the work. For more on resources, refer to Module 6 - Managing Resources.
- Cost Budget Field - In addition to the cost of resources, cost estimates may also be entered as a resource, separate and distinct from the cost of resources. For more, refer to Module 8 - Cost Estimating and Budgeting.
07.6.4 OUTPUTS
- Activity Durations Which Are Realistic And Achievable
- Activity Costs (Activity Based Costing- Abc)
- Time And Cost Contingency Or Buffers Appropriate To The Riskiness Of The Project, Work Package And/Or Activity
- Calendars Which Include Holidays, Vacations And Planned Working Times
- Minimum Number Of “Level Of Effort” (Loe) Activities No Activity Longer Than The Reporting Period Or 44 Days, Whichever Is Smaller.
- For Advanced Practitioner’s, See Also Best Practices Checklist: Establishing Durations For All Activities See Appendix I: An Auditor’s Key Questions
- For Advanced Practitioner’s See Also Best Practices Checklist: Establishing Durations For All Activities See Appendix I: Standard Quantitative Measurements For Assessing Schedule Health
Best Practices Checklist: Calculate the Duration of Each Activity: (Adapted from GAO “Best Practices in Scheduling”)
- Activity durations are directly related to the assigned resources and estimated work required.
- In general, estimated detailed activity durations are shorter than 2 reporting periods.
- Durations are as short as possible, to a point, to facilitate the objective measurement of accomplished effort.
- Long durations should be broken into shorter activities if logical breaks can be identified in the work being performed. If it is not practical to divide the work into smaller activities or insert intermediate milestones, justification for long durations is provided in the schedule baseline document.
- Very short durations, such as 1 day or less, may imply a schedule that is too detailed and will require more-frequent updates to schedule duration and logic than is otherwise necessary.
- LOE activities are clearly marked in the schedule and do not appear on a critical path. They are scheduled as hammock or summary activities, so that their durations are derived from other discrete activities.
- All activity durations within the schedule are defined by the same time unit (hours, days, weeks). Days are preferred.
- Planning packages representing undefined future work should be integrated into network logic.
- Activity durations are estimated under normal conditions, not optimal or “success-oriented” conditions or padded durations. That is, “normal conditions” for estimated durations implies that duration estimates do not contain padding or buffer for risk. They should also not be unrealistically short or arbitrarily reduced by management to meet a project challenge.
- All assumptions related to activity duration estimates are documented at an appropriate level of detail, such as the methodology used to create the estimate (for example, parametric analysis of historic data or opinion of a subject matter expert) and all supporting historic or analogous data. Activity duration estimates for a WBS element in a schedule should clearly map to and correspond with the basis of the cost estimate for the same WBS element.
- Activity duration estimates for a WBS element in a schedule should clearly map to and correspond with the basis of the cost estimate for the same WBS element.
- Calendars are used to specify valid working times for resources and activities.
07.6.5 REFERENCES & TEMPLATES
- GAO “Best Practices In Scheduling” Best Practice 1 Pages 10-24
- GAO "Cost Estimating And Assessment Guide Best Practices For Developing And Managing Capital Program Costs”
07.7 - Module 07-7 - Calculating Float & the Critical Path
07.8 - Module 07-8 - Validate the Critical Path & Completed Dates
07.9 - Module 07-9 - Validating Horizontal & Vertical Integration
07.10 - Module 07-10 - Conducting a Schedule Risk Analysis
07.11 - Module 07-11 - Baselining & Communicating the Schedule
GPCCAR M07-6, Revision 1.02