06.0 - MANAGING RESOURCE ACQUISITION / ALLOCATION
06.1 - Module 06-1 - Introduction to Managing Resource Acquisition / Allocation
06.2 - Module 06-2 - Develop the Resource Policies & Procedures Manual
06.3 - Module 06-3 - Acquiring Manpower for the Project
06.4 - Module 06-4 - Acquiring Materials for the Project
06.5 - Module 06-5 - Acquiring Equipment for the Project
06.6 - MODULE 06-6 - ALLOCATING RESOURCES
06.6.1 - INTRODUCTION
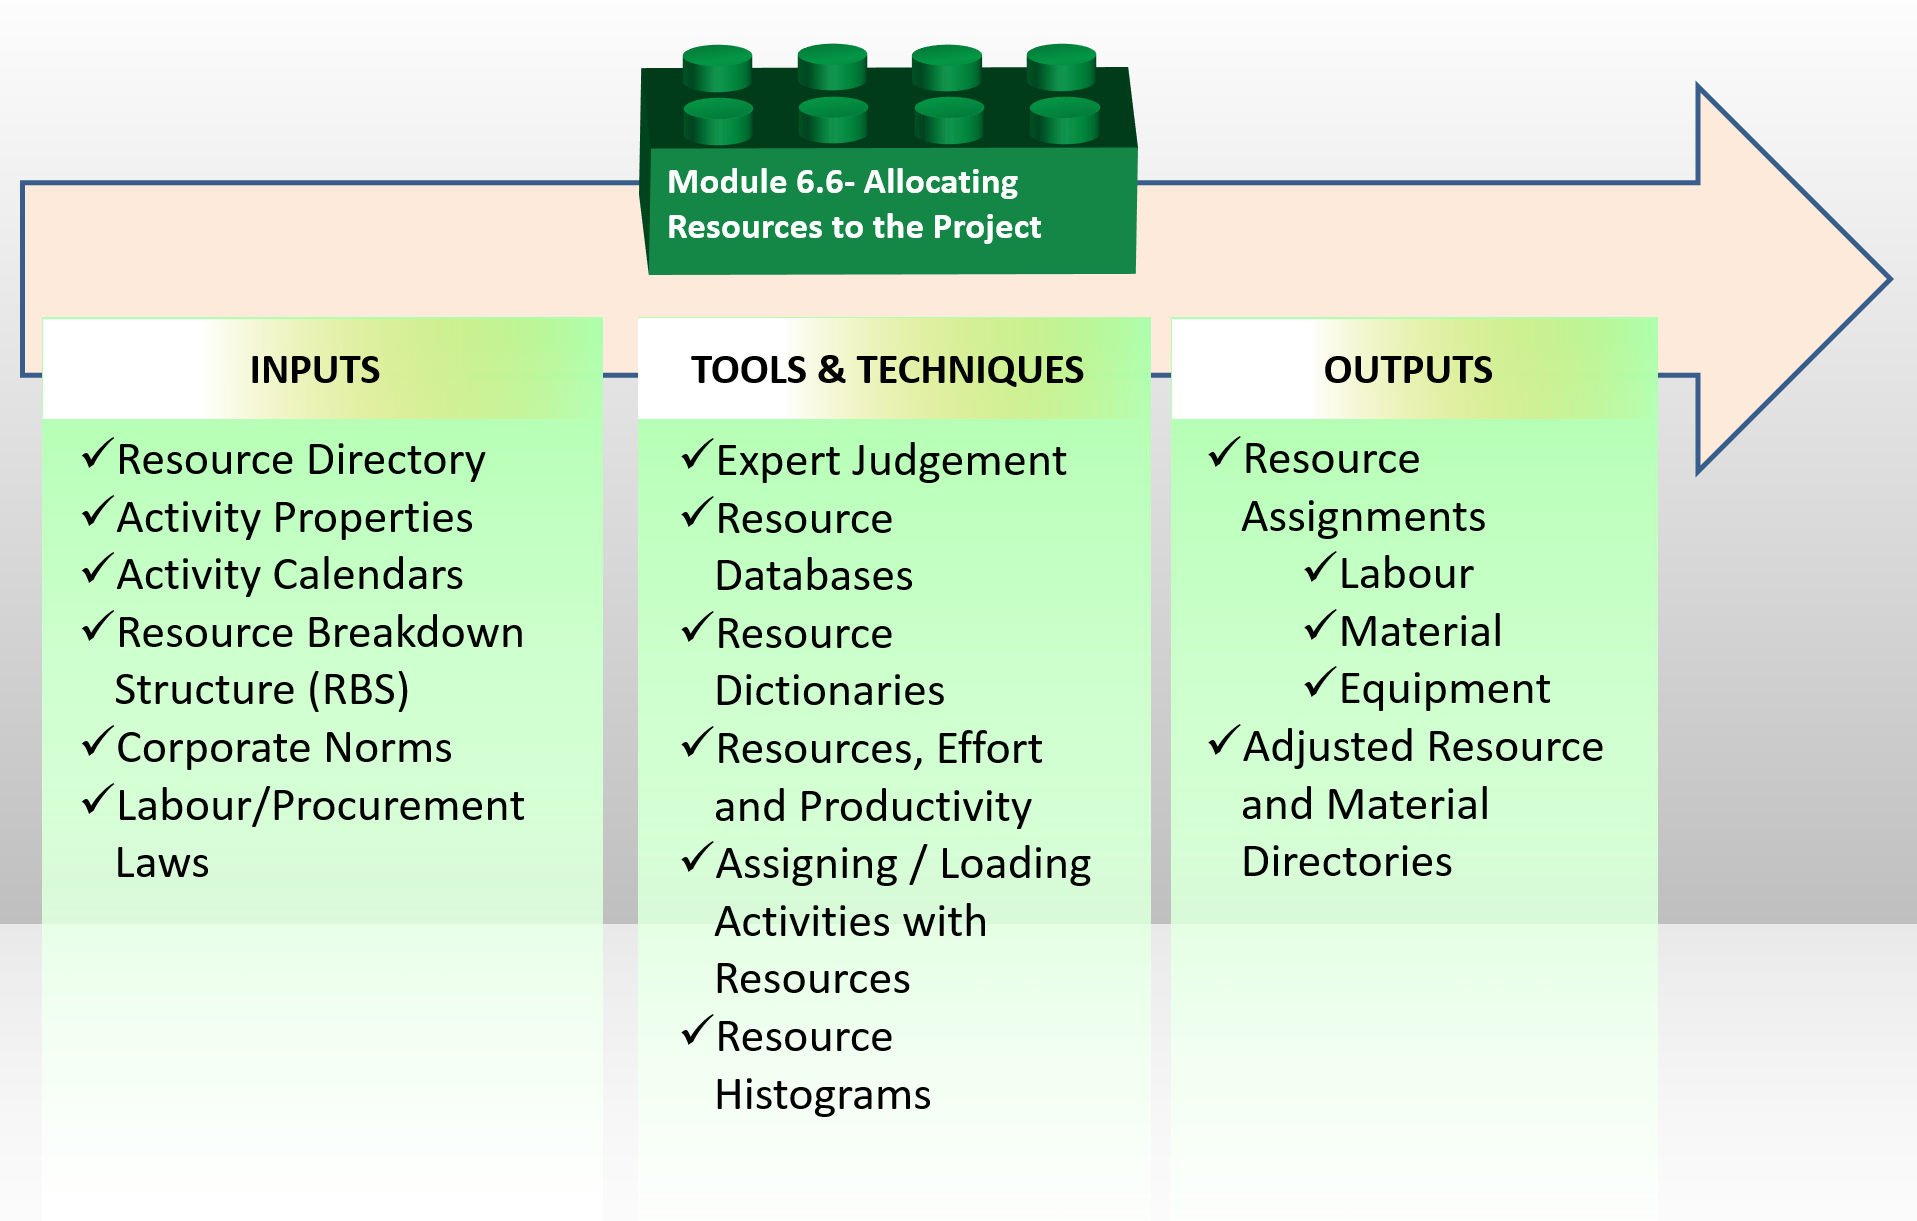
Figure 1 - Allocating Resources Process Map
Source: Guild of Project Controls
In Modules 6.3, 6.4 and 6.5 we looked at some of the important elements which go into the calculation of durations (i.e. productivity and lead times) and costs (depreciation and total cost of ownership) which were too detailed to be covered in Module 7 - Managing Planning & Scheduling, Module 8- Managing Cost Estimating and Budgeting along with other modules such as Module 10 - Managing Change, Module 11 - Managing Databases and Module 12 - Managing Forensic Analysis amongst others.
As the allocation of resources has a direct impact on both planning and scheduling (Module 7 - Managing Planning & Scheduling) and cost estimating and budgeting (Module 8- Managing Cost Estimating and Budgeting) this module will address the issues of allocating those resources, understanding that the details provided here go into calculating the durations, productivity and cost figures used in the subsequent modules.
Explained another way, this Module 6.6- Allocating Resources is the transition between Acquiring/Allocating Resources and Cost and Resource Loading the Work Packages and Activities in Modules 7 and 8 which serves not only as a quality control check on the accuracy, reliability and precision of the resource data but also serves as a very specific risk analysis applied specifically to resources.
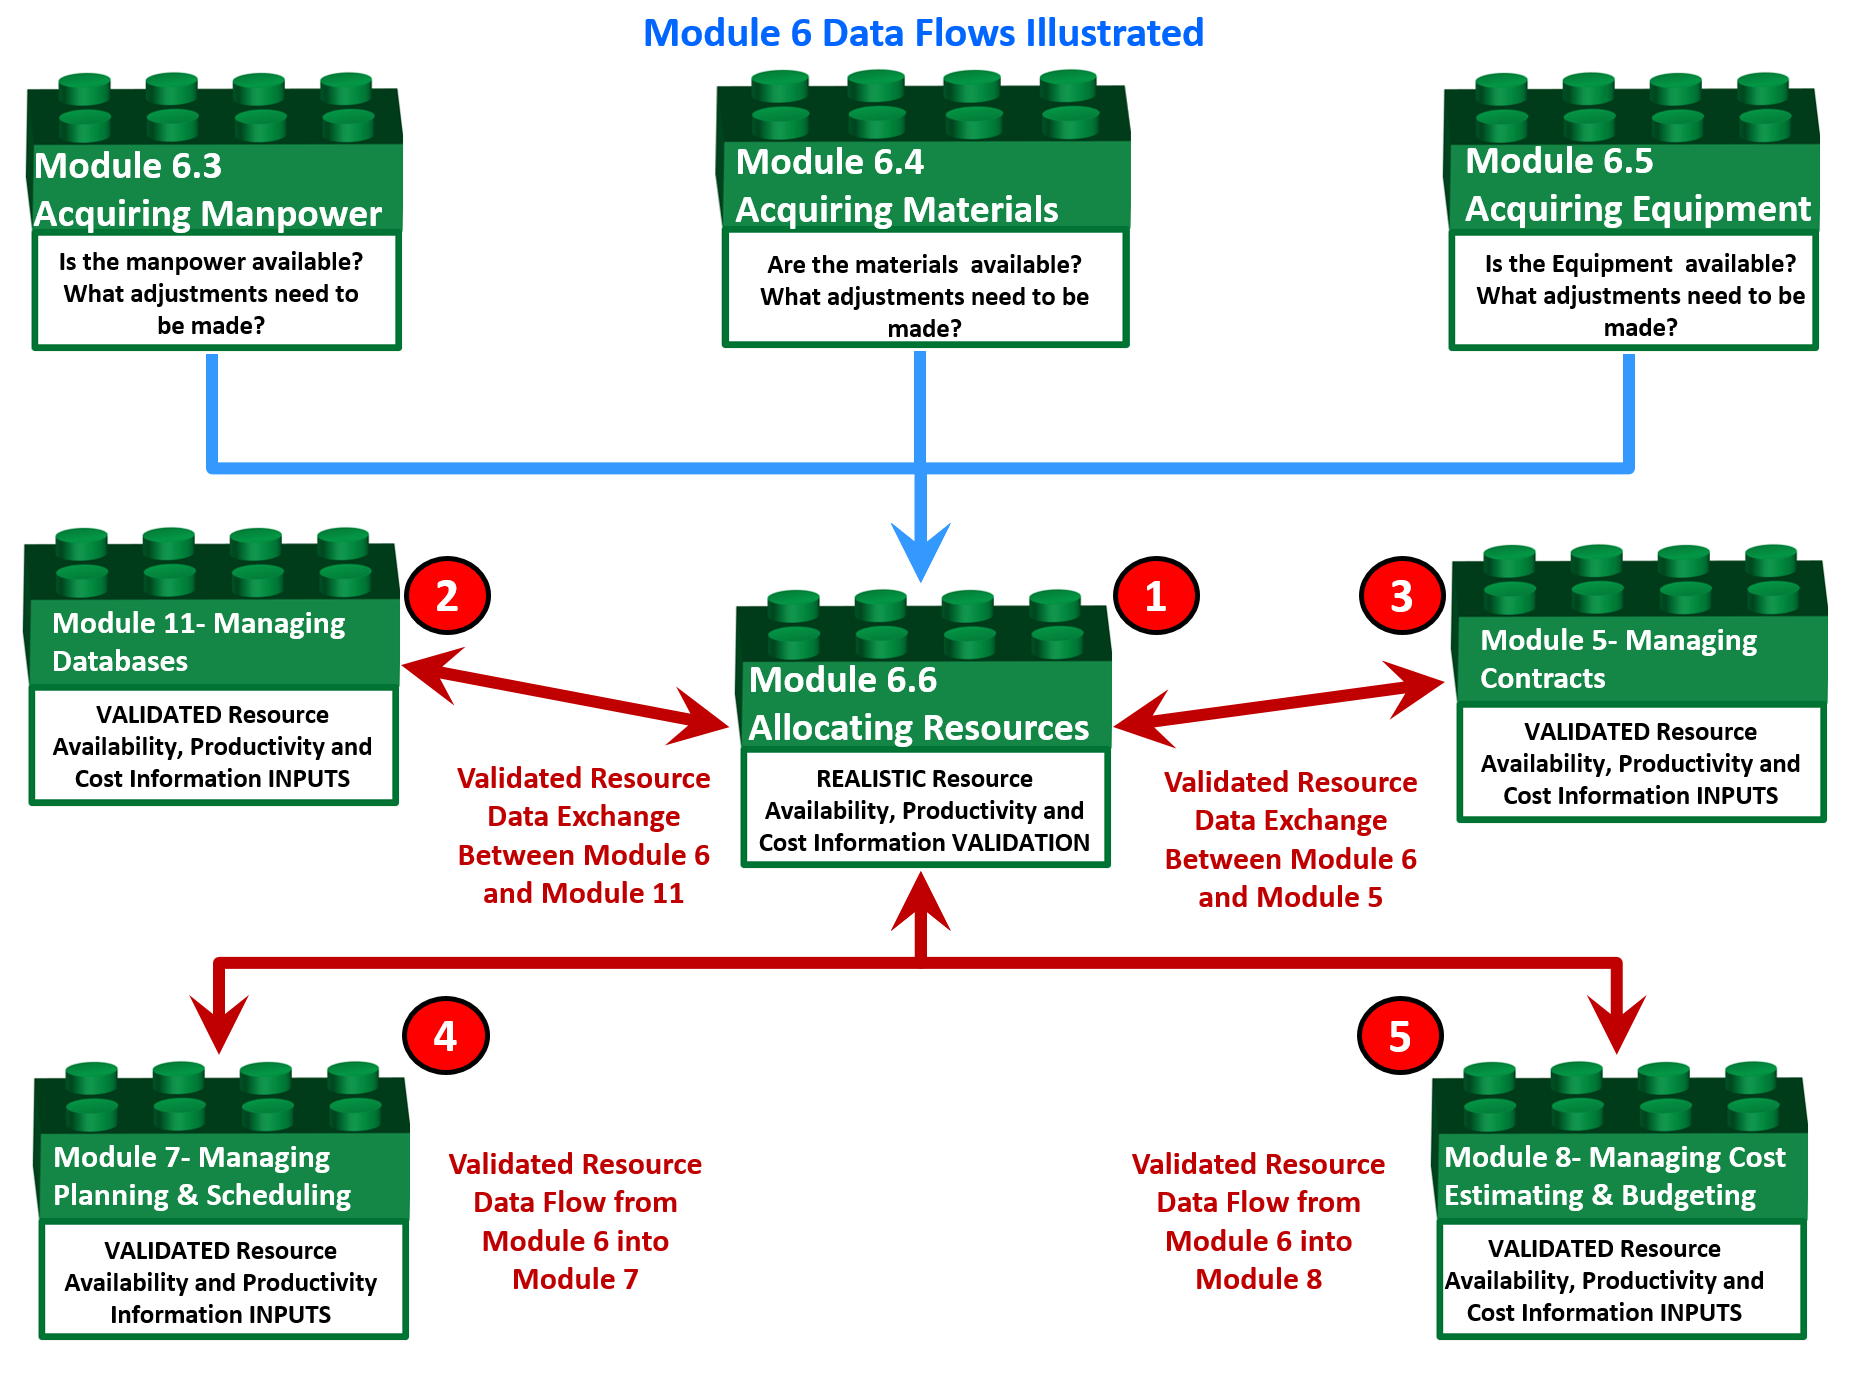
Figure 2 - Showing Module 6 Data Flows to validate the Resource Availability, Productivity and Cost Information
Source: Guild of Project Controls
Resource allocation includes following processes:
- Resource Assignments (Covered here and in Module 7 - Managing Planning & Scheduling and Module 8 - Managing Cost Estimating and Budgeting)
- Resource Constrained Scheduling (Covered here and in Module 7 - Managing Planning & Scheduling)
- Resource Performance Analysis (Covered in Module 7 - Managing Planning & Scheduling, Module 8- Managing Cost Estimating and Budgeting, Module 9 - Managing Progress and Module 12 - Managing Forensic Analysis)
- Updating and Maintaining the Cost Estimating Databases (Covered in Module 7 - Managing Planning & Scheduling, Module 8- Managing Cost Estimating and Budgeting, Module 11 - Managing Databases)
Resource planning and scheduling requires detailed design data that are rarely available for the whole project at the project start. So usually detailed planning is applied to near future periods and the schedule of the rest of the project remains high level until required information will become available. For more on this, see “rolling wave planning”, Module 7 - Managing Planning & Scheduling)
In the context of applied project controls, a “resource” is anything physical that is necessary for the execution of a work package or activity.
06.6.1.01 - Labour Resource Terminology
It is generally agreed that there are three types or categories of Labour we find on projects. Those are:
(1) Direct Labour - These are the people who actually do the work to create whatever product the project was undertaken to create. For construction, it would include the carpenters, masons and all other tradespeople. For an IT project it would include the programmers.
(2) Indirect or Project Support Labour - These are people who do not directly produce anything tangible for the project but provide support, supervision or assistance to those who do. Project Manager, the project team including the project control team members, QA/QC, safety, health and environmental inspectors all are examples of Project Indirect or Project Support Labour.
(3) Home Office Overhead Labour - These are the people back in the home office who provide services to ALL the projects in an organizations portfolio, not just the one you are on. This includes the estimating department, payroll, finance and the home office secretaries and clerks. This topic will be covered in more detail in Module 8- Managing Cost Estimating and Budgeting but for now for both owner and contractor alike this is normally carried as a percentage of the gross revenue of the organization and does not require those in the home office to charge their time specifically to one project or another.
While planners/schedulers are mostly concerned with Direct and Indirect Labour as those types of resources are loaded on each activity, the cost estimator needs to also know home office overheads as these have to be added to the cost of each activity usually as a percentage rather than being listed as an actual resource. Home office overheads often become a sticking point when negotiating change orders and/or claims settlements.
06.6.1.02 - Material Resource Terminology
The terminology pertaining to construction materials can be complicated and confusing. To start this module off, we need to know and understand the more common terminology.
Bulk- Material ordered, stored, issued, and sold by weight (such as bar stock or nails), volume (such as cement or oil), or footage (such as lumber).
Consumable/Expendable- Consumable (or expendable) materials are Goods which are:
- Used up or “expended) (not returned) after issuance from stores. Form oil used for concrete forms or gasoline (petrol) used to power machinery are typical examples of this category of consumable.
- Become incorporated into other goods and lose their identity. Mixing the bulk materials sand, cement and gravel together to make concrete is an example of this type of consumable.
- Cannot be used for their intended purpose without extinguishing or transforming their substance. Plywood purchased for concrete formwork is an example of this type of consumable. After some number of uses, the plywood is no longer suitable for use as formwork as it has lost its strength and/or does not produce a smooth enough finish to the concrete. All bulk materials are consumables/expendables but not all consumables/expendables are bulk materials.
06.6.1.02.1 - Direct Materials
Direct Materials are defined to be “all items such as raw materials, standard and specialized parts, and sub-assemblies required to assemble, construct or manufacture a complete product. Direct material costs are assignable to a specific product, cost center, work package, activity or work order.” Explained another way, anything that becomes a permanent part of or incorporated into the project deliverables and is turned over to the owner at completion of the project is a direct material.
06.6.1.02.2 - InDirect Materials
Indirect materials are Consumables (such as cleaning chemicals, disposable tools, protective devices) not used as raw materials, but which make the production of a good or service possible, more efficient, or safer. Indirect material costs are not readily identifiable with a specific product or job. They are termed indirect costs and are charged to overhead accounts. Generally speaking indirect materials which are not consumed in the process must be removed from the site at the completion of the project. (i.e. formwork and temporary storage buildings)
06.6.1.03 - Renewable vs Non-Renewable vs Recyclable Materials
Renewable Resources are “A resource that can be totally replaced or is always available naturally, or that is practically inexhaustible”. A common example is wood, which comes from trees or the sand and gravel which go into making concrete. A renewable resource can also be classified a consumable resource (as in the use of plywood for formwork) as well as an indirect (lumber to build temporary enclosures) or direct material (wooden doors or wooden cabinetry or trim). If solar power was being used to charge the batteries of hand tools that too is an example of the use of a renewable resource. Another example of a renewable resource is the hay or straw bales used for erosion protection.
Non-Renewable resources is a natural resource such as coal, gas, or oil that, once consumed, cannot be replaced. Most energy resources currently in use are non-renewable while the renewable ones (such as wind and solar power) are not well developed. Non-renewable resources are also called depletable resource. Non-renewable resource are almost always classified a consumable resource (i.e. diesel fuel for the generators)
Recyclable Resource is a Raw or processed material that can be recovered from a waste stream for reuse. A recyclable resource can also be classified a consumable resource as well as an indirect or direct material. A common example of this today is the grinding of existing asphalt pavement and recycling it by remixing it with new material for reuse on the same road it was salvaged from. Another example would be the use of recycled packing materials used to protect or wrap materials being delivered to the site. With many organizations “going green” as part of their corporate social responsibility (CSR) programs, requirements to use recyclable materials is often showing up in contracts and for contractors and owners alike, recycling as much construction material as possible makes sense not only environmentally but perhaps financially as well. (Concrete batch plants are now recycling aggregate and sand from unused (left over) concrete)
06.6.2 - INPUTS
- RESOURCE PROPERTIES - RESOURCE PROPERTIES INCLUDE AVAILABLE QUANTITY, RESOURCE CALENDAR, RESOURCE WORK HOUR COST, RESOURCE MATERIAL CONSUMPTION PER WORK HOUR. RESOURCE CALENDAR DEFINES PERIODS OF RESOURCE AVAILABILITY AND USUALLY DEFINES ITS WORK HOURS AT EACH DAY OF THE WEEK AND EXCEPTION PERIODS (VACATIONS, HOLIDAYS, ETC.). AVAILABLE RESOURCE QUANTITY MAY BE DIFFERENT AT DIFFERENT TIME PERIODS.
- CONSUMABLE RESOURCE PROPERTIES -CONSUMABLE RESOURCE (ALSO KNOWN AS “EXPENDABLE”) PROPERTIES INCLUDE UNIT OF MEASURE, UNIT COST. IT MAY USEFUL TO DEFINE RESOURCE TYPE IF DIFFERENT RESOURCES OF THE SAME TYPE SHARE THE SAME PROPERTIES.
- RESOURCE DIRECTORY -THE RESOURCE DIRECTORY INCLUDES THE LIST OF ALL RESOURCES THAT MAY BE USED IN THE CURRENT PROJECT OR PORTFOLIO AND THEIR PROPERTIES, IN THE PROCESS OF PROJECT PLANNING RESOURCE REQUIREMENTS MAY BE RECONSIDERED AND RESOURCE DIRECTORY ADJUSTED.
- ATERIAL DIRECTORY -THE MATERIAL DIRECTOR INCLUDES THE LIST AND PROPERTIES OF MATERIALS AND EQUIPMENT THAT MAY BE USED. MATERIAL DIRECTORY DOES NOT INCLUDE MATERIAL QUANTITIES.
- ACTIVITY PROPERTIES -ACTIVITY PROPERTIES DEFINE THE WAY RESOURCES ARE ASSIGNED. WHEN PEOPLE PLAN PROJECT ACTIVITIES THEY ESTIMATE ACTIVITY VOLUME OF WORK TO BE DONE. ONLY FOR SOME ACTIVITIES SUCH AS GETTING APPROVAL, RECEIVING PERMISSION, CURING CONCRETE VOLUME OF WORK IS HARD TO ESTIMATE OR IT DOES NOT MATTER. FOR THESE ACTIVITIES PEOPLE ESTIMATE DURATION AS INITIAL ACTIVITY INFORMATION.
SO MOST ACTIVITIES BELONG TO THE FOLLOWING TWO TYPES:
- DURATION TYPE ACTIVITIES ARE THOSE WHICH DURATION IS THEIR INITIAL INFORMATION AND DOES NOT DEPEND ON THE VOLUME OF WORK TO BE DONE.
- VOLUME TYPE ACTIVITIES ARE CHARACTERIZED BY THE VOLUME OF WORK TO BE DONE. ACTIVITY VOLUME IS USUALLY MEASURED IN THE PHYSICAL UNITS (CUBIC METER, TON, METER, ETC.) THOUGH OTHER MEASURES LIKE MAN-HOURS (EFFORT) ALSO CAN BE USED. ACTIVITY DURATION DEPENDS ON PRODUCTIVITY OF ASSIGNED RESOURCES.
BESIDES, AN ACTIVITY MAY BE OF LEVEL OF EFFORT OR HAMMOCK TYPE WHEN ITS DURATION IS DETERMINED BY EXTERNAL EVENTS, SO ACTIVITY LASTS FROM ONE EVENT TO ANOTHER.
ONE MORE SPECIAL ACTIVITY TYPE IS МILESTONE: AN ACTIVITY WITH ZERO DURATION THAT USUALLY REFLECTS SOME EVENT IN THE PROJECT SCHEDULE.
- ACTIVITY СALENDARS -THE ACTIVITY CALENDAR DEFINES TIME PERIODS WHEN AN ACTIVITY MAY BE EXECUTED. MOST ACTIVITIES MAY BE EXECUTED AT ANY TIME BUT SOME OF THEM MAY BE EXECUTED ONLY AT DAY TIME, OTHERS ONLY ON SUMMER OR ON WINTER.
- ACTIVITIES ARE OF THE SAME TYPE IF THEY SHARE THE SAME PROPERTIES LIKE COST AND MATERIAL REQUIREMENTS PER TIME OR VOLUME UNIT, RESOURCE REQUIREMENTS AND PRODUCTIVITY. ACTIVITIES OF THE SAME TYPE MAY HAVE DIFFERENT VOLUMES AND DURATION, MAY BE DONE AT DIFFERENT PLACES, AT DIFFERENT TIME AND EVEN IN DIFFERENT PROJECTS.
- RESOURCE SKILLS -THE RESOURCE SKILL SET DEFINES WHAT ACTIVITY TYPES THE RESOURCE CAN EXECUTE. RESOURCES THAT HAVE THE SAME SKILL CAN DO THE SAME JOB THOUGH MAYBE WITH DIFFERENT PRODUCTIVITY. RESOURCE SKILL DIRECTORY CONTAINS THE LIST OF DIFFERENT SKILLS THAT MAY BE REQUIRED IN CURRENT PROJECT AND FOR EACH SKILL THE LIST OF RESOURCES THAT HAVE THIS SKILL.
- RESOURCE BREAKDOWN STRUCTURE (RBS) -THE RESOURCE BREAKDOWN STRUCTURE (RBS) USUALLY DEFINES TO WHICH ORGANIZATIONAL UNIT EACH RESOURCE BELONGS.
- CORPORATE NORMS -THE CORPORATE NORMS MAY INCLUDE INTERNAL PRODUCTION RATES (PRODUCTIVITY) OF RESOURCES ON DIFFERENT ACTIVITY TYPES, COST AND MATERIAL REQUIREMENTS PER VOLUME UNIT OF DIFFERENT ACTIVITY TYPES AND OTHER INFORMATION THAT MAY BE USED WHEN PROJECT IS SCHEDULED. IF CORPORATE NORMS DO NOT EXIST, COMMERCIAL DATABASES MAY BE USED FOR THE SAME PURPOSE.
- LABOUR/PROCUREMENT LAWS - THOSE LAWS WHICH GOVERN WORKING HOURS, HOLIDAYS, OVERTIME, SAFETY REQUIREMENTS OR “LOCAL CONTENT” REQUIREMENTS WHICH ACT AS CONSTRAINTS OR LIMITATIONS ON WHAT AN OWNER OR CONTRACTOR CAN OR CANNOT DO IN TERMS OF RESOURCE ACQUISITION OR ALLOCATION.
06.6.3 - TOOLS & TECHNIQUES
06.6.3.01 - Expert Judgement
A “subject matter expert” (SME) decides what resource are needed to execute each project activity and assignes their productivity basing on their own experience or on the information found somewhere. It means that the schedule reliability depends on expert experience that may create problems.
06.6.3.02 - Corporate Norms and Historical Records
It is not rare when most activities in the project model are typical and corporate norms or historical records may be used for determining resource crews that are needed to execute project activities, material requirements and expected costs. For new activities Expert Judgement is the only way to provide this information.
06.6.3.03 - Resource Databases
While the Guild of Project Controls is not endorsing any particular software or system, R.S. Means has given the Guild permission to use their well-known and highly respected cost estimating databases to illustrate not only what fields a well-constructed project controls database should contain but how both planner/schedulers and cost estimators as part of the project controls team need to be able to use this information separately or together to produce cost and resource loaded schedule.
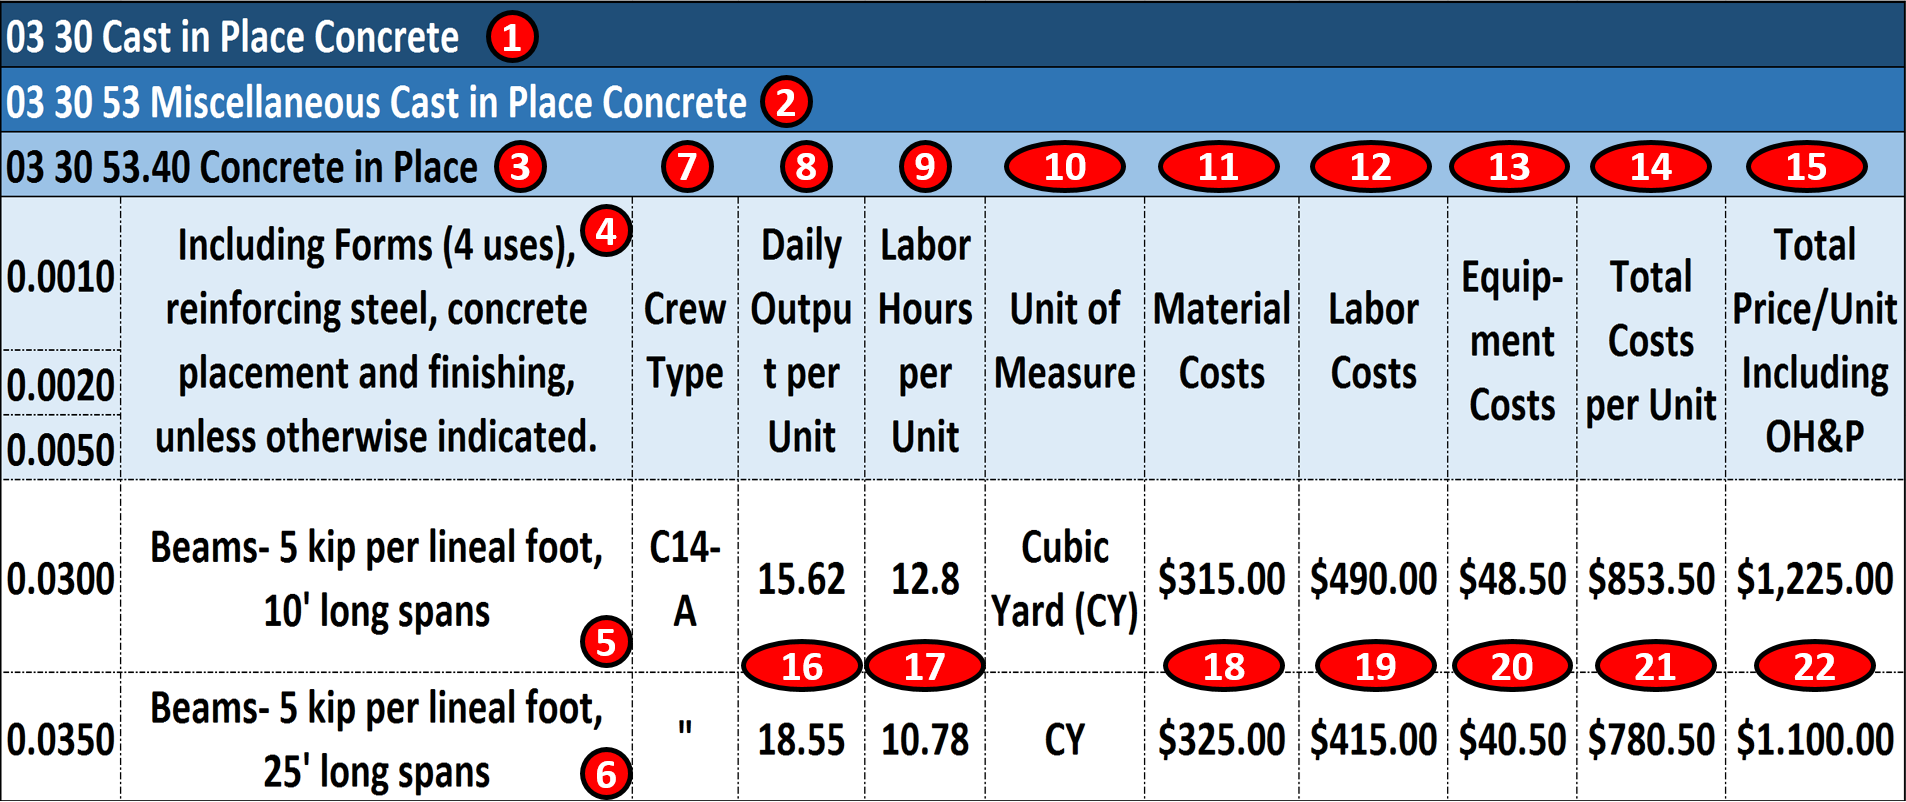
Figure 3 - Case Study Using Commercial Database Information
Source: Giammalvo, Paul D (2015) Course Materials. Contributed Under Creative Commons License BY v 4.0
In the example above:
(1) 03 30 Cast In Place Concrete is CSI Masterformat/Omniclass Table 22 2nd Level WBS Structure. (Level 1 is 03 is Concrete and Level 2 is 03 30 is Cast in Place Concrete)
(2) 03 30 53 Misc Cast in Place Concrete is CSI Masterformat/Omniclass Table 22 3rd Level WBS (Level 1, 03 is Concrete, Level 2, 03 30 is Cast in Place Concrete)
(3) 03 30 53.40- Concrete in Place is CSI Masterformat/Omniclass Table 22 Level 4 WBS, which from this level down becomes not only a WBS but a Cost Breakdown Structure (CBS) and Productivity Breakdown Structure (PBS) as well. One coding structure serving three purposes. Worth noting is Level 3 of the WBS is the MINIMUM level of detail that an owner should be providing to a contractor, assuming the owner wants to minimize claims and disputes while at the same time, obtaining highly competitive bids.
(4) 03 30 53.40.0010, 03 30 53.40.0020 and 03 30 53.40.0050 is an ACTIVITY consisting of Forming (0.0010); Installing Rebar (0.0020) and Placing and Finishing Concrete (0.0050)
(5) There are two types of Activity “03 30 53.40.0300 is based on 10’ (foot) long spans” and Activity “03 30 53.40.0350 is based on 25’ (foot) long spans”. Depending on the number of scenarios, you could create other cost and productivity calculations for as many different combinations as you are likely to use.
(6) For the remaining example we will be using Activity 03 30 53.40.0350 to form, reinforce, place concrete and strip 25’ long, 5 kip (5,000 lbs) beams. Notice that the only piece of information MISSING from this is the Quantity Take Off or Bill of Materials? When we start to use Building Information Modelling (BIM) this information will be coming to us, using these coding structures. If we do not use BIM, then we have to do it the old fashioned way- doing quantity take offs using manual methods.
(7) This is where we know the composition of the crew that was used to calculate the productivity and costs. For this example, we will use Crew C-14A. See below for a more detailed look at what Crew C-14A is made of.
(8) Is simply the daily output that Crew C-14A can produce ON AVERAGE. (P50) value. It is not adjusted for any risks. This is one of the most important pieces of information that the Planner/Scheduler needs as this is how we calculate the DURATION and the Cost Estimator needs to know and understand to estimate the COSTS
(9) Is the number of Crew Labour Hours per Cubic Yard (CY) of beam concrete. This too is another useful piece of information for all project control professionals but especially planners/schedulers, as many projects are not tracked based on money but on man-hours expended or earned vs planned man hours. This will be covered in Module 9 - Managing Progress.
(10) This is the Unit of Measure. In this case, it is Cubic Yards (CY) but it could have been Cubic Meters (M3) or any other fast and reliable way to measure physical progress.
(11) This is the Field where we enter Material Costs. As material costs tend to be location specific, the professional cost estimate needs to keep this updated and adjust these values for different locations.
(12) Labour Costs- As with Material costs, Labour costs are highly variable and need to be checked and validated by the cost estimator/project controller for each location and for each trade.
(13) Equipment Costs- Tend to be less variable than material or Labour costs, but also need to be updated at least semi-annually and preferably quarterly. Equipment productivity tends to be relatively stable and predictable.
(14) Total Costs is the sum of 11, 12 and 13
(15) Marked Up Costs (Contractors Selling Price) is shown in this column and as we can see, ranges from about 44% to 47% to cover Project Overhead, Home Office Overhead and all the other items shown above in Figure XX R.S. Means 2008 Facility Cost Estimating Database Back Cover Showing Labour Rate Markups
(16) Crew C-14A can produce on average, 18.55 Cubic Yards (CY) per day for this particular activity. Different activities will have different productivity rates.
(17) On average, it takes 10.782 Labour hours per Cubic Yard (CY) in place for this particular activity. Different activities will have different productivity rates.
(18) The Material Costs for this activity is $315.00 per Cubic Yard of Concrete in place
(19) The Labour Costs for this activity is $415.00 per Cubic Yard of Concrete in place
(20) The Equipment Costs for this activity is $40.50 per Cubic Yard of Concrete in place
(21) The Total Costs per Cubic Yard of Concrete in Place is $780.50
(22) The Fair Market Value or Contractors Selling Price for each Cubic Yard of Concrete in Place is $1,100, including a markup for OH&P of ~47% (16% Home Office Overhead + 16% for Project Overhead + 15% for Contractors Gross Profit = 47%)
For the example below the Unit of Measure will be Cubic Yards (CY)
This same data is required by both the planner/scheduler and the cost estimator and ideally both should be working of the same database. Failure to create an integrated database will result in conflicts between what the scheduler calculates for costs based on the hourly or daily rate and the marked up costs which include overhead and profit margin.
Important for Owner’s cost estimators especially is for you to use the COSTS if you are trying to decide whether an activity is cheaper for you do to in house with your own team or outsource it. Failure to back out the contractors OH&P will always make it look like you can do it cheaper, when in fact, you may not be able to.
And again using the above referenced R.S. Means database this is what the aforementioned “Crew C-14A” consists of. You will notice that the “crew” is further broken down into its constituent parts:
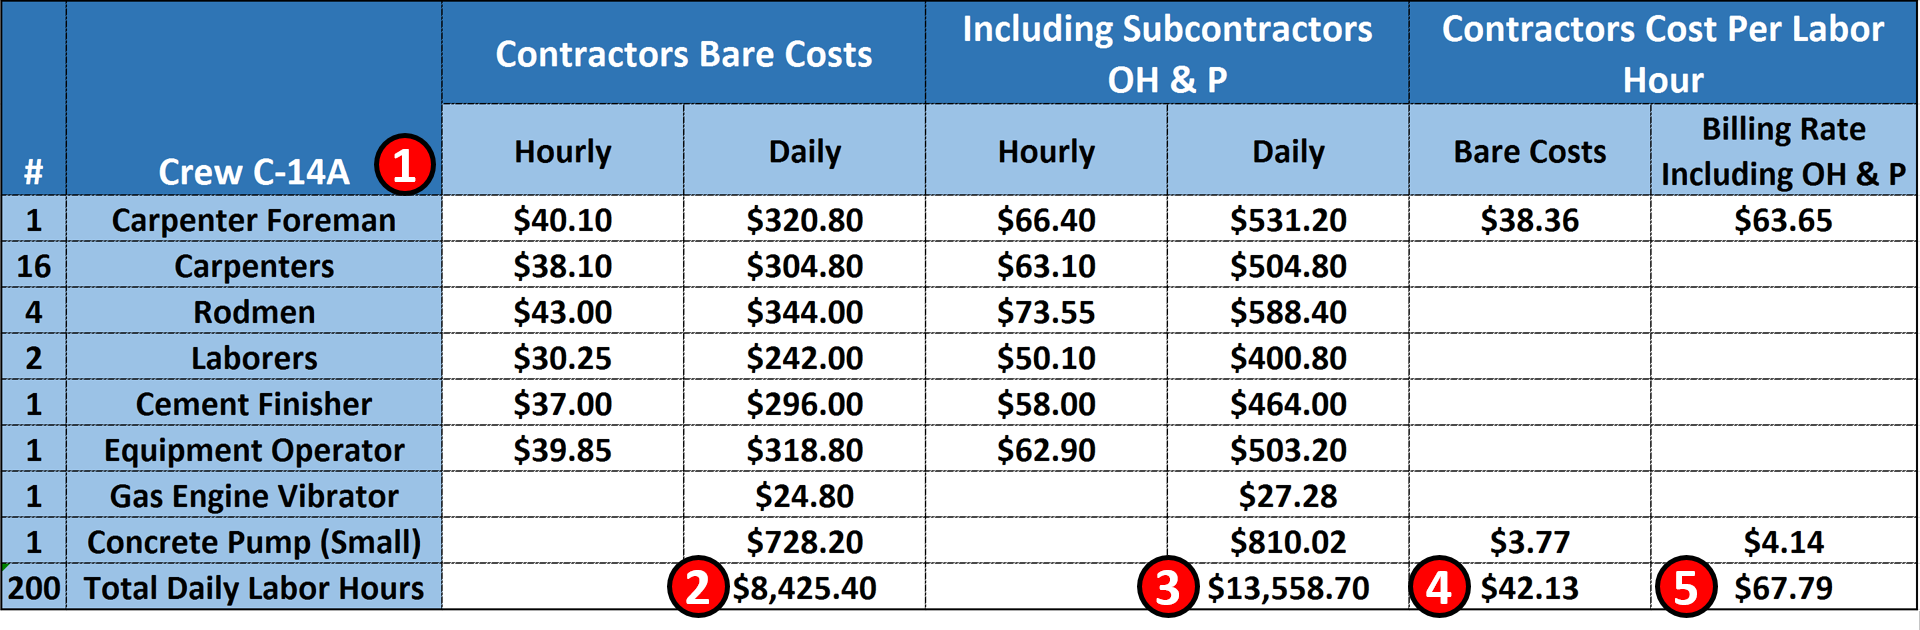
Figure 4 - Case Study Demonstrating Crew Composition Details
Source: Giammalvo, Paul D (2015) Course Materials. Contributed Under Creative Commons License BY v 4.0
(1) Crew C-14A consists of the 8 Labour and Equipment items; 1 carpenter foreman plus 16 carpenters, 4, rodmen, 2 Labourers and 1 equipment operator.
(2) This crew of 25 people equals 25 man days of labour and assuming they are working an 8 hour day = 200 man hours of labour per crew working day.
(3) The bare COST of this crew is $8,425.40 per day (bare costs are wages and fringe benefits for the Labour and the depreciated costs of the equipment)
(4) This is what the PRIME CONTRACTOR has to CHARGE for this crew to work one day
(5) This is the additional amount the PRIME CONTRACTOR has to add to cover his/her Overhead and Profit on his Foreman and the Concrete pump the prime contractor provided. Thus the PRIME CONTRACTOR would have to take the $13,558.70 and ADD the OH&P of $67.79 for his Foreman and Pump for a total of $13,626.79 per 8 hour working day.
- What we are MOSTLY looking for as planners, schedulers and cost estimators are the Crew, the daily output, the labour hours and the unit of measure (and the total costs if we are a contractor). See Figure 4 above.
Having established and kept current a PROJECT CONTROLS DATABASE when we have created a schedule then we have to draw from this database to create our RESOURCE POOL or RESOURCE ASSIGNMENTS or RESOURCE DICTIONARY.
06.6.3.04 - Resource Dictionaries
In order to organise and coordinate these project resources we need to create “Resource dictionaries”. Such a dictionary is a predefined “pick list” or “library” of resource types from which the planner/ scheduler can select when later assigning resources to activities within the schedule. This library needs to come from the project controls database to ensure that planner, schedulers, cost estimators/QS and project controllers are all using the same coding structures and that the productivity and man hours is consistent with the associated costs.
To create the dictionary we need to build a list of all envisaged resources. This best comes from our historical database, using either commercially available which need to be modified for local conditions OR those resource dictionary databases created and maintained by our project control/PMO.
In the example below:
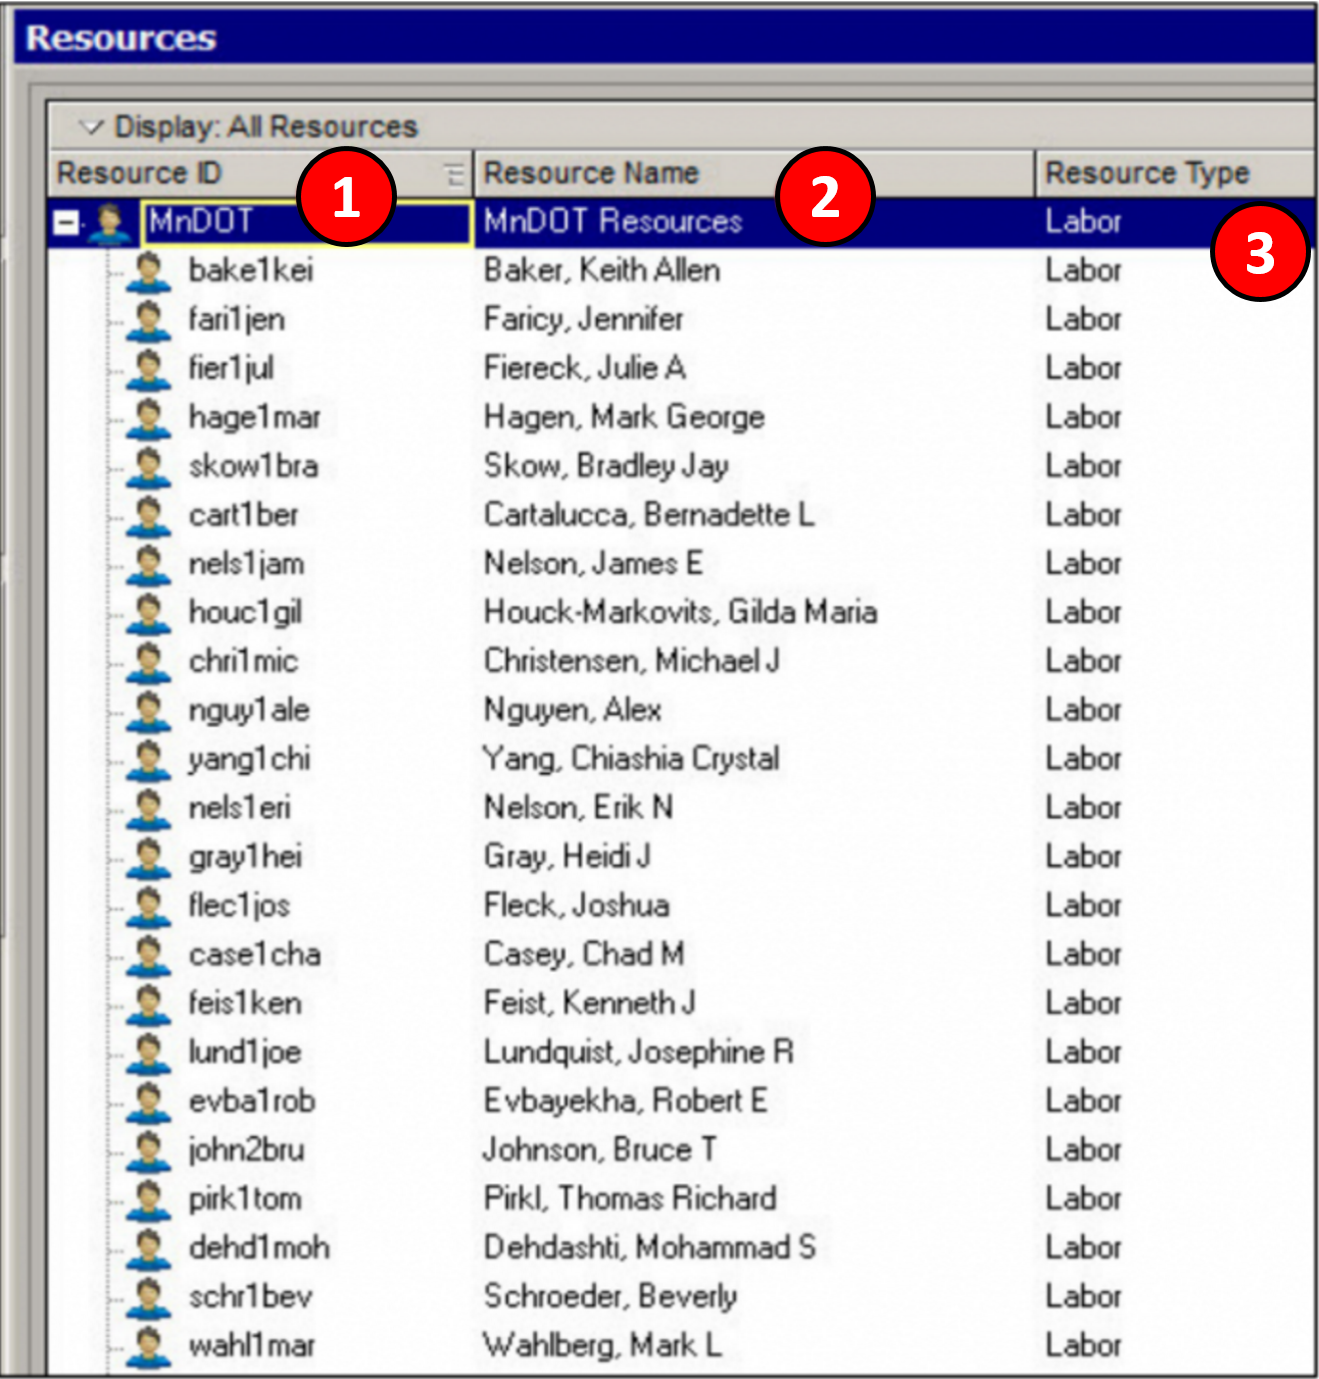
Figure 5 - Resource Dictionaries
Source: Utah Dept of Transportion (UDOT) Primavera Training Manual
Taken from Primavera’s P6 but is typical of most other software package resource dictionaries) we have 3 fields:
(1) Resource ID which is an alpha numeric set of characters which serves as shorthand way to identify specific resources. From the example above, Crew C-14A would be an example of a Resource ID
(2) Resource Name- This is the actual name of the resource.
(3) This is the TYPE of resource it is.
a. Labour- Using the example above, Crew C-14A is a LABOUR resource, and to this Labour resource we can attach the productivity, crew hours, costs or pricing information.
b. Non-Labour- This covers any resource which is neither Labour nor materials so would include equipment, costs or selling price or any other non-Labour, non-material resource.
c. Materials- Examples would be concrete, steel, doors or any other direct or indirect materials
In order to facilitate communications between the planner/scheduler and the cost estimator/quantity surveyor, the names given to resource types need to be standardized and agreed to. (i.e. both use the same names and coding structures) This means there should be one and only one Resource Dictionary which is used by both planner/scheduler and cost estimator/quantity surveyor.
Failure to adopt standardized names and coding structures makes it difficult if not impossible to create a database of productivity, hours and costs.
For a planner/scheduler, all we normally need is quantities from the Bill of Materials / Bill of Quantities and the number of people assigned to an activity and to make an assumption as to what their working hours are. (See example below for a more detailed explanation and examples).
For example the planner might want to call a resource “concrete placers” and assign a quantity of “one crew” and supplement this with a material resource called “concrete”. Whilst the planner/scheduler’s needs would be largely met as these three elements would enable the schedule to produce an overall manpower requirement and a concrete delivery requirement). However, this would be of little use to the cost estimator/quantity surveyor as there are many possible concrete placement crews sizes (and costs) depending on the activity as well as different productivity outputs and types of concrete which all cost different amounts.
The cost estimator/quantity surveyor needs to know more detail than simply that it is “one crew” and is assigned to an activity of say “1 weeks duration”, so by creating a pre-defined “crew” in the Resource Dictionary, the cost estimator/quantity surveyor can help integrate the schedule with the cost estimate / project budget by proposing a standardised crew name, a unique resource identifier as well as other elements such as productivities and the number of men and machines (and their costs) associated to the crew.
This way the scheduler achieves his aims of being able to support his activity duration with a “manpower resource” (i.e. the “one crew”) and a “material resource” of say 100 CY of concrete while the cost estimator/quantity surveyor’s needs are also met because the Resource Dictionary carry’s the associated details such as team size, plant and machinery items and costs as well as the specific cost breakdown for the material resource all by using unique identifier codes for each resource in the dictionary, the schedule resources can all be linked back to the cost systems etc.
ACTON 1 - WE BUILD A LIST OF ALL “TANGIBLE (PHYSICAL) PROJECT RESOURCES”
These resources include items such as manpower, machines, tools and equipment. The tangible or physical resource list (dictionary) has been created and from the historical database and the following information has been selected:
Resource Code - i.e. Items 1, 2, 3 or 4 from the example above depending on the level of schedule, i.e. for a:
- Level 1 schedule the number would be “03 30”;
- Level 2 schedule the code would be 03 30 53.40
- Level 3 schedule the code would be 03 30 53.40.0350
- Level 4 schedule the code would be “03 30 53.40.0350.L” for Labour; “03 30 53.40.0350.M” for Materials and “03 30 53.40.0350.E” for Equipment.
NOTE: For those who develop large schedules, (i.e. >5,000 Activities) that “rolling wave planning” can and should be used to avoid having to produce Level 5 or 6 cost and resource loaded activities far into the future. Explained another way, for large schedules containing 5,000, 10,000 or more activities, while each and every activity should be cost/resource loaded so we can produce the Performance Measurement Baseline (PMB or Early and Late Date S Curves), by changing the level of detail from greater to lesser the further into the future we get, enables us to generate accurate S Curves (both owner and contractor) without having to cost load each activity down to Level 4, 5 or 6.
Resource Name – i.e. Item 11 from the example below.
- To be consistent and avoid confusion the names in the resource dictionary need to be standardized and agreed to by both planner/scheduler and cost estimator/quantity surveyor (i.e. “Crew C-14A” or “Costs” or “Selling Price”)
Resource Type - if there is no predefined crew which can be identified for a specific activity, then you could build your own crew using specific skills or roles. (i.e. Carpenters, Rodmen, Finisher)
Resource Hourly or Daily Cost - if resource usage cost is proportional to work hours) (From the example below $8,425.40 daily)
- IF you are not using money but are using man-hours there are two ways to calculate them. If you know the required material units (i.e. 500 cubic yards) and you know the man hours per cubic yard (10.782) the by multiplying the 500 X 10.782 you get 5,391 man hours. If all you have is the duration you multiply the duration (27 days X 200 man hours per day and you get 5,400)
Resource Calendar – to define resource working hours; say 8 hour days
Resource Quantity - maybe “constant” (fixed) or “variable” based on time or volume. i.e) (From the example above, 16 carpenters, 4 rodmen…… etc.) Note that the actual material quantities are not included in dictionary as they are a variable, only unit rates are included i.e. time or money.
Resource Material Requirements per work hour - if applicable. From the example above , Small Concrete Pump = $3.77/hour.
ACTION 2: WE ALSO BUILD A LIST OF “CONSUMABLE PROJECT RESOURCES” (EXPENDABLES)
These resources include items such as materials and some types of equipment and these are spent during activity execution and cannot be used again such as power, air conditioning, staples and nails etc. Assign unique codes to the resources and define their properties.
When creating a consumable resource list (dictionary) the following information is usually identified:
Material Code (Because we are using Activity Based Costing, the material uses the same coding structure as the Labour and equipment- “03 30 53.40.0350” . The only differentiator would be to add an “ L” for Labour, “M” for Material or “E” for Equipment.)
Material Name (5 kip (5,000 lb) Concrete Mix)
Material Unit Cost (e.g. kg, meter, pound, etc.) (From the example above, $325 per CY)
06.6.3.05 - Resource Priorities
When an activity can be executed with use of alternative resources it is natural to assign not certain resources but resource skills. If there are user preferences for resource assignments it is necessary to define assignment priorities for resources that have required skill.
Lacking any specific resource prioritization scheme, the classic or traditional prioritization used for resource levelling are:
- Top Priority = Free Float
- Second Priority = Total Float
- Third Priority = Violate Internal Constraint Dates
- Forth Priority = Violate Project Constraint Dates
06.6.3.06 - Resources, Effort and Productivity
For each activity we have identified for the schedule, what we are looking for as planners/schedulers is the number and quality (productivity) of the available Labour and Equipment resources as well as the tangible or physical resources- Materials which are all associated with the scope defined by the schedule activity. Each of the above Labour, Equipment and Material resources will reside in the aforementioned Resource Dictionary.
This is the point where the Cost Budget elements are also defined and merged with the CPM Schedule.
Whether it is done by the Planner/Scheduler working in collaboration with the Cost Estimator/Quantity Surveyor, or it is done concurrently or simultaneously by the Project Controller it is important to identify the associated labour, equipment and material costs as these too will need to be assigned to the activity.
The above information is collated for each activity in the schedule in readiness for loading into the schedule as “resources”. This information will also later help identify the activity duration (refer Module 7.5 - Calculate the Duration of Each Activity).
Keep in mind that any values would likely represent an average value (often referred to as the P50 value) so to that we may have to add in any time or cost contingency calculated from Module 4 - Managing Risk & Opportunity.
This is the point where the Cost Budget starts to be merged with the CPM Schedule. Whether it is done by the Planner/Scheduler working in collaboration with the Cost Estimator / Quantity surveyor or it is done concurrently or simultaneously by the Project Controller it is important that the work to optimize the schedule, taking into account both time and cost trade-offs.
For example, it is now that we find out from the schedule dates that concrete is going to be placed in the winter months. As this will double the unit cost of the concrete in place, the planner/scheduler and cost estimator and/or project controller have to explore ways that the concreting activities can be moved out of the winter months OR if that is not possible that the budget increases are approved to cover the cost of concrete placement in winter conditions.
These and other adjustments will be covered in more detail in Module 8- Managing Cost Estimating and Budgeting but for the time being, the planner/scheduler needs to know and understand that merging the cost estimate and the schedule is an important task and that it is the planner/scheduler who need to take the lead in facilitating the necessary schedule meetings to make it happen.
06.6.3.07 - Assigning / Loading Activities with Resources
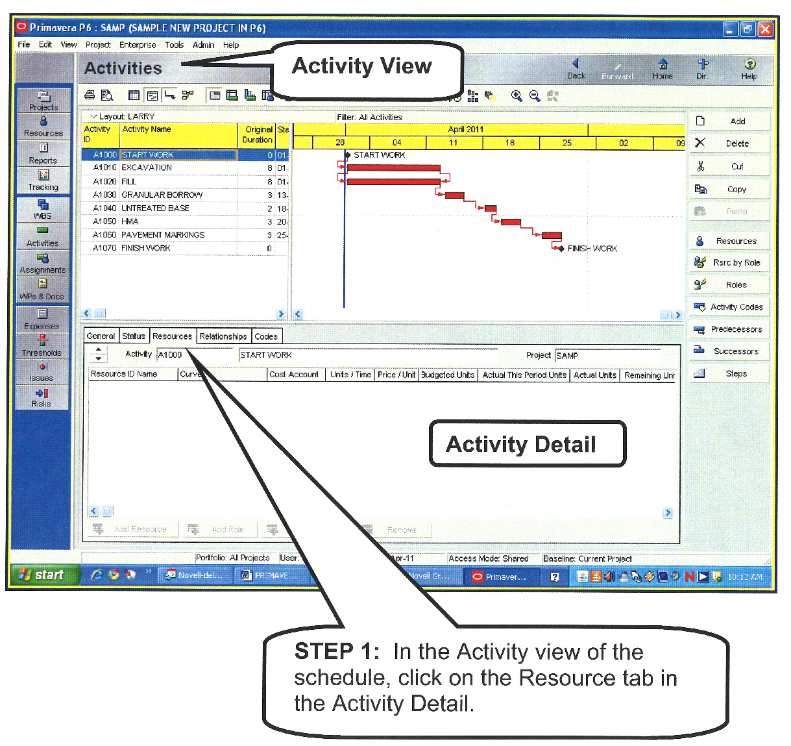
Figure 6 - Assigning / Loading Activities with Resources
Source: Utah Dept of Transportion (UDOT) Primavera Training Manual
Step 1 Once the full activity listing has been created and the associated Labour, Equipment and Materials identified, each activity now needs to be “loaded” or “assigned” the relevant resources using one or more of the resources defined by the resource libraries above.
Again using Primavera’s P6 as an example, (taken from the US state of Utah Department of Transportation (UDOT) Primavera Training Manual (2011) understanding that most of the major software packages the process is similar, the first step is to open up the schedule so you can see the activities, then select an activity and go to the “Activity Detail” screen.
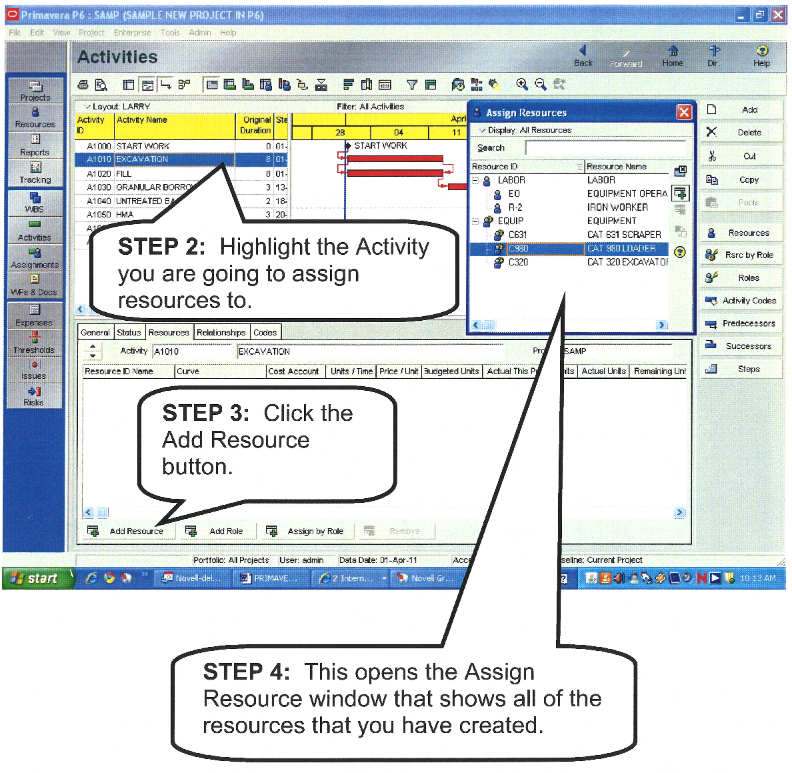
Figure 7 - Assigning / Loading Activities with Resources
Source: Utah Dept of Transportion (UDOT) Primavera Training Manual
Step 2 is to highlight each activity and then click on the “Add Resource” button (Step 3) which opens the “Assign Resource” dialog box containing all the items in your RESOURCE DICTIONARY (Labour, Materials, Equipment or other non-Labour resources) then select an activity and go to the “Activity Detail” screen.
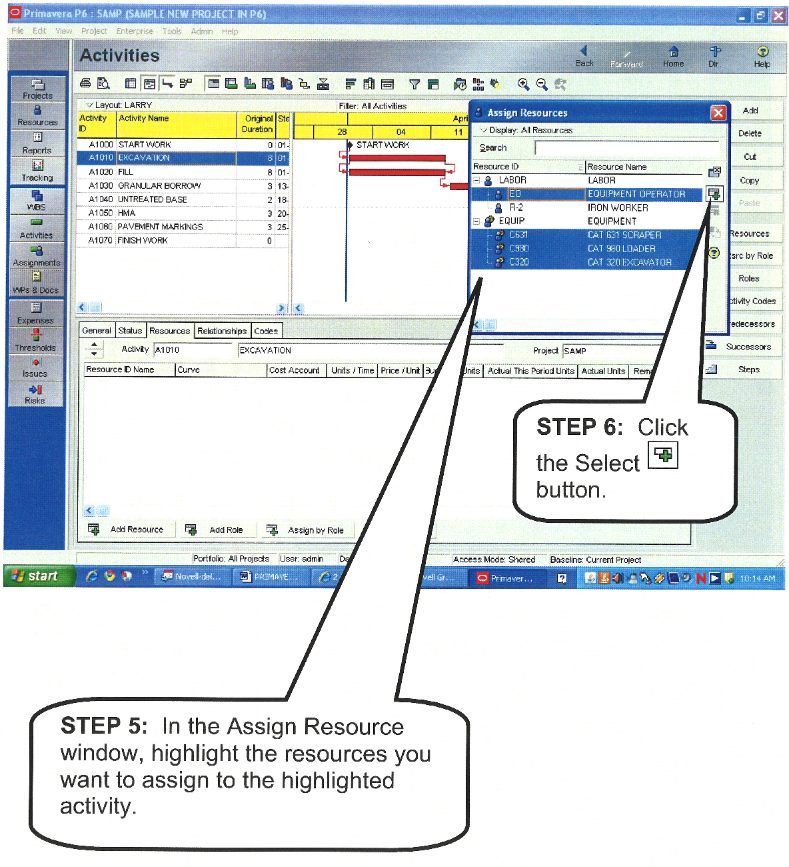
Figure 8 - Assigning / Loading Activities with Resources
Source: Utah Dept of Transportion (UDOT) Primavera Training Manual
Step 5 is to find the appropriate resource you want to assign to this activity, highlight that resource from the RESOURCE DICTIONARY in the “Assign Resource” window, and then Step 6 click the “Select” button which assigns that resource to that activity. Understanding that you can assign more than one resource to any single activity and/or you can assign the same resource to more than one activity.
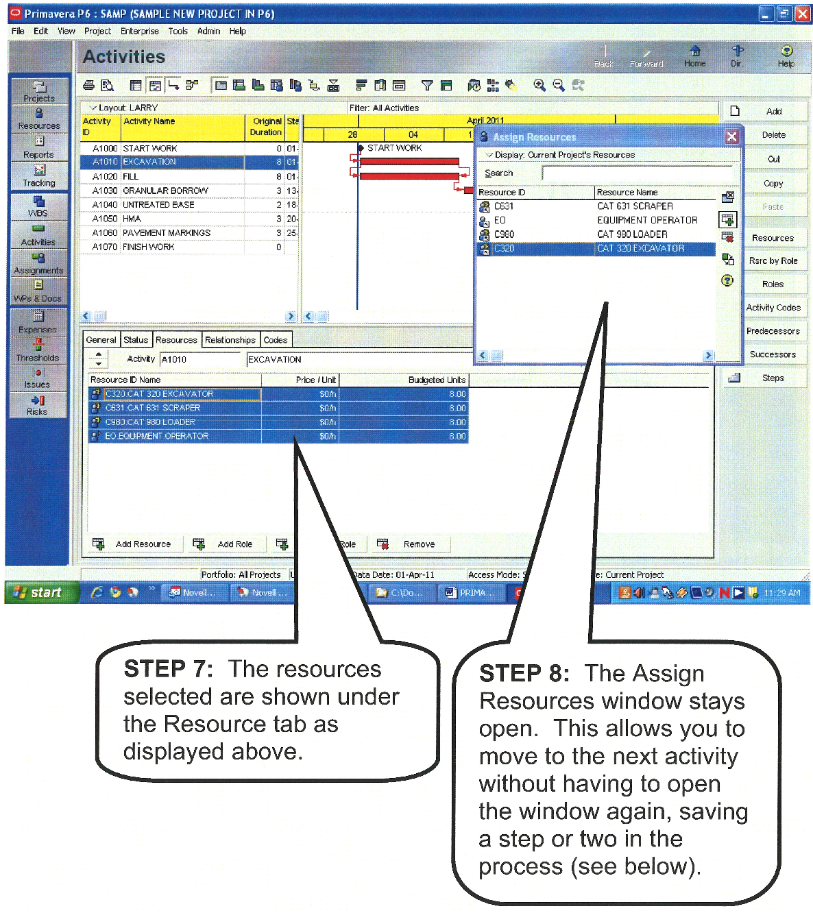
Figure 9 - Assigning / Loading Activities with Resources
Source: Utah Dept of Transportion (UDOT) Primavera Training Manual
Steps 7 and Step 8 clearly indicate that you can assign more than one resource to an an activity and that you can also apply the same resource to more than one activity.
- Applying these steps to the example above, what we are MOSTLY looking for as planners/schedulers are the Crew, the daily output, the labour hours and the unit of measure, while as cost estimators, we are generally interested in the costs and productivity, even though both sets of information normally are included on each resource.
(1) Crew is C-14A
(2) Daily Output is 18.55 Cubic Yards (CY) of concrete
(3) There are 10.782 crew hours per Cubic Yard (CY) of concrete
(4) There are 200 man hours per crew day of work
(5) Quantities of Materials (From the Bill of Materials /Bill of Quantities)
From the Bill of Materials (BoM), Bill of Quantities (BoQ) obtained either through BIM or from traditional quantity take off methods or from historic records on projects of the same size and type, we estimate there are 500 CY of concrete.
- To calculate the duration, we can divide the 500 CY of concrete / 18.55 CY output per day= 26.95 or 27 days.
- To calculate the total man hours we can multiply 10.782 man hours per Cubic Yard which yields 5,391 OR
- Knowing that the total labour hours per crew day is 200 and knowing the duration is 27 days, we can also calculate the total man-hours required by multiplying 200 man hours per crew day X 27 days = 5,400 which is the same value as above, but calculated a different way.
Keep in mind that all these values represent is an average value (P50) so to that we have to add in any contingency calculated from Module 4 - Managing Risk & Opportunity.
Again, this is the essential point where the cost estimator / quantity surveyor and planner/scheduler need to be working together collaboratively as the planner/ scheduler deals primarily in time while the cost estimator/quantity surveyor deals primarily in cost. However, if a project controller was building the schedule they would handle both the time and cost elements and this coordination would therefore not be necessary.
This is the point where the Cost Budget is merged with the CPM Schedule. Whether it is done by the Planner/Scheduler (who handles time) working in collaboration with the Cost Estimator/Quantity Surveyor (who handles cost) or it is done concurrently or simultaneously by the Project Controller (who handles time and cost) it is important that the work to optimize the schedule, taking into account both time and cost trade-offs.
For example, it is now that we find out from the schedule dates that concrete is going to be placed in the winter months. As this will double the unit cost of the concrete in place, the planner/scheduler and cost estimator and/or project controller have to explore ways that the concreting activities can be moved out of the winter months OR if that is not possible that the budget increases are approved to cover the cost of concrete placement in winter conditions.
These and other adjustments will be covered in more detail in Module 8- Managing Cost Estimating and Budgeting but for the time being, the planner/scheduler needs to know and understand that merging the cost estimate and the schedule is an important task and that it is the planner/scheduler who needs to take the lead in facilitating the necessary schedule meetings to make it happen.
Another potential problem which can and often does happen that planner/schedulers and cost estimators alike need to be aware of and that is because we can load the same resource on more than one activity, in the event that more than one activity with that resource is scheduled to happen simultaneously we may end up with a RESOURCE OVERLOAD situation. This brings up the next and final step in the resource acquisition and allocation process and that is to prepare RESOURCE HISTOGRAMS and conduct the appropriate analysis to identify RESOURCE OVERLOADS and reconcile them.
06.6.3.08 - CPM Schedule Analysis and Resource Limitations
- Now that the project schedule has been allocated resources (for materials, equipment, manpower and the associated costs) the next step would be to determine if it is feasible when it takes into account all existing constraints.
- The Critical Path Method creates the shortest possible schedule if to ignore resource, supply, funding and space limitations. But if resource and funding requirements of CPM schedule could not be met it is necessary to adjust project schedule to make it realistic.
- Failure to do this leads to project finish delays, cost overruns and conflicts that could be avoided if to apply resource constrained scheduling methods and tools.
Critical Path Method is mathematical algorithm for project scheduling that does not account for existing resource constraints and so the schedules created applying CPM may be not feasible because may require more resources than are available. This method determines minimal project duration that could be achieved with unlimited resources. CPM schedule analysis may show what resource requirements are not met, what are material and cost requirements at any time period. Besides scheduled requirements may be very different at different time periods and it is reasonable to try to adjust the schedule to avoid hiring large additional resource amounts for short periods.
Looking at schedule resource usage reports (in table forms or as histograms) it is easy to determine if resources are over-allocated or if there are sharp peaks of certain resource usage and at what periods. In both cases CPM schedule should be adjusted.
Project scheduler should try to create the best possible schedule that takes into account all existing constraints including resource limitations. What is the best depends on project success criterion. It could be minimal duration, minimal cost, maximal profit, etc. In most cases the shortest project schedule is the best. Minimal duration means minimal overhead costs, earlier project deliverables and thus higher profit. But even with the same project duration there is a way to optimize project schedule adjusting activity timing and resource assignment to eliminate or minimize resource requirements peaks.
When resources are over-allocated (this is also called resource conflict) it is necessary to delay some activities that use over-allocated resource to satisfy existing resource constraints. Project duration heavily depends on the right choice of activities that should be delayed.
Unfortunately the problem of finding the shortest feasible schedule considering resource constraints has no practical mathematical solution. Existing mathematical methods require too much time to be practical for real life schedules. So project planners use project management software that create resource constrained schedules basing on some heuristics or level resources manually.
06.6.3.09 - Automatic Resource Leveling
Resource leveling heuristic determines activity priorities in case of resource conflicts, so it defines the rules that determine which activities competing for the same over-allocated resource should be delayed. Examples: an activity with the largest total float is delayed first, or an activity with the shortest duration has highest priority, etc. Some packages use single heuristic rule, others suggest the choice which leveling heuristics to use for concrete scheduling, third use more sophisticated approaches using several rules or iterative processes for finding the best solution. As the result different packages may create different resource constrained schedules for the same project, so project planners should not blindly rely on the schedules proposed by their tools and should study these schedules for possible improvements.
Most popular heuristic applies highest priorities to activities with the least total float calculated in project CPM schedule. It looks natural but in many cases produces poor results.
- Let's look at the sample schedule presented at the Figure 10 below. This schedule was created using Critical Path Method and both resource A and resource B are over-allocated.
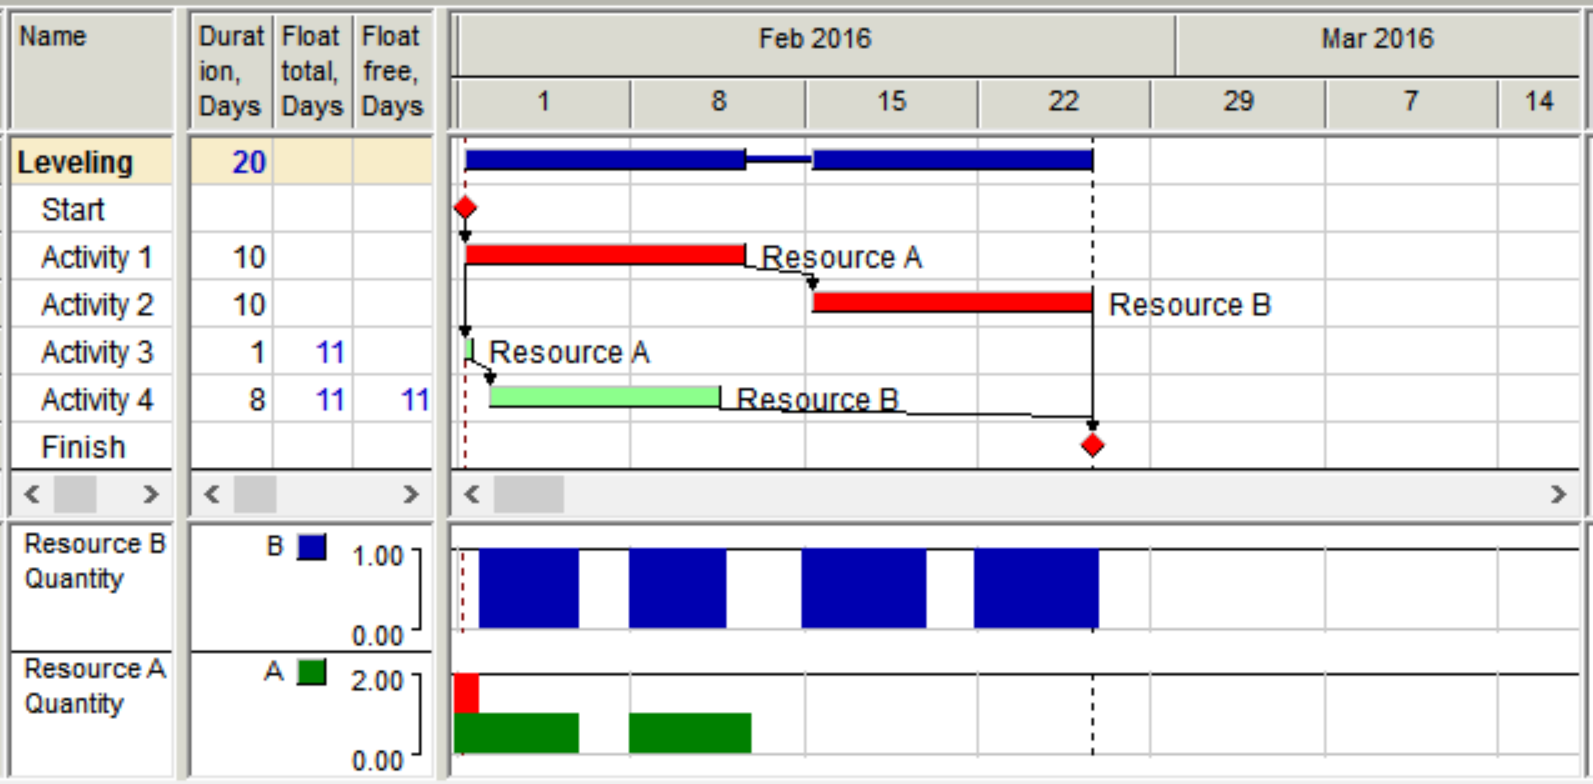
Figure 10 - Sample project schedule calculated using Critical Path Method
Source: Vladimir Liberzon (n.d.) Spider Project Software
Activities 1 and 2 constitute Critical Path, activities 3 and 4 have 11 days total float, but this CPM schedule is not feasible and requires adjustment.
Most widely used heuristic for resource leveling is assigning maximal priority to activities with the least total float in CPM schedule. If to apply this rule to our sample project we'll get the following schedule presented in the Figure 11.
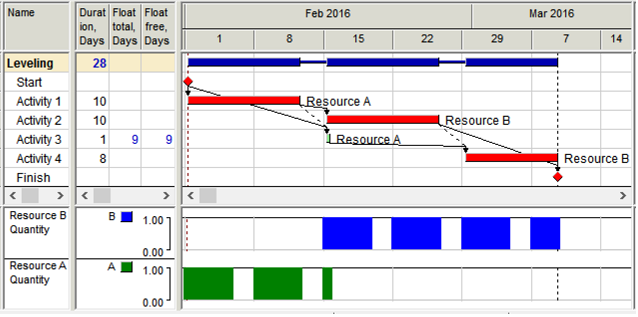
Figure 11 - Sample project resource constrained schedule calculated using least total float priority rule
Source: Vladimir Liberzon (n.d.) Spider Project Software
Project duration became longer because some activities were delayed but resource overallocation was resolved. Dotted dependencies show “resource dependencies” if an activity was delayed because required resource was busy on another activity. Total Float now shows time reserves that activities have in current resource constrained schedule. As in CPM schedule total float is maximal delay of activity start or finish that does not delay project finish. In our example only activity 3 has 9 days total float and other activities are critical.
A sequence of activities with the least total float (usually zero) in resource constrained schedule is called Resource Critical Path or Critical Chain. In our example it is the sequence of activities 1, 2, and 4 (and of course Start and Finish milestones). When resources are not limited Resource Critical Path is the same as traditional Critical Path, so Critical Path is particular case of Resource Critical Path.
But is this schedule optimal? If to use other priority rule or set highest priority to activity 4 the schedule may be improved (see Figure 12 below). So if the software permits to use different priority rules it makes sense to do it and select the best schedule. Even better if the scheduling tool includes resource constrained schedule optimization option. In the last case the software analyzes and improves project schedule using iterative process and may produce better result than any simple leveling heuristic.
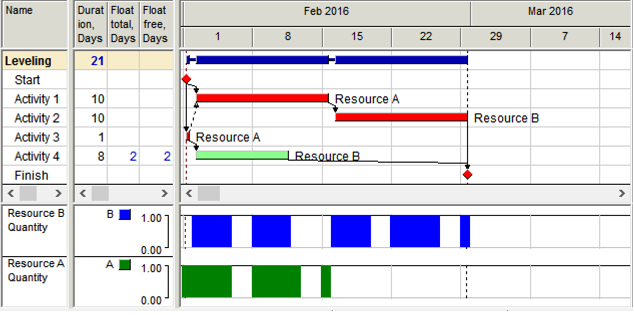
Figure 12 - Sample project optimized resource constrained schedule
Source: Vladimir Liberzon (n.d.) Spider Project Software
Optimal schedule Resource Critical Path is activity sequence 3, 1, 2. In case when project has resource constraints the schedule itself, activity floats and resource critical path depend on the applied leveling rules. Different packages may create different resource constrained schedules for the same project and activities may be critical in one schedule and have total float in another. This should be of particular attention for project planners that use different project scheduling tools and/or import project models from one tool to another.
06.6.3.10 - Manual Resource Leveling
The ways the schedule may be manually adjusted include manual placing on project activities, application of user defined activity priorities, setting artificial resource dependencies, application of artificial time constraints like Start No Earlier Than and thus moving ahead those activities that should be delayed.
Placing (delaying) activities manually for solving resource conflicts should always include setting Start No Earlier Than constraints. In other case project project rescheduling that keeps activity positions is not possible, In large projects manual scheduling is too hard to be practical.
06.6.3.10.1 - Soft / Discretionary Dependencies
Artificial links that are added for adjusting project schedule in accordance with the scheduler wishes are called “soft” or “discretionary dependencies”. In particular soft dependencies are used for solving resource conflicts and usually reflect resource dependencies. Adding soft dependencies is usually iterative process: after entering soft dependencies for first resource conflicts in the project schedule the project is rescheduled and new resource conflicts discovered. These resource conflicts are fixed by adding soft dependencies, etc. This process is similar to manual leveling with adding Start No Earlier Than constraints.
06.6.3.10.2 - Activity Priorities
Another and most practical way to improve project resource constrained schedule is to apply user defined activity priorities. These priorities usually overcome leveling priority rules and permit to set required order of activity execution. Project leveling with new activity priorities shows if the result was improved or other priorities may be tried. This method of manual leveling is also time consuming but easier than others because changing activity priorities is much easier than changing soft dependencies or time constraints. It is usually applied when the schedule needs small adjustments.
But projects are never performed in accordance with initial plans – activity volume and duration estimates may change, some activities may be delayed or executed out of sequence, resource availability may change, etc. So the project should be rescheduled many times during the project life cycle and initially selected sequence of activity execution may become obsolete and non-optimal. So it is necessary to remove all artificial priorities, dependencies and constraints before each new project rescheduling and optimization. It is necessary to keep the record of all priorities, soft links and constraints added for resource constrained schedule improvement and adjustments to be able to remove them and set new ones.
06.6.3.11 - Material Supply Schedule Adjustment
When project resource constrained schedule is obtained project material and funding requirements become known. Comparing project material requirements with initial supply schedule it is possible to learn if material and equipment requirements are met. If not material supply schedule should be adjusted if possible. If after all possible adjustments material requirements are not met project schedule requires adjustments that is called material leveling.
06.6.3.12 - Material Leveling
If material supplies are constrained activities should be delayed if they require more materials than are available at the period of activity execution. Most packages do not have necessary functionality for automatic material leveling and thus their users adjust project schedules manually by adding Start No Earlier Than constraints to certain activities. These constraints should be regularly reconsidered during project execution.
Materials may not only be consumed but also produced on project activities. Material production should be modeled together with material consumption.
Spatial resources are modeled the same way as materials. Space is consumed at the first activity when some crew starts to work at some limited space and is produced (supplied) when the last activity of this crew at this place is finished. If the software does not have automatic material leveling functionality space constraints are taken into account manually usually by creating soft dependencies that reflect right crews movements.
For material, space and cost leveling it is necessary to model not only consumption but also production of materials, space and project funding.
In the Figure 13 below 4 we added material consumption on our project activities and material supply activities. Material Flow diagram shows that there is time period when project schedule requires more resources than are available.
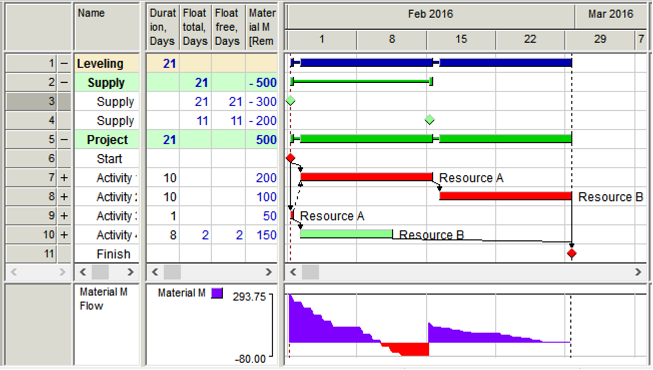
Figure 13 - Material Flow in sample project
Source: Vladimir Liberzon (n.d.) Spider Project Software
Figure 14 below shows Material constrained schedule for our project. In this schedule activity 4 was delayed because materials available at activity early start were not sufficient for its execution without activity interruption. This schedule shows that project could start three days later without delaying project finish.
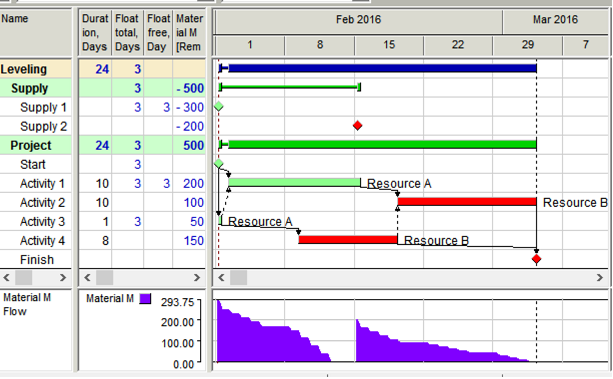
Figure 14 - Material constrained schedule of sample project
Source: Vladimir Liberzon (n.d.) Spider Project Software
06.6.3.13 - Funding Schedule Adjustment and Cost Leveling
Project financing schedule should be adjusted if project funding requirements are not met in the schedule that takes into account all other constraints. It is done the same way as was described for Material supply schedule. Project cost leveling is done the same way as material leveling. Most packages do not have cost leveling functionality and their users do it manually as was described in Material Levelling above.
06.6.3.14 - Resource Constrained Scheduling Tools & Outputs
The following tools are useful when examining the results of the resource allocations and schedule adjustments:
- Resource Constrained Schedule - Resource Constrained Schedule obtained as the result of project leveling may be presented different ways. Project schedule may be presented in the Table form, as Gantt Chart, Network Diagram, Time-Location Chart or 3D. All of these presentations show data from the same project model. In addition to volume and time data Time-Location Chart and 3D presentation require coordinates of activity start and finish positions that should be entered in the project model in addition to other data.
- Resource Requirements - Project schedule defines what resources are needed at any time period. Project resource requirements may be presented in table form or as resource histograms. This information is used for planning resource acquisition.
- Resource Constrained Floats - Resource Constrained Total Float is calculated the same way as in CPM schedule – it is activity work time between Early and Late Start (Start Float) or between Early and Late Finish (Finish Float). If the schedule is resource constrained then both forward and backward passes should be calculated considering all existing constraints including resources, material and cost limitations.
- Resource Constrained Free Float - is activity work time between its Finish and minimal of succeeding activities Start.
- Resource Assignment Total Float - shows resource work time an assignment may be delayed with delaying project finish. When resource assignments are independent assignment floats and activity floats may be different and resource assignments may be critical even if an activity where the resource is assigned has positive total float.
All resource constrained floats of the same activities and assignments may be different if the schedule was calculated using different heuristics. So the same activity may be critical in one schedule and have positive total float in another schedule of the same project.
- Attention: it is often considered (by expeirenced practitioners) that most project management packages calculate wrong floats in resource constrained schedules!
- Resource Critical Path - Resource Critical Path was discussed above As we had shown in our examples the schedules calculated using different leveling priorities may be different and have different Resources Critical Paths.
- Attention: since most project management packages calculate wrong activity floats in resource constrained schedules they do not calculate right Resource Critical Path.
- Resource Gantt Chart - Resource Gantt Chart shows time periods when resources are used in the current schedule and on what activities. Resource Gantt Chart for our sample project is shown in the Figure 15 below.
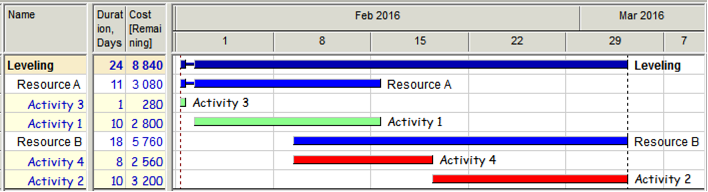
Figure 15 - Resource Gantt Chart of the sample project
Source: Vladimir Liberzon (n.d.) Spider Project Software
- Resource Gantt Chart - may group resources in accordance with Resource Breakdown Structure and show what department should do what, when and for what cost.
- Material Gantt Chart - Material Gantt Chart shows time periods when materials are consumed or produced in the project schedule and on each activity. Figure 16 below shows Material Gantt Chart for our sample project.
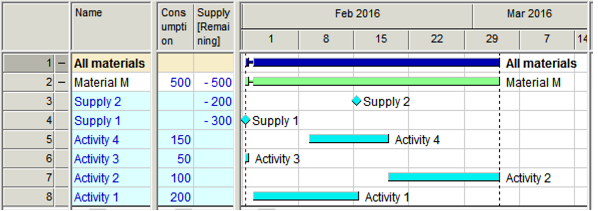
Figure 16 - Material Gantt Chart of the sample project
Source: Vladimir Liberzon (n.d.) Spider Project Software
Like in Resource Gantt Chart it is possible to create any Material Breakdown Structure and to get reports on material groups.
- Resource Histograms - Resource histograms is convenient graphical report on resource requirements and usage at any time periods through the project life cycle. They may show resource quantities or work hours per selected time unit (hour, day, week, etc.). Examples of resource histograms may be seen at Figures 10, 11 and 12 above where they show calculated quantities of resources A and B in the sample project.
- Resource histograms help to find the periods of resource overallocation in the current schedule and to apply necessary corrective actions. These actions may include increasing resource availability, assigning alternative resources or making changes in the project schedule (resource leveling).
- S-curves - Resource requirements and expenses at the project start are usually lower than in the middle of project execution. The same is true at the project end – when most results were achieved resource requirements become lower. So the curves representing project cumulative cost and resource requirements are usually flatter at the beginning and at the end of the project than in the middle of the project execution. That is why they got the name S-curves due to their S-like shape, so by S-curve we usually mean the graph of project cumulative cost, resource quantities, or hours plotted against time. S-curves may be created for early and late dates of activity execution. If to represent both curves at the same chart we get the graph that is called "Banana curve" for its usual shape. Figure 17 below shows a "Banana curve" for project resource-hours of our sample project.
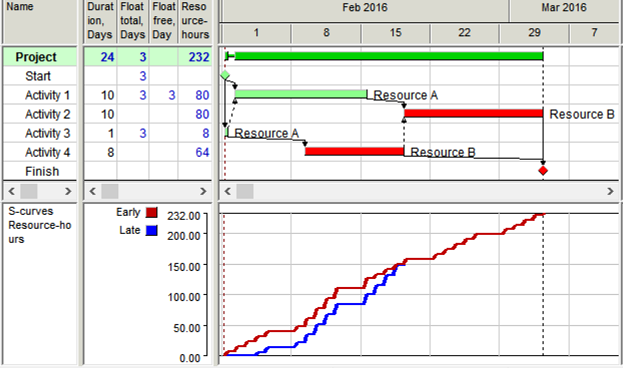
Figure 17 - Resource-hours "Banana-curve" for sample project
Source: Vladimir Liberzon (n.d.) Spider Project Software
If actual cumulative graph remains within the Banana-curve (exceeds late though may be lower that early S-curve) project has chances to be performed on time and within budget.
06.6.3.15 - Labour Analysis using Resource Loaded Schedules / Histograms
Resource Histograms are the starting point for labour analysis but it requires that both owner’s and contractor’s develop resource loaded schedules. For the owner’s project control practitioners, this should be done during the Phase 3 and Phase 4 of the project down to Level 3 minimum and Level 4 CPM schedule being preferred. For contractor’s project control practitioners, the requirement to submit a fully cost and resource loaded CPM schedule is usually done after the bid has been won and the contract has been signed, but (ideally) before the Notice to Proceed (NTP) has been issued.
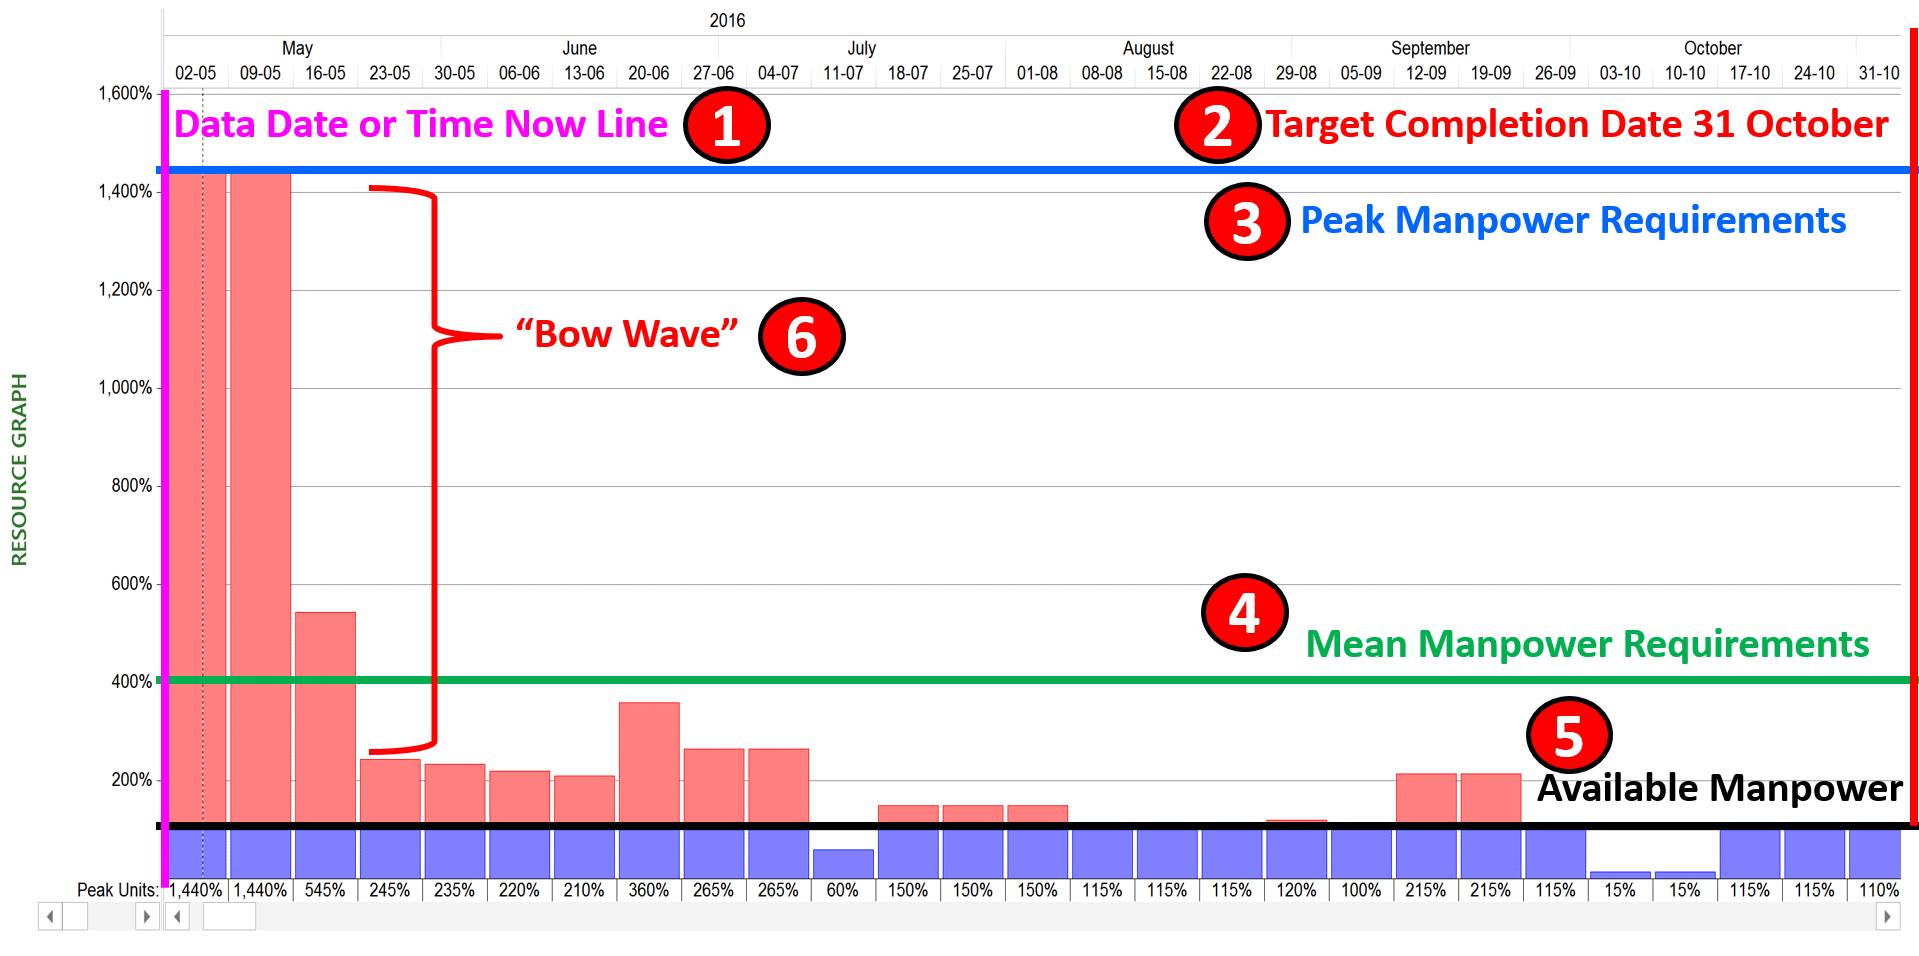
Figure 18 - Showing typical manpower histogram before levelling
Source: Giammalvo, Paul D (2015) Course Materials. Contributed Under Creative Commons License BY v 4.0
In Figure 18 we can see:
(1) Data Date or Time Now Line of 1 May
(2) Target Completion Date of 31 October
(3) Peak Resource requirements (in this example manpower), which is showing that over the next two weeks, we need 1400% or 14 of this specific manpower resource. More importantly, we can appreciate that given we need 14 of these resources and given we only have one of them, that this “tsunami” wave is going to follow the data date as it progresses and unless we either add more resources and/or extend the completion date that this project simply has too much volume of work for the available resources to accomplish in the time frame allotted.
(4) Mean Resource requirements which shows us that over the planned duration of the project we need an AVERAGE of 400% or 4 of this manpower resource. What this means is IF management wants to hold the October 3 deadline then they need to approve a MINIMUM of 4 of this resource.
(5) Available Resource which shows that although we really need on average 4 of this particular manpower resource that currently we only have one assigned. This is clearly an impossible situation and one that the planner/scheduler needs to bring to the attention of the relevant decision makers along with the recommendations to correct or alleviate this problem. What need to be recognized is if this RESOURCE OVERLOAD condition is not remedied, this project will almost surely finish later than is currently scheduled, more likely by at least a factor of 4. (Assuming there is 4 X 5 months = 20 person months of work and you only have one resource, then this project will take at least 20 months)
(6) “Bow Wave” is a common occurrence we see when we have constrained all activities to start “as early (soon) as possible” (ASAP) When we do this, all activities slide to their early start dates. The impact of this is these activities, even though many of them may have Total or Free Float “hang” on the data date. The impact of this is the resources for both critical and non-critical activities “bunch up” creating what is known as a “bow wave”. To reduce if not eliminate this phenomena, we need to LEVEL the resources.
This example shows us what is known as a “Bow Wave” and this becomes one of those “early warning signs” or “triggers” that our project is headed for trouble. What this shows is work which was previously scheduled that has NOT been done is now “hanging” or being pushed by the data date. This “backlog” of incomplete work, if not addressed, will eventually become a tsunami when it hits the end date of the project and will clearly push the end date of the project into the future until the backlog of unfinished work dissipates.
However, because the work load is not consistent (which is often the case) hiring 14 or even 4 full time people would be foolish as there are some weeks when we need less than one person. So when we are trying to analyse resources we have to look not only at the peak but the average as well. To do this we can use what is known as RESOURCE LEVELING which may or may not alleviate the problem but it will give us a more realistic look at what manpower we really need.
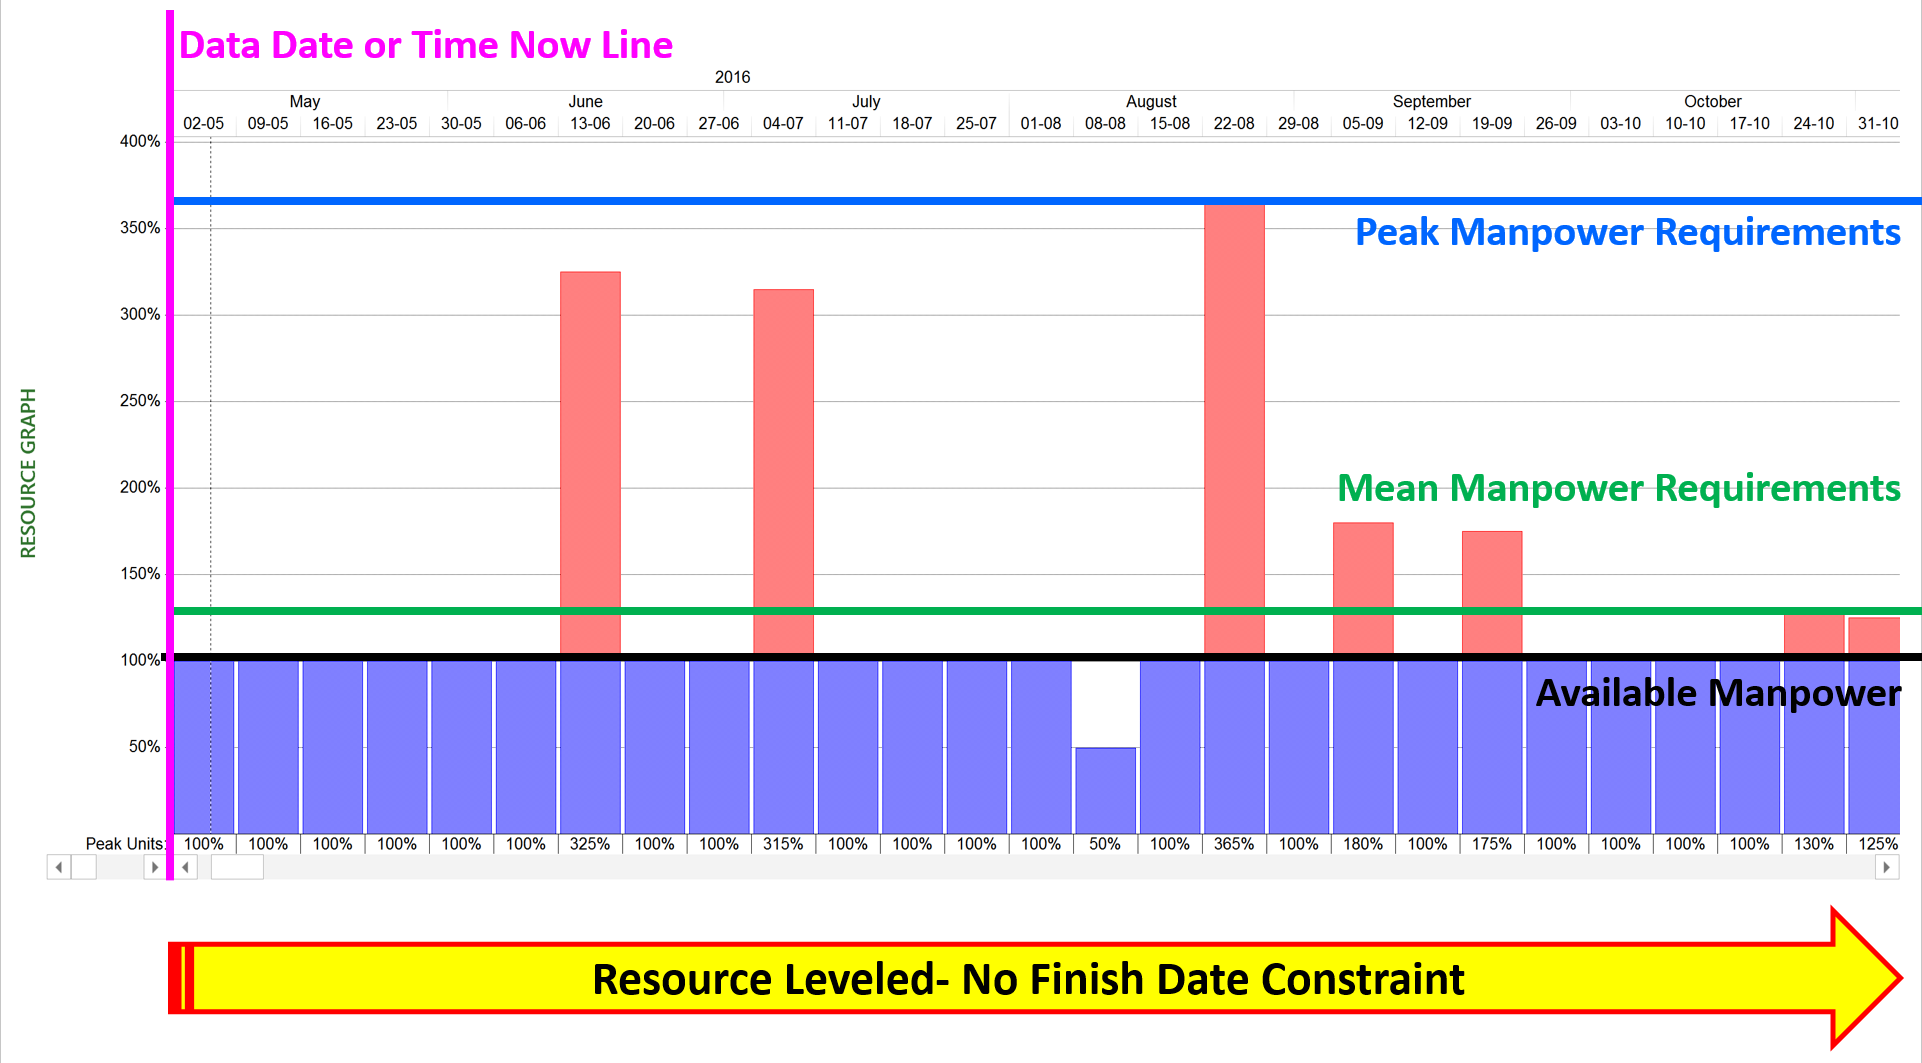
Figure 19 - shows the same resource AFTER being levelled
Source: Giammalvo, Paul D (2015) Course Materials. Contributed Under Creative Commons License BY v 4.0
When we resource level a project, we normally have the computer to do it for us, for no other reason than it is too complicated to try to do by hand for anything more than 5 or 10 activities. When using the computer to resource level, we can set the attributes that we want the program to use to prioritize how we level, but NORMALLY, the standard or recommended progression is:
(1) Level Activities with Free Float and then when Free Float is gone;
(2) Level Activities with Total Float and when the Total Float is gone;
(3) Level Activities with the least or smallest NEGATIVE float values (let the end date slip)
In this scenario, we assumed that we cannot get more than one resource assigned to this project. As we can see after levelling, we have eliminated the “bow wave” or backlog of work that is “hanging” on the data date, but we still have 7 weeks where we have to add more resources. This levelling has also pushed out the completion date of the project by 4 times (from 5 months to 20 months). So now as project control practitioners we have shown our management the two worst cases- the “as is” and the fully levelled results.
Using this information we can now proceed to perform some other “what if” analysis using both “LEVELING” and SMOOTHING to see what the optimum number of people we need pushing out the end date as little as possible. In this case, the “optimum” or “ideal” solution worked out to be two full time people for 80% of the duration of the project dropping off to only a single resource for 3 weeks and only a single resource part time for the final 10 weeks. However as we still have a small “bow wave” it means we need to allow SOME of the “non-critical” activities to slip meaning we have now built in a little bit of “risk buffer” by only scheduling in one person part time for the last 10 weeks. It also means that if all goes well that we MAY be able to actually finish earlier than the last week of February. This is the kind of “realistic” (appropriately risk adjusted) scheduling that truly professional level project control practitioners need to be producing, assuming we want to put an end to so many projects finishing late and/or over budget.
But without using the histogram as the primary analysis and communications tool, it is hard to make the case to management WHY you need more resources, how many resources do you need, when to you need them and for how long, and what happens if you don’t get those resources. Using this approach, management will rarely deny your request for more resources or face the risk of accepting blame for not providing them to the project.
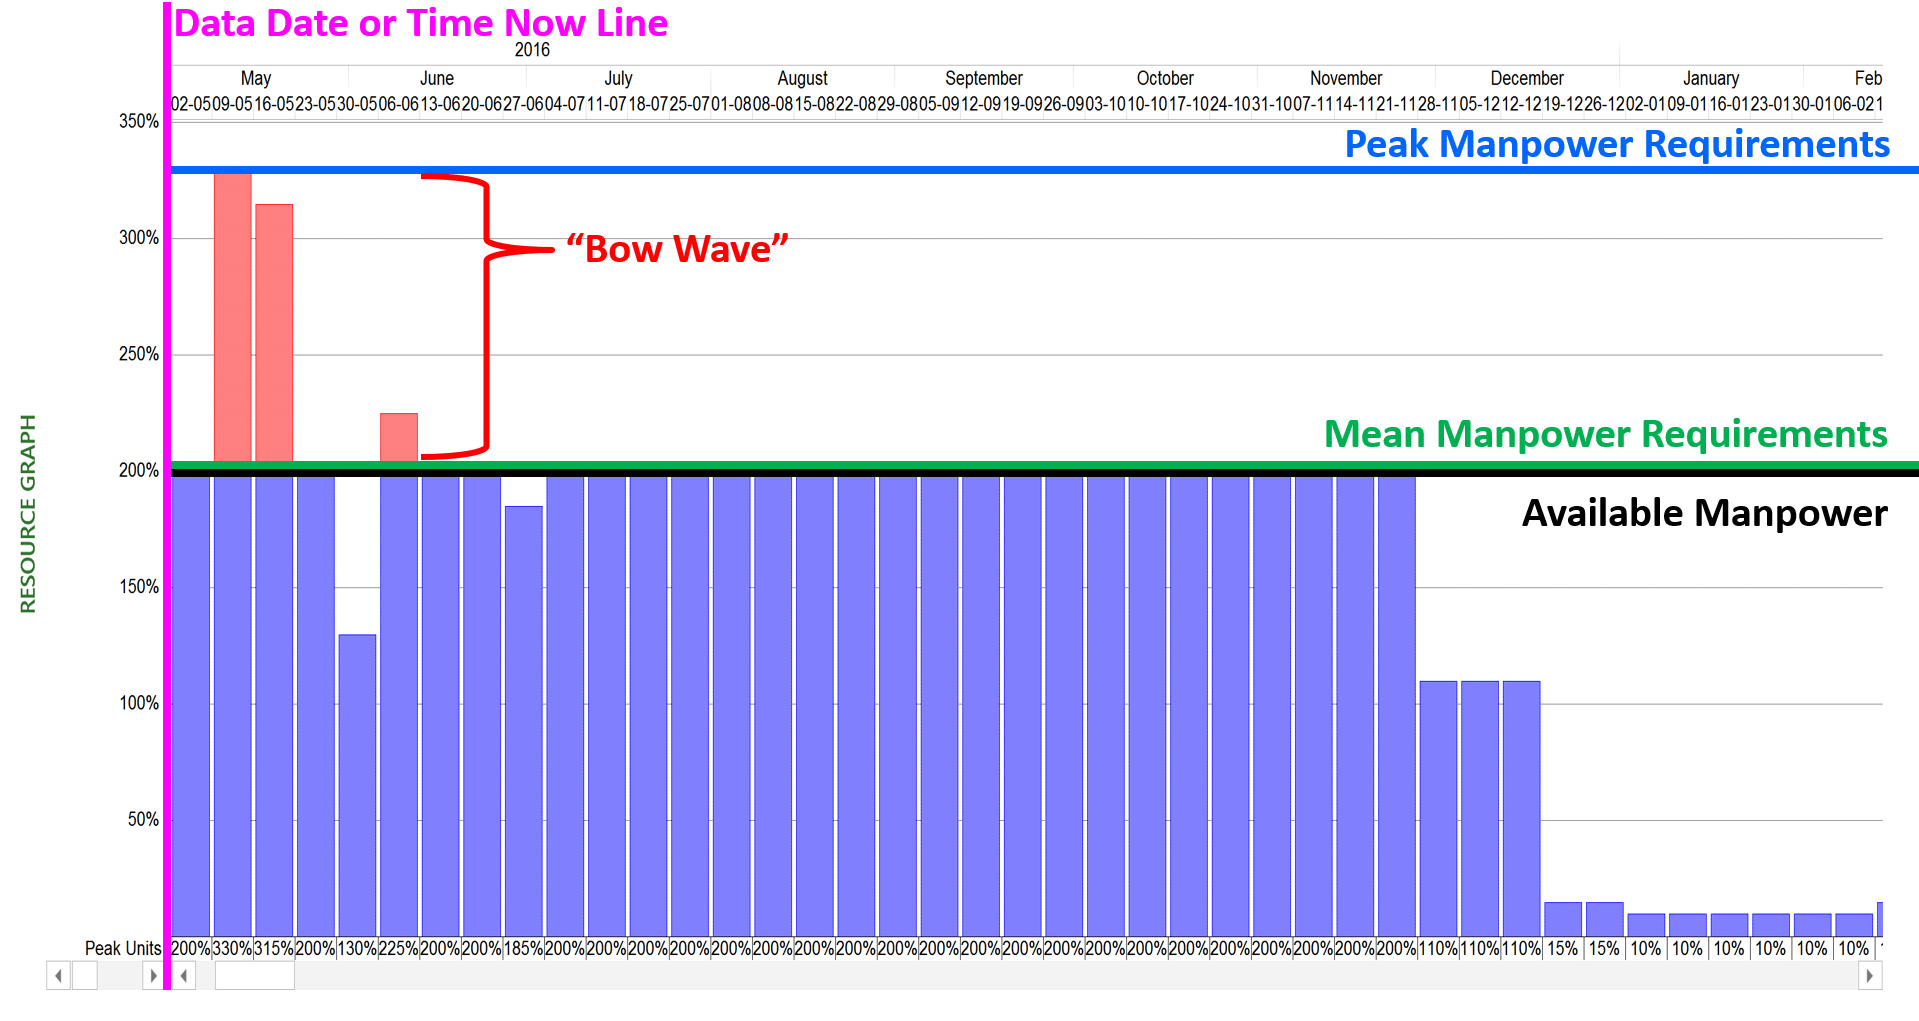
Figure 20 - Showing the Impact of Adding more Resources and Levelling Again
Source: Giammalvo, Paul D (2015) Course Materials. Contributed Under Creative Commons License BY v 4.0
For cost estimators, you need to remember that if a project has been levelled, and if the original completion date has been pushed out, that even though the total number of resources has not changed, you need to add in the costs of EXTENDED OVERHEAD (both contractors and owners) for the amount of time the levelled project completion date has slipped.
06.6.3.16 - Early and Late Date S Curves (Performance Measurement Baseline)
As indicated by using the Lego Blocks as the basis for the Guild of Project Controls Integrated Methodology, all of the modules in the GPCCAR are linked together. What this means is the outputs from the Resource Allocation process are done simultaneously and in conjunction with Modules 7, Managing Planning & Scheduling and Module 8 Managing Cost Estimating and Budgeting, with the ultimate objective being to produce a Performance Measurement Baseline (PMB) as the basis against which to capture, record, track and analyze progress, which is done in Module 9- Managing Progress.
So rather than duplicating the same information in other modules, Resources was given its own unique Module, understanding that the outputs from this model become inputs for many other modules, most importantly, Module 7 Managing Planning and Scheduling and Module 8 Managing Cost Estimating and Budgeting.
Explained another way, this module plus Module 7 and Module 8 are combined to produce the baseline against which progress is measured.
The major difference between the Performance Measurement Baseline prepared by the owner vs the Performance Measurement Baseline prepared by the contractor is the contractor's PMB contains the contractor’s SELLING PRICE while the owner’s PMB contains their COST for these same activities. This seemingly small difference becomes important later on.
The Performance Measurement Baseline is most often is viewed as what is known as the “S” Curve and it should consist of not one but TWO curves which have been defined by the projects Cost and Resource Loaded schedule:
- Early Date Curve - generated with all activities scheduled to start AS SOON AS POSSIBLE (ASAP)
- Late Date Curve - generated by constraining all activities to start AS LATE AS POSSIBLE (ALAP)
This is what the PMB should typically look like from both the owner and contractors perspective:
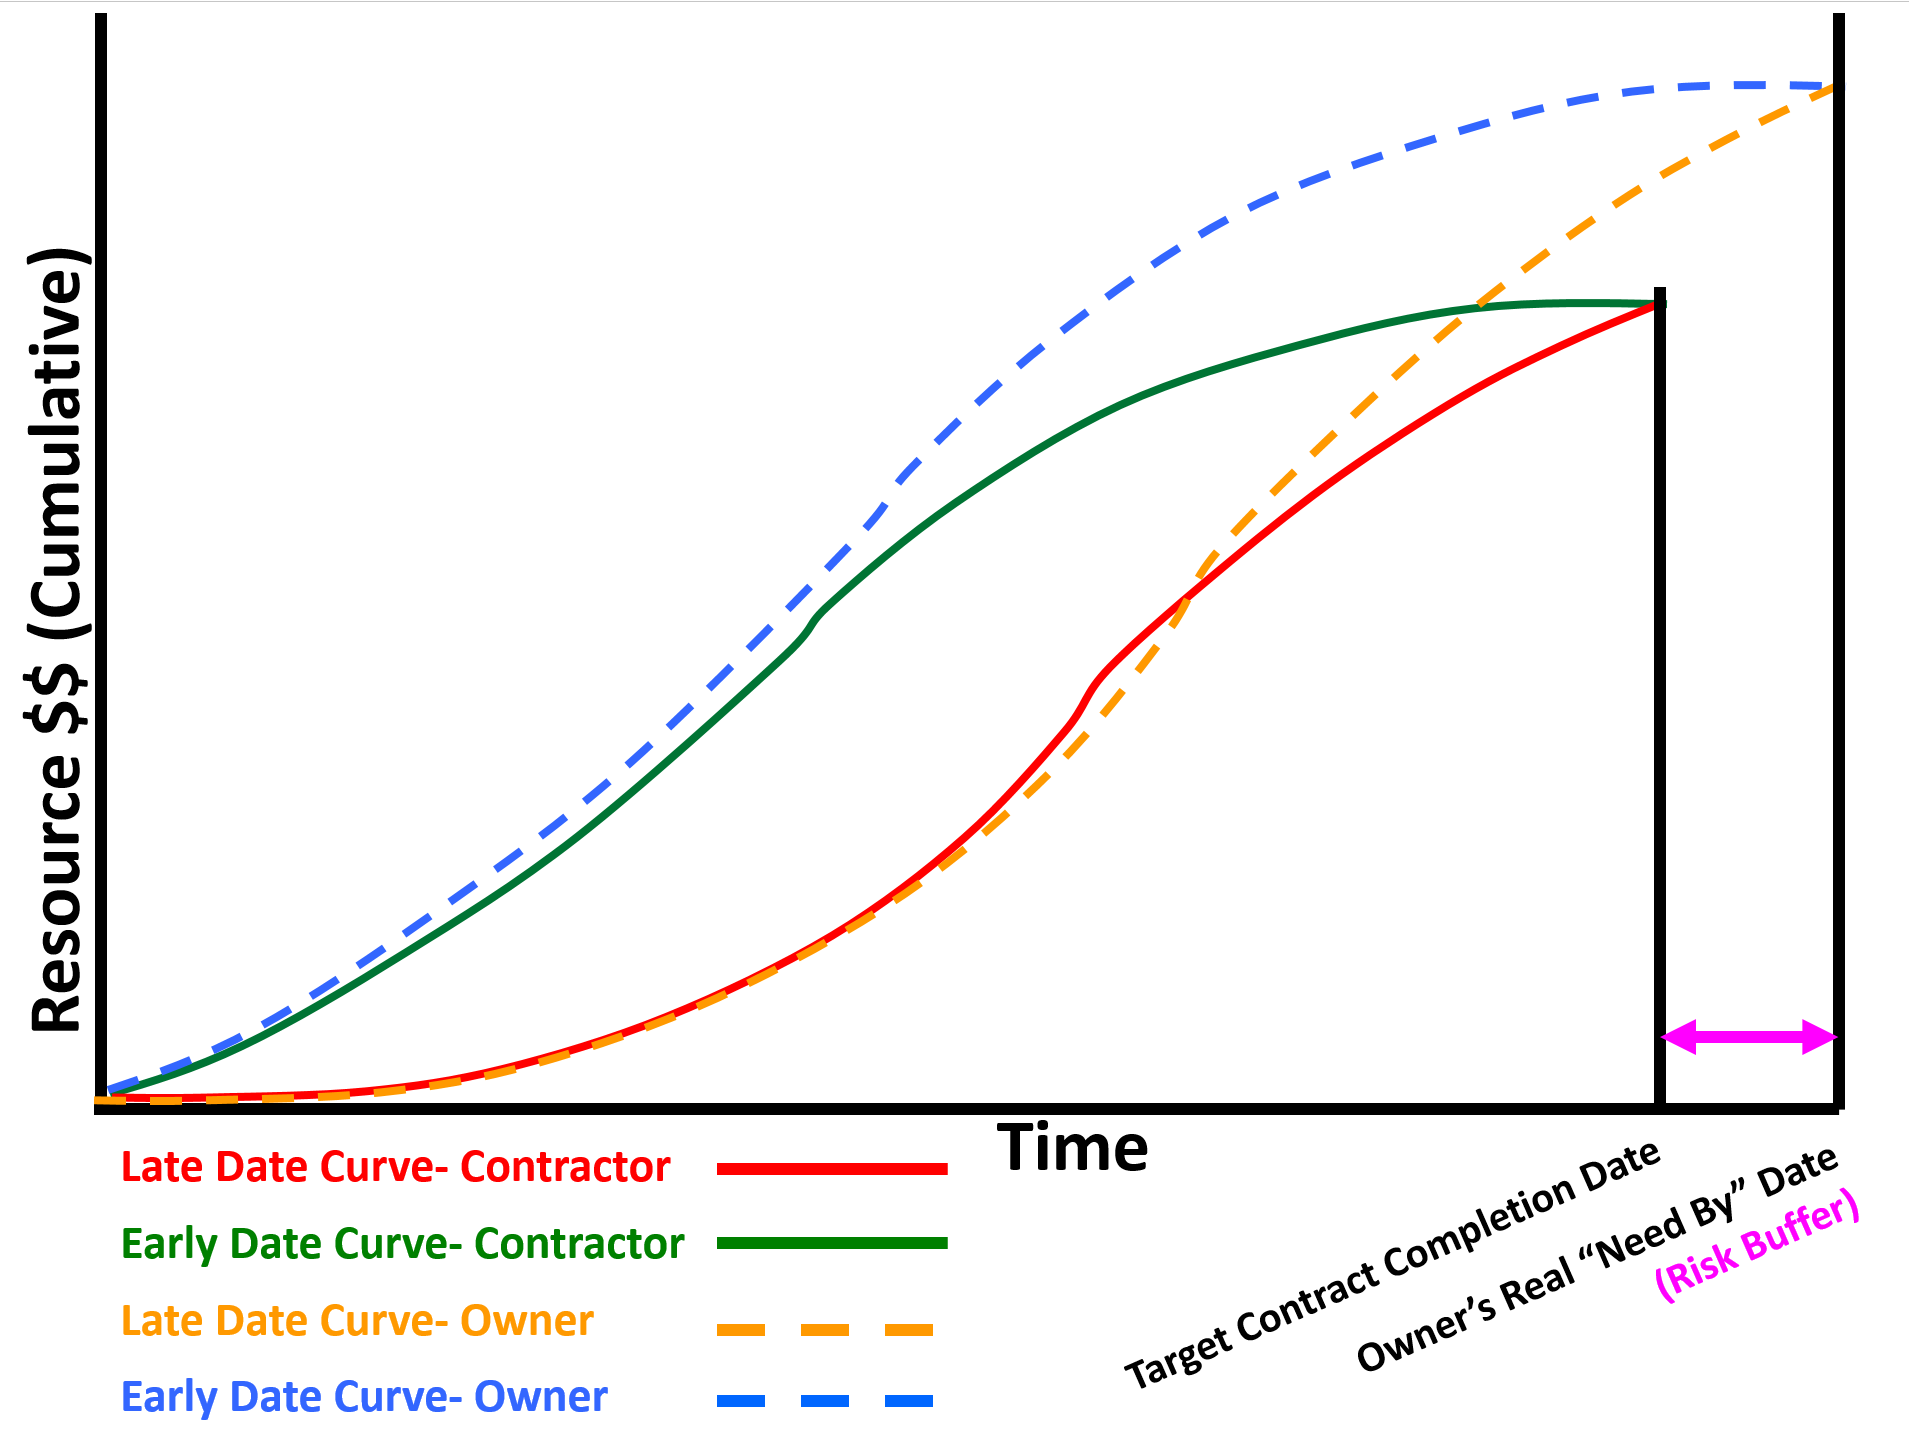
Figure 21 - Showing Owners Early and Late Date Curves vs Contractor’s Early and Late Date Curves
Source: Adapted from Humphrey's Gary (2015) Project Management Using Earned Value, 3rd Edition
The reason these curves are not the same is when the contractor SUBMITS the Cost and Resource Loaded Schedule to the owner for acceptance / approval the owner has to ADD to that schedule:
- Owner’s Management Activities (i.e. Project Management, Project Controls, Safety, QA/QC etc)
- Owner Supplied Equipment or Materials
- Owner’s Risk Contingency (i.e. both Time and Cost)
In Figure 22 below, using our Case Study developed in Module 08-6 - Developing The Contractors Cost Estimate (Bottom Up), we can see this is what the S-Curve or Performance Measurement Baseline (PMB) would look like coming from the CONTRACTOR to the OWNER. Once the owner has APPROVED and ACCEPTED this baseline, to make it of full value to the OWNER, the owner will have to ADD activities to cover:
- Owner’s Management Activities (i.e. Project Management, Project Controls, Safety, QA/QC etc)
- Owner Supplied Equipment or Materials
- Owner’s Risk Contingency (i.e. both Time and Cost)
Given that credible evidence exists supporting that project management is not working as well as it could or should for both owners and contractors alike, it is important to note that because one of the primary or most important objectives of a CPM schedule is to generate the early and late date “S Curves” or Performance Measurement Baseline (PMB) it requires that for both owner and contractor that every single activity be cost (resource) loaded. Failure to fully cost and resource load each activity in the schedule will produce an S Curve which is incomplete and/or does not reflect the full and true scope of work as expressed in money over time. (Time phased budget).
Implicit in this, especially for large schedules, that “rolling wave planning” be used to avoid having to produce Level 5 or 6 activities far into the future. Explained another way, for large schedules containing 5,000, 10,000 or more activities, while each and every activity should be cost/resource loaded, by changing the level of detail from greater to lesser the further into the future we get, enables us to generate accurate S Curves (both owner and contractor) without having to cost load each activity down to Level 4, 5 or 6.
 Figure 22 - The S-curve
Source: Giammalvo, Paul D (2015) Course Materials. Contributed Under Creative Commons License BY v 4.0
By adding activities to cover these three additional items provided by the OWNER, and by extending the completion date to beyond the contractual completion date to cover owner’s testing and commissioning activities, will almost always result in the OWNER’S PMB being LARGER than that of the contractor as well as LONGER DURATION than the contractor’s PMB or S-Curve. This can be seen conceptually in both Figures 1 above and Figure 3 below.
To explain a different way, it is NOT a “best tested and proven” approach for the owner to track project performance against the contractors PMB alone. Why? Because without the OWNER capturing his/her own costs for work over and above the owners’ costs of the work done by the contractor, is going to give the owner an overly optimistic Cost Performance Index (It will usually remain at 1.0) and unless the Owner’s and Contractor’s completion dates are exactly the same (which also is not usually the case) it will give the owner an unrealistically optimistic SPI as well.
To see more on how to the OWNER can track their own costs against their PMB, see Module 09.3.3.2.2 Closing the Accounting Time Gap, Figure 11. Following this “best tested and proven” practice, the owner will be able calculate and use their own SPI and CPI which in most cases will NOT be the same as that of the contractor.
This is what the PMB should typically look like utilizing the Contractors PMB, Owner’s PMB and Owner’s Approved for Expenditure (AFE):
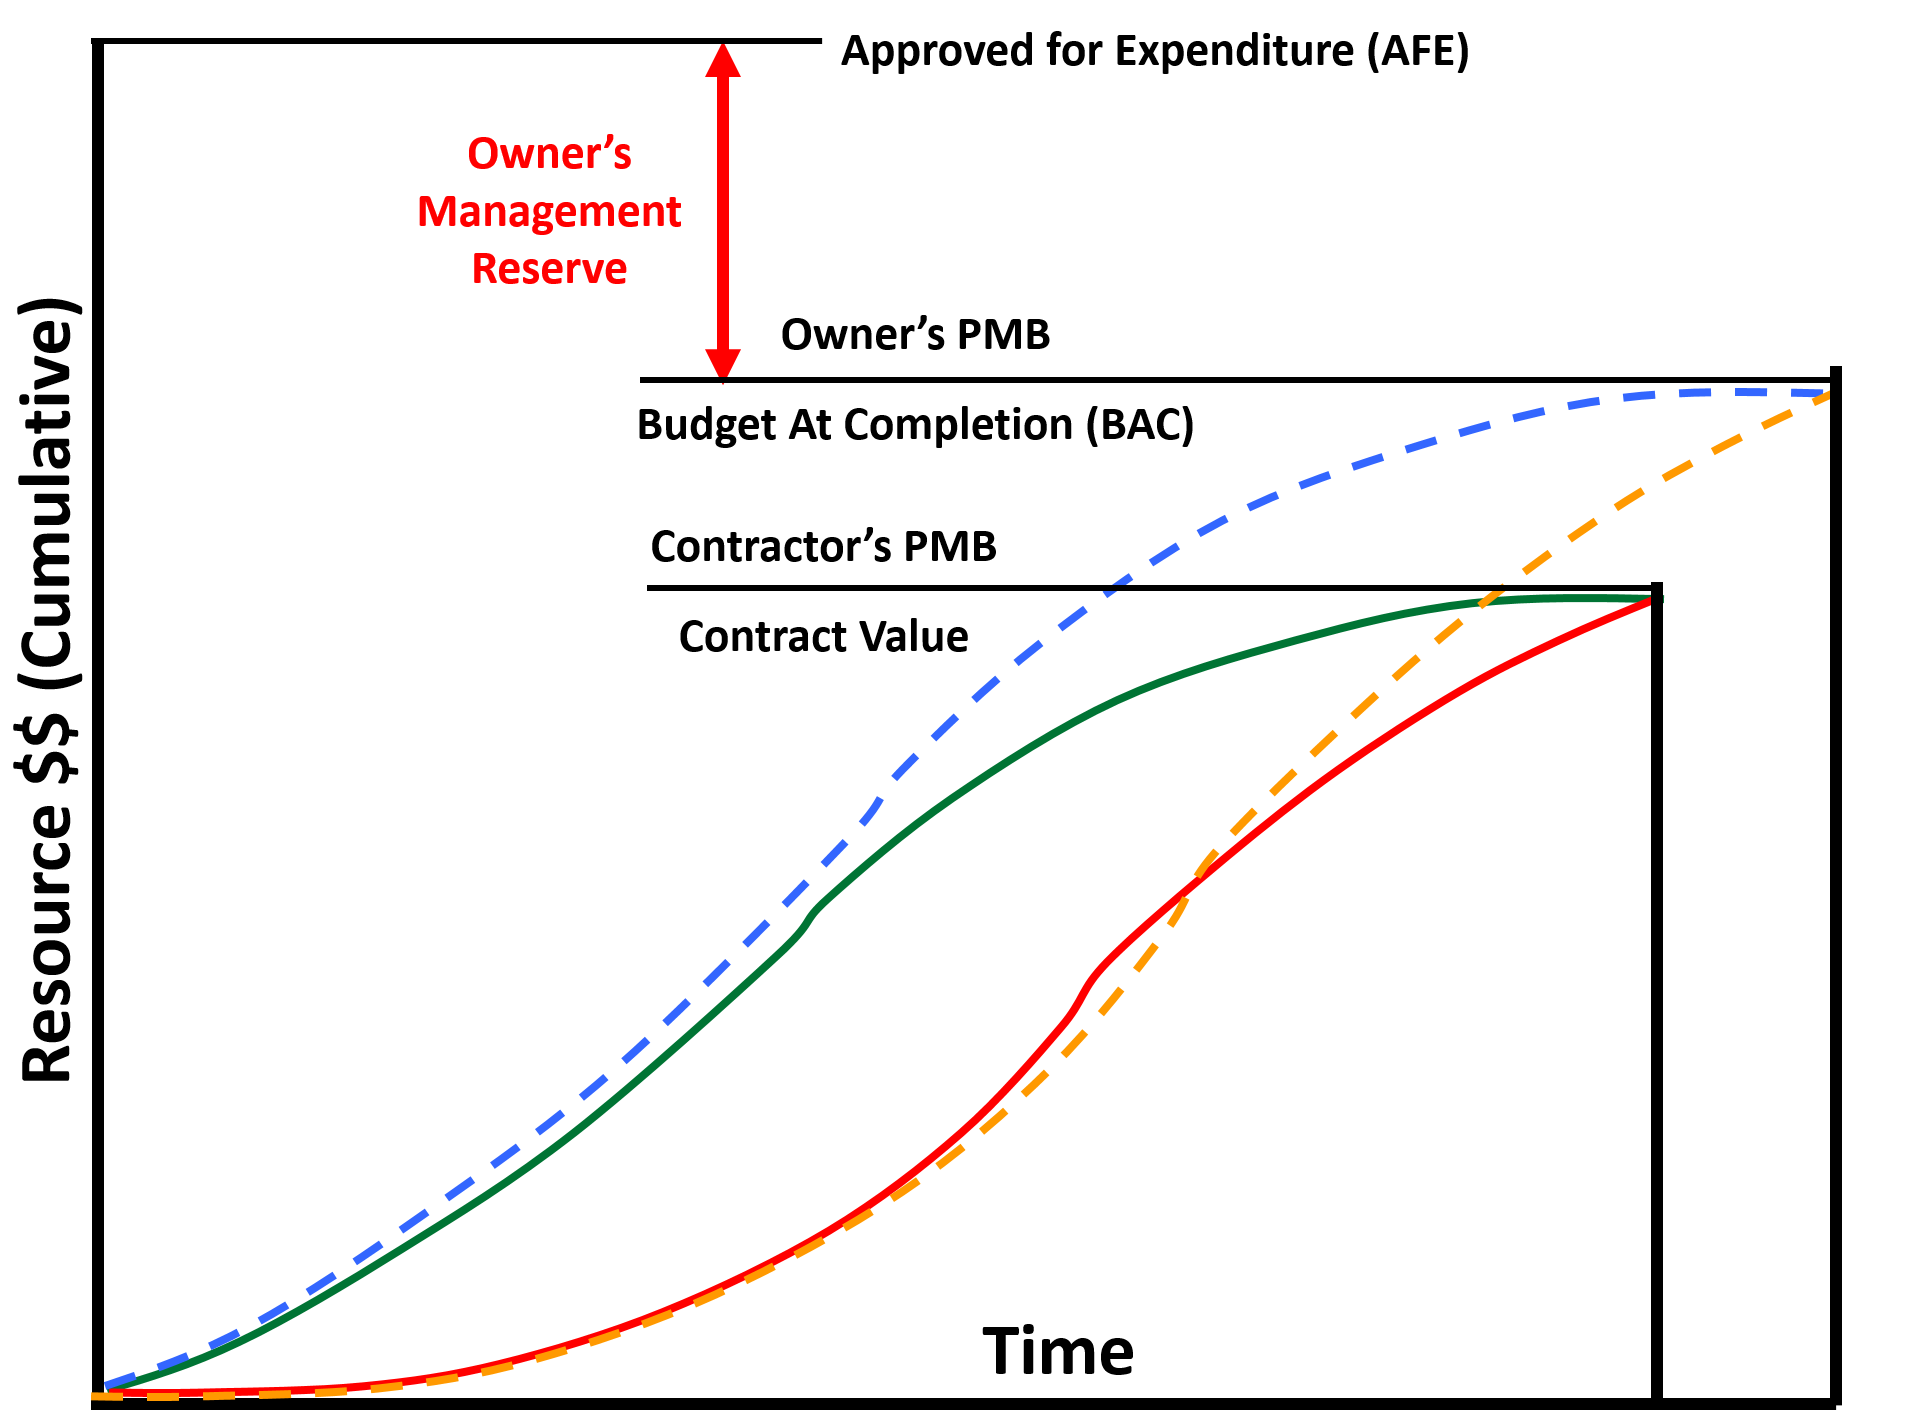
Figure 23 - Illustrating Contractors PMB, Owner’s PMB and Owner’s Approved for Expenditure (AFE)
Source: Giammalvo, Paul D (2015) Course Materials. Contributed Under Creative Commons License BY v 4.0
What the OWNERS “S” curve should NOT contain is undistributed money, known as MANAGEMENT RESERVE. For OWNER’s undistributed budget is NOT allowed to be included in the S Curve as it does not belong to the Owner’s project manager to spend, but as the name implies, belongs to the SPONSORING management who are free to allocate it as they deem appropriate, based on recommendations and / or requests from their project manager.
While CONTRACTOR’s are unlikely to ever see the OWNER’s S curve they both will be tracking project progress against the Contractor’s PMB, as the CONTRACTOR’s EARNED VALUE (BCWP or EV) becomes the OWNER’s ACTUAL COST of WORK PERFORMED (ACWP or AC) for the contractors activities. This will be covered in more detail below.
06.6.4 - OUTPUTS
RESOURCE ASSIGNMENT OUTPUT:
- RESOURCE ASSIGNMENTS - RESOURCES MAY BE ASSIGNED DIFFERENT WAYS:
- They may work as a team and do the job together – in this case if some resource belonging to the assigned team is not available the whole team will not work,
- Assignments may be independent – resources may do their work independently of each other and at different time. Independent assignments are useful for modeling work in several shifts.
Assignments may be partial when assigned resource works on the activity only certain percent of the work time. In this case the rest of its work time assigned resource may use working on other activities. Assignments may be variable when activity resource requirements are defined as a range, specifying minimal and maximal quantity and workload. An example: brick works may start when two masons become available and if more masons will become available (up to maximal number) before the work is finished they will join and accelerate the work. The same with resource workload: the job may start if assigned resource can devote at least 40% of work time to this activity but if nothing else is required assigned resource will work on the activity 100% of work time.
- ASSIGNMENT PROPERTIES
RESOURCE ASSIGNMENT PRODUCTIVITY DETERMINE THE DURATION OF VOLUME TYPE ACTIVITIES.
Productivity may be set to individual assignments or to assigned crews. It is usually measured as volume of work done in time unit. Activity duration is calculated as Volume of work divided by total productivity of assigned resources for team full time assignments but it is more complicated for independent assignments. With independent assignments activity duration is calculated in the process of scheduling when it becomes known what share of activity volume will be done by each resource.
Another assignment property is resource workload that is 100% for full time assignments and may be less for part time assignments. For part time team assignments team productivity may be calculated as the sum of assigned resource productivity multiplied by their workloads.
Resource assignment properties may also include assignment cost and material consumption that may be set as fixed or as an amount per volume or duration unit.
- CREW ASSIGNMENTS - When many activities are executed by the same resources working as a team it makes sense to create Resource Crew. Resource crew (or multi-resource) consists of resources that work together to execute activities of certain types. Instead of assigning individual resources project planner may assign the whole crew and that is the same as assigning all crew resources as the one team.
- SKILL ASSIGNMENTS - When the same job may be done by different resources that have required skills it makes sense to assign resource skill and not individual resources. If resource skills were assigned the software (if has required functionality) or people select who will do what basing on resource skills, availability, productivity, cost and user defined priorities. In this case activity duration may depend on resource selection and is not known before project scheduling.
- MATERIAL ASSIGNMENTS - Materials may be required for activity execution and by resources when they do their works. Activity material requirements may be set as fixed (not dependent on activity volume or duration), or as an amount per time or volume unit. In the latter cases material requirements are proportional to activity duration or volume. But sometimes resource consumption is not linear. For example, an equipment may be installed at the beginning or at the end of activity execution, In this case it is necessary to define material consumption profile on this activity.
- ADJUSTED RESOURCE AND MATERIAL DIRECTORIES - Projects are unique, so it is usual when new projects require resources and materials that were not used earlier and are absent in the corporate resource and material directories. In this case these resources and materials not only be assigned but also added to resource and material directories to be used not only in current but also in future projects.
- PERFORMANCE MEASUREMENT BASELINE – Cumulative Early and Late Date S curves showing the cost of all resources- people, machines and materials required to execute the work in the allocated time frame.
06.6.5 - REFERENCES & TEMPLATES
- PRIMAVERA P6 TUTORIAL: ASSIGNING RESOURCES TO ACTIVITIES (2012) HTTPS://WWW.YOUTUBE.COM/WATCH?V=25FENPEKRCA
- PRIMAVERA P6 TUTORIAL: CREATING RESOURCES (2013) HTTPS://WWW.YOUTUBE.COM/WATCH?V=ICCJPGZ06MI
- MICROSOFT PROJECT 2013- ASSIGNING RESOURCES (2013) HTTPS://WWW.YOUTUBE.COM/WATCH?V=GW2MT1GJTS4
- MS PROJECT 2013- RESOURCE BASICS HTTPS://WWW.YOUTUBE.COM/WATCH?V=XQTHOJEJWNW
- UTAH DEPARTMENT OF TRANSPORTATION (UDOT) PRIMAVERA TRAINING MANUAL (2011) CHAPTER 10 FTP://FTP.UDOT.UTAH.GOV/COUDOT/PRIMAVERA%20P6%20V.7%20TRAINING%20MANUAL/CH.%2010.PDF
- MINNESOTA DEPARTMENT OF TRANSPORTATION (MDOT) “ROLES AND RESOURCE LOADING P6” (2013) HTTP://WWW.DOT.STATE.MN.US/PM/PDF/WEBINARS/WEBINAR-10-ROLE-RESOURCES.PDF
- MARCUS P. CONTRERAS & ANNE E. VAN DE WERKEN (2005) USING CPM SCHEDULING TO SUCCESSFULLY MANAGE & COMPLETE PROJECTS HTTP://WWW.EC-SPECIALISTS.COM/ARTICLE_FEB05.PDF
- RON WINTER (2006) “PROPER IMPLEMENTATION OF RESOURCE LEVELING” HTTP://WWW.RONWINTERCONSULTING.COM/IMPLEMENTING_RESOURCE_LEVELING.PDF
GPCCAR M06-6 - Managing Resource Acquisition / Allocation, Revision 1.01