Guild of Project Controls: Compendium | Roles | Assessment | Certifications | Membership

Tips on using this forum..

(1) Explain your problem, don't simply post "This isn't working". What were you doing when you faced the problem? What have you tried to resolve - did you look for a solution using "Search" ? Has it happened just once or several times?

(2) It's also good to get feedback when a solution is found, return to the original post to explain how it was resolved so that more people can also use the results.
S-Curve

31 replies [Last post]
Ponnaganti Sridhar
User offline. Last seen 7 years 42 weeks ago. Offline
Joined: 20 Jul 2004
Posts: 39
Hi! Fellow Planners,

i have a silly question, but which i came across in two organisations (in my previous project and my present new company) with planners of the respective companies.

How many S-curves does a Project Have?

according to my knowledge it is only one either the early start curve or the late start curve and the progress curve, combination ot E.S curve and T.S Cuve gives the S-curve envelope, is there any other S-curve Apart from this?

your Suggestions would be more appreciateable

Cheers!!
Sridhar

Replies

Rafael Davila
User offline. Last seen 1 day 17 hours ago. Offline
Joined: 1 Mar 2004
Posts: 5229

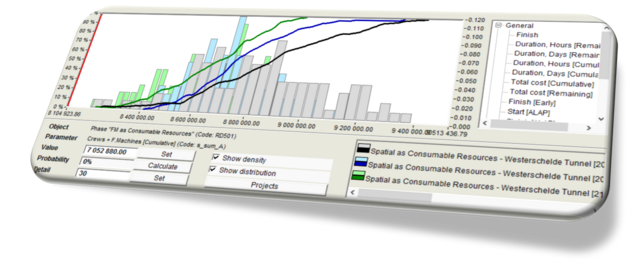
Time and Cost Probabilities of Success are another sets of S-Curves of interest.

Probabilities_of_Success

Wayne Busch
User offline. Last seen 3 years 11 weeks ago. Offline
Joined: 30 Apr 2018
Posts: 3
Groups: None

I use a prgram called Project Tracker you can import files from P6 or MSP and it pulls an S-Curve that can then be edited to suit your requirements.


Zoltan Palffy
User offline. Last seen 5 weeks 1 hour ago. Offline
Joined: 13 Jul 2009
Posts: 3089
Groups: None

no link there

Ali Osama
User offline. Last seen 4 years 2 weeks ago. Offline
Joined: 19 Dec 2017
Posts: 39
Groups: None

create s-curve easily using this template

https://bibloteka.com/s-curve-excel-template/

Nar Thap
User offline. Last seen 16 years 2 days ago. Offline
Joined: 12 Sep 2007
Posts: 73
Hi,
I am using suretrack planning software. I tried to make s-curve using view > resource profile > performance ( resource total). The cost curve extends beyound the data date line until project completion date. why is so? Earn value and BCWS curve are ok.
cheers
Ed Fish
User offline. Last seen 16 years 33 weeks ago. Offline
Joined: 17 Jun 2004
Posts: 21
Groups: None
Sorry, folks going to jump off at a tangent here.

As someone has already said a project has as many S-cruves as you want. The reason you end up with "one overall" S-curve is a function of statistics that says cumulative (probability) curves are additive (i.e. they tend to add together to make one big smooth S-curve, no matter how jagged or zig-zag they are individually).

Nice pretty S-curves only exist on big projects and my experience says small projects have very zig-zag S-curves, unless you want to micromanage.

No help to anyone that stuff but it was a good way to spend some time not thinking about the lack of planning and my current project.

A (dis)stressed PM
Oliver Melling
User offline. Last seen 4 years 31 weeks ago. Offline
Joined: 24 Apr 2007
Posts: 595
Groups: The GrapeVine
No offence taken anyway!
Richard Spedding
User offline. Last seen 5 years 26 weeks ago. Offline
Joined: 20 Mar 2007
Posts: 127
Oliver

Sorry - I don’t doubt that you know what you are doing. However I am aware that others with less experience read these posts and may be tempted to follow - just highlighting one or two of the pitfalls I have fallen into in the past so that others don’t need to have the experience!
Oliver Melling
User offline. Last seen 4 years 31 weeks ago. Offline
Joined: 24 Apr 2007
Posts: 595
Groups: The GrapeVine
I believe weighted milestones can be useful. As long as you are conservative when setting out the weightings.
Also, if there are many changes in the number of drawings, then it strengthens the need to set up a robust change control process in the very begining.
ulysses garcia
User offline. Last seen 13 years 13 weeks ago. Offline
Joined: 22 Aug 2005
Posts: 259
Groups: GPC Qatar
In the issue of drawings , I agree the difficulties in monitoring progress, however, in certain cases if you are involved or dealing to the contractors having ISO procedure in tracking drawing status, then this problem will all be sorted out.
Oliver Melling
User offline. Last seen 4 years 31 weeks ago. Offline
Joined: 24 Apr 2007
Posts: 595
Groups: The GrapeVine
Nieman,

True it can be a very sketchy method of measuring progress, but sometimes the situation demands it!
Richard Spedding
User offline. Last seen 5 years 26 weeks ago. Offline
Joined: 20 Mar 2007
Posts: 127
Oliver
Perfect sense.

I appreciate that - but design is such a difficult area to record progress.

If you are measuring it as numbers of drawings produced, there can be a tendency for designers to issue drawings which are uncoordinated and even unchecked, just to say it has been issued - a way around that is to ensure that you only record drawings which have A status, or possibly B status, as long as the comments are minimal. Another tendency is for the number of drawings required to grow from that agreed at the beginning of the design stage - needs watching.

If you only measure the design of the package as complete then you have a very coarse measure which will need careful monitoring before building it into a S curve.
Oliver Melling
User offline. Last seen 4 years 31 weeks ago. Offline
Joined: 24 Apr 2007
Posts: 595
Groups: The GrapeVine
Nieman,

As i think i mentioned earlier, s-curves can exist also for packages of work.

If you have the design of many components in a project, you may want to claim that a ’package’ of work is done only once a certain group of designs have been completed.

By creating your own s-curve in excel you can claim in packages by only including the bcwp of some designs once a certain group of designs are complete.

Hope i make sense.
Richard Spedding
User offline. Last seen 5 years 26 weeks ago. Offline
Joined: 20 Mar 2007
Posts: 127
Sorry - didn’t go back to the beginning!

As has been said elsewhere in the thread, there can be any number of S curves relating to particular resources - different companies have different ways of assessing progress on groups of activities.

Therefore you can have an S curve for Piling, Concrete placed, Formwork, falsework, reinforcement fixed, tonnage of steel erected or no. of pieces erected, number of curtain walling panels installed or sq.m. erected, area of roofing completed, no. of fancoils erected or piped up or tested etc. On roads that could be area of formation, length of drainage, volume of cut - fill, area of sub-base / basecourse / wearing course etc.

All these S curves give the PM a measure of progress and where the problems lie.

I do not know of another S curve, unless you have instituted earned value analysis and resourced the cash flow in/out onto the activities.
Ponnaganti Sridhar
User offline. Last seen 7 years 42 weeks ago. Offline
Joined: 20 Jul 2004
Posts: 39
Hi,
Niemas Nass & Damiel Limson,

a very thankyou for your predections , i would rather request you to please see my 1st posting regarding this thread and send a reply does u have any other over all progress S-curve apart from those, sorry if i am wrrong i am not an expert like you people, i am just like a drop of water in a big ocean

with regards
P.Sridhar
Daniel Limson
User offline. Last seen 4 years 40 weeks ago. Offline
Joined: 13 Oct 2001
Posts: 318
Groups: None
Possibly a baseline programm curve against the current progress curve or it can be Master programme against the Contractors Programme.

It would be easy to ask the one who did it. He and he alone can tell you what it is.

Cheers mate.
Daniel
Richard Spedding
User offline. Last seen 5 years 26 weeks ago. Offline
Joined: 20 Mar 2007
Posts: 127
If you have two S-curves, and they are related to planning, it is likely that one relates to all activities as soon as possible (ASAP), and the other with all activities as late as possible(ALAP).

These two curves give an envelope.The project progress should give a series of points which lie within the envelope. If they do, then by analysing which activities now lie on the Critical Path and concentrating on them, the end date is still achievable. If they lie below the envelope then the advice is that you cannot now meet the completion date without taking extraordinary measures to recover the time lost.
Ponnaganti Sridhar
User offline. Last seen 7 years 42 weeks ago. Offline
Joined: 20 Jul 2004
Posts: 39
Hi!
thanks to all of my fellow planner , for your valuable inputs.

these all things what you all mentioned are very nice means to get some brushing on the knowledge, most of the things whic were discussed are know to me a bit ( i am not an expert like you people, i just a bud , if spoke any thing wrrong wrong pls forgive me)

some were telling about resourse curves - which are plotted for a paricular resourse (having same unit of measurement) Vs time or cost of resourse to time ( i think it would be most appropriate if it resourse unit Vs its time.

some were talking about EPC packages
means Engineering package - monitoried my by its own S-Curve, Procurement package - by its Own S-Curve & Construction - Package by its own S-curve
this aslo know to, we had done before But entire project wll be tacked by the total Project S-Curve , it wll be more convinent and easy to identify very the pothole wether in Engineering or procurement or constuction

Ofcourse these all depends on the scale of project ( which drives the P.M’s intention to visulaise the Problematic area quickly.

Finally frineds, i am not able to get the answer which i was looking for,
i have seen two S-Curves here in One Project (over Project S-curves)... i am still not able to get it clarified that dought... that is the reason why i raised this question

ahaha

cheeerup my friends
P.Sridhar

Charleston-Joseph...
User offline. Last seen 2 years 39 weeks ago. Offline
Joined: 10 Jul 2005
Posts: 1347
Groups: None
Hello to All,

My preference is to have a lot of S-curve.

For EPC: Progress S-curve for Design development stage, Progress S-Curve for procurement stage, Progress S-Curve during construction Stage.

During Construction Stage: Progress S-Curve for earthworks, conrete works (can be detailed into formworks, re-bars, concrete or built-up conrete all inclusive)

S-Curve for finishing works: blockworks, plastering, tilings, woodwork, etc.

S-curve help track down productivity, progress status, HOW HEALTHY IS THE PROJECT.

Earned Value Management is also important.

This is what P3 for, to get micro control of project.

Cheers,

Joseph
Oliver Melling
User offline. Last seen 4 years 31 weeks ago. Offline
Joined: 24 Apr 2007
Posts: 595
Groups: The GrapeVine
Ulysses,

In a ’commercially’ sensitive world companies might not want to share their full costs via s-curves. Therefore by using hours and keeping rates secret, you can ensure sensitivity whilst providing a meaningful progress update.

HTH,

Oliver
ulysses garcia
User offline. Last seen 13 years 13 weeks ago. Offline
Joined: 22 Aug 2005
Posts: 259
Groups: GPC Qatar
Daniel,
Daniel wrote :However, some projects are very sensitive when it comes to cost and can be manage equally effective by monitoring production rates and resources.

In this case EVA can not and will not be effective tool in a very sensitive cost monitoring, keep in mind that engineering cost control has a big tolerance incomparable to accounting tool ..in this case use accounting tools .
Oliver Melling
User offline. Last seen 4 years 31 weeks ago. Offline
Joined: 24 Apr 2007
Posts: 595
Groups: The GrapeVine
Depending on the size of each work package, then an S-Curve can be done using ’Work package’ as the common denominator. I have done this on design projects in the aerospace sector.

Ponnaganti Sridhar,
The important thing is to know what you are showing in an s-curve, as there is no hard and fast rules for planning.
You should produce as many s-curves as the project manager asks for.
The only circumstance that warrants producing more is when you find it personally beneficial to help illustrate a problem to the PM or stakeholders.

Oliver
Daniel Limson
User offline. Last seen 4 years 40 weeks ago. Offline
Joined: 13 Oct 2001
Posts: 318
Groups: None
On a CM type of project, the scope is broken down into trade packages and may vary depending on how big the project is. On this type of set up, you need to monitor each work package, which will require a progress curve for each trade contract. The project we just completed involves more than 200 work packages and each one has its own progress curve, the unit of measure will vary depending on what work they are doing. i.e Cubic Meter for Structural Concrete, Structural Steel in Tonnage, facades in square meters, etc. EVA can be applied for each one, it is a combination of time, cost and resources. However, some projects are very sensitive when it comes to cost and can be manage equally effective by monitoring production rates and resources.
ulysses garcia
User offline. Last seen 13 years 13 weeks ago. Offline
Joined: 22 Aug 2005
Posts: 259
Groups: GPC Qatar
JAMES,

Absolutely agreed, EVA is used to define the common denomonitor.
James Griffiths
User offline. Last seen 15 years 16 weeks ago. Offline
Joined: 19 May 2006
Posts: 435
Groups: None
This is why Earned Value was invented. It reduces all these measurement units into a common denominator e.g. money or time. Of course, the biggest pig is trying to get people to understand this - actually do it - and then understand the resultant-curve behviour characteristics of the chosen methodology. People will insist on thinking that if you have laid 3/9 bricks, then you are 33.33333% complete (in EV terms). The answer could be either Yes or No.

I’m writing a guideline on the principles and applied methodologies of EV that almost literally spells-out precisely what happens when you use certain methods, calculating progress etc. [it actually graphs all the results, so that you can compare them]. The reason I’m doing this, is because in all the papers and books that I’ve read, none give a true understanding of the way these things work. The whole idea is to keep it very simple - thus I’m using a very, very basic example [the building of a 3x3 brick wall]. However, even this is showing some amazing variations of results, depending upon which methodology is being used. So, it’s no wonder that even an experienced PM or Planner might have some difficulty in comprehending why the overall summary results are as they are.

Ultimately, the principles are actually very simple. It’s the underlying ability to understand that you MUST convert everything to the common denominator, otherwise you are attempting to calculate a summary result, but using different units of measurement. It doesn’t matter what the unit of measurement is, as long as it is consistently being used. This usually boils-down to either time or money.

James.
ulysses garcia
User offline. Last seen 13 years 13 weeks ago. Offline
Joined: 22 Aug 2005
Posts: 259
Groups: GPC Qatar
If you like to control your work as neck to neck basis,

You may create your S curve in three dimensions; that is, a separate curve for ..Engineering , Procurements and Construction works.But, all of these should be loaded in either or both, cost/MH
Cheers ULY
A D
User offline. Last seen 3 years 24 weeks ago. Offline
Joined: 20 May 2007
Posts: 1027
Hi all,

Well, the basic question asked in the thread was, how many S-Curve does the project have?

Basically, it depends what are elements you need to monitor on the project works.

You can have S-Curves for resources or for costs. It can be also for a typical resource or may for a earned value calculation or a traditional way of costs claimed against cost baseline.

It can be also for procurement of pipes, or any other major items.

There is no point in making S-Curves for anything and everything, but for the things which are on the critical path or on near-critical path.

A time may come in the project, when u need to monitor particular resource-driven items, then the cost baseline.

Hope, it clears.

Cheers,
ulysses garcia
User offline. Last seen 13 years 13 weeks ago. Offline
Joined: 22 Aug 2005
Posts: 259
Groups: GPC Qatar
The defination of S curve is somehow broad, But in a simple sense you can make it more practical using EVA earn value analysis, by product of % physical to allocated cost in each task.
Cheers ULY
Anoon Iimos
User offline. Last seen 2 years 15 weeks ago. Offline
Joined: 22 Sep 2006
Posts: 1422
in P5, you can define it in Steps Weightings and you can input the Physical Percentage manually. I guess you might not get a perfect S-curve, maybe zig-zag curve or saw-curve! where’s the sense?!
Trevor Rabey
User offline. Last seen 1 year 22 weeks ago. Offline
Joined: 29 Nov 2005
Posts: 530
Groups: None
Ron,
I am never sure what is meant by "% Progress", especially when it appears on the vertical axis of a graph.
How can an "S curve" can be anything other than a cumulative "something" which can be counted?
That might be the bricks being laid or the concrete being poured, or cumulative cost (measured in dollars) or cumulative Work (measured in Hours) or cumulative Duration (measured in days).
Work, Cost and Duration are common to all Tasks but the progress of the individual Tasks can’t be summed because some are measured in bricks and others in m3, or whatever.

In a project with lots of Tasks each one will have its own set of S Curves.
An overall project S Curve for Cost or Work or Duration makes sense, but when we have x% of bricks for one Task and y% of concrete for another Task, is it meaningful to say that the combined "% Progress" is x + y, or even (x+y)/2?
40% of bricks and 50% of concrete doesn’t equal 90% overall progress.
Am I making sense here?
Ronald Winter
User offline. Last seen 3 years 7 weeks ago. Offline
Joined: 4 Jan 2003
Posts: 928
Groups: None
Besides tracking planned progress, there are cost curves and resource curves.