Seavus Project Viewer
Explore Seavus Project Viewer - The best Project Viewer to open and view MPP files with 100% accuracy
Maintaining accurate and accessible project information is essential for successful project management. For organizations that rely on Microsoft Project, finding a reliable tool to view MPP files can be challenging. This is where Seavus Project Viewer comes in. Renowned as the best project viewer for opening and viewing MPP files with 100% accuracy, Seavus Project Viewer ensures that the whole organization can access a single source of truth, regardless of their operating system. Below, we will explore the features and benefits of Seavus Project Viewer, highlighting how it can enhance collaboration, streamline project monitoring, and support efficient decision-making across your organization. Whether users are on macOS, Windows, or both, Seavus Project Viewer provides a seamless solution to meet their project viewing needs.
2/3 of the Fortune 500 utilize Seavus Project Viewer, which is a favored MS Project viewer among teams and project managers. It enhances project managers' team effectiveness and reduces the expenses spent on Microsoft Project licenses.

Align your organization for maximum utilization of MPP project data
Seavus Project Viewer is the only tool needed for 100% accurate MPP project data. It seamlessly scales and adapts to an expanding team and growing MS Project portfolio.
- Opens MPP files from the latest MS Project version
- Reduces costs for hardware and software
- Operating system flexibility - Suitable for companies that use macOS and Windows (combined or solely)
- Effortless distribution of data (email, chat, shared folder)
- Multilanguage availability
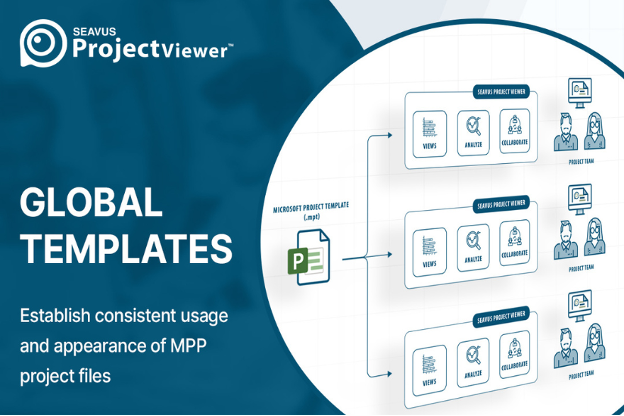
Global Templates
Across a team or an entire organization, global templates offer consistency in data viewing.
If you have any missing components, SPV supplements them with the relevant elements from the global template. With this, you can be sure that each project plan always includes, at a minimum, all the views and the associated features provided by the global template. The software preserves any modified views present in the .mpp file that were saved by the project manager in Microsoft Project.
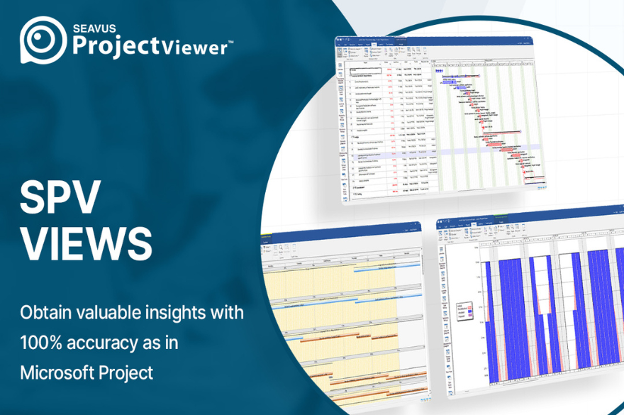
Views – Plan in Microsoft Project, View in Seavus Project Viewer
Seavus Project Viewer offers a suite of views designed to meet the diverse needs and roles within any organization. With the flexibility to display views individually or in combination, users can gain valuable insights into tasks, resources, and assignments. The split views feature allows for a detailed examination of tasks or resources, ensuring that all MPP information is displayed accurately and clearly within the viewer. Explore all of the views that Seavus Project Viewer has to offer in depth.
Appropriate for all organizational needs and roles:
- Get into project details, while overviewing the whole project scope
- Explore insight in tasks, resources, assignments
- Views can be displayed individually or combined
- Split views combinations – detailed view of tasks or resources
- MPP information is displayed in any corresponding view within Seavus Project Viewer
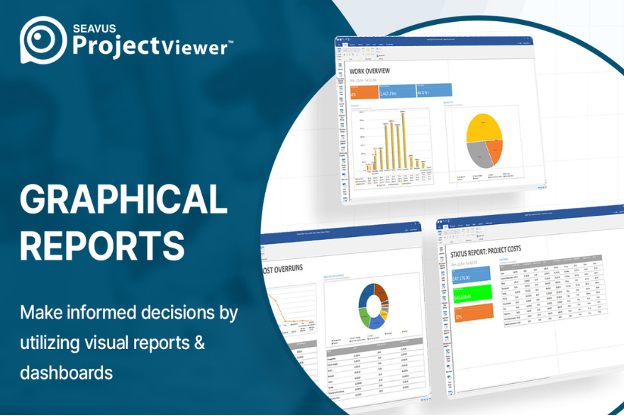
Graphical Reports in Seavus Project Viewer
Unlock powerful insights into tasks, resources, and assignments with Seavus Project Viewer's graphical reports. These visual reports offer a clear view of upcoming tasks, identify those falling behind schedule, and highlight critical tasks.
They provide project managers and project stakeholders with a comprehensive overview of task progress and resource costs, enabling better decision-making and highlighting areas for improvement.
The benefit of visual reports:
- Give insights on upcoming and tasks that are falling behind schedule as well as information on critical tasks
- Provide comprehensive overview of tasks and resource costs to team leads and project stakeholders
- Give overview of project progress and areas of improvement to project stakeholders
Seamless and efficient deployment across all entities within your organization
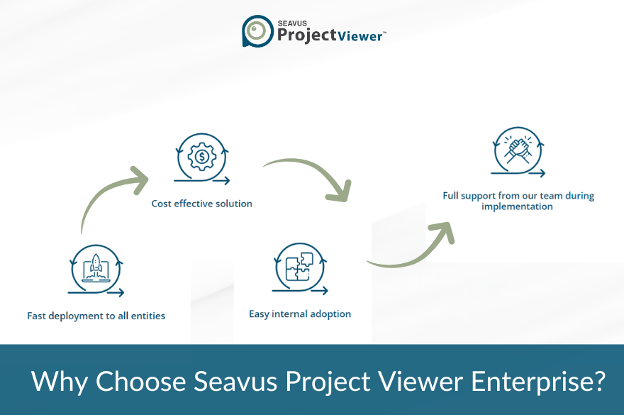
Choosing the Enterprise package from Seavus Project Viewer ensures a seamless and efficient deployment across all entities within your organization. With fast deployment capabilities, this package allows for quick integration, minimizing downtime and disruption to your operations. It is a cost-effective solution that delivers high value without requiring significant financial investment, making it ideal for organizations looking to optimize their project management processes while managing budgets.
The easy internal adoption process ensures that your team can quickly get up to speed with the tool, supported by a user-friendly interface that simplifies training and usage. Additionally, the SPV support team is available to assist throughout the implementation process, providing comprehensive assistance to ensure a smooth transition and ongoing success with Seavus Project Viewer.
With fast deployment for companies of all sizes and no need for additional investment in hardware or software, accessing your project information has never been easier. Featuring an intuitive interface and trusted by two-thirds of Fortune 500 companies, Seavus Project Viewer is designed to enhance your project management capabilities.
Request a Quote for Seavus Project Viewer Enterprise Offering.