Hello Everyone Can EArned Value be caluclated for Manhours and Then can we forecast the expected manhours to complete. I made a table to put those thing to get a forecasted manhours which is based on Productivity which is same as CPI. Please comment and let me know your ideas to make it better,
I have put an example by putting Project Managers to Claculate the Forecast at completion.
And please do let us know if there are other ways too.
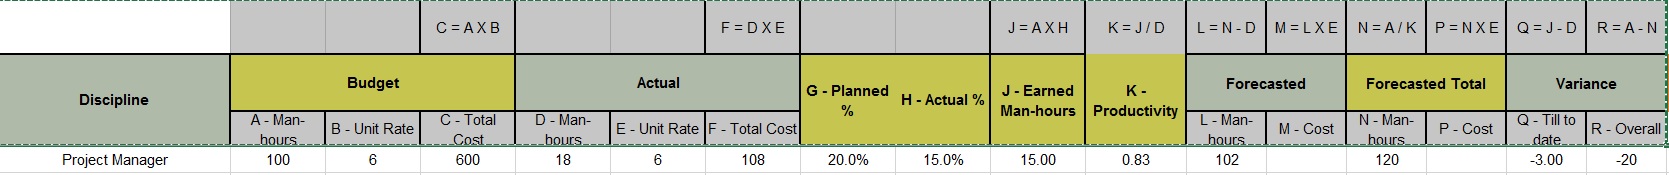
If the above one is not Clear as it is from Excel here is the cut and paste but without the shades below,
C = A X B F = D X E J = A X HK = J / DL = N - DM = L X EN = A / KP = N X EQ = J - DR = A - NDisciplineBudget Actual G - Planned % H - Actual %J - Earned Man-hoursK - ProductivityForecasted Forecasted Total Variance A - Man-hoursB - Unit Rate C - Total CostD - Man-hoursE - Unit Rate F - Total CostL - Man-hoursM - CostN - Man-hoursP - CostQ - Till to dateR - OverallProject Manager100660018610820.0%15.0%15.000.83102 120 -3.00-20
Regards
Jithin
So how would you Forecast the extra manhours for Engineering.
We know the " No of Deliverables in that Engineering" and How much manhours are allocated to do each deliverable.
One forecast can be done by asking each Dicipline Engineers- of how much more manhours are required to complete the remaining deliverable or Use the Productivity of Each Dicipline to calculate the Forecast.
Please dont think about Construction or Procurement.
About - If the Productivity was 1 = the Forecasted hours would be 50 Itself.
Deliveries are always related to some quantity, either measured as time or as a volume of work or as a lump-sum the whole measured as either 1 LS or 100%.
So I guess the formula which I use should be OK as it is not related to Quantity or Duration. AS you said some item which are not quantitative in construction can be measured by duration - like Curing.
But here the case is not related to Duration or Quantity. Here it is a Document (Deliuverable) - Example Foundation Detail, Load List etc...
I guess I can caluclate it by the Productivity of that Dicipline,
Say for MEchanical Dicipline for 5 deliverable the Budgeted hour was,
Budgeted Hours = 50
Actual No of deliverable Completed = 2
Actual Hours = 25
Planned Hours = 20
Productivity = 0.8
Forecasted Overall Hours =50 (Budgeted Hours) /0.8(Productivity) = 62.5 Hours
If the Productivity was 1 = the Forecasted hours would be 50 Itself.
Regards
Jithin
If an activity can be done in 40 hours using 5 resources A and I assign a volume of work of 100 % then the productivity would be 100%/[40hoursx4resource] = 100/[40x4] %/resource-hr = .625 %/resource-hr
For the average resource I would assign a productivity of .625 %/resource-h
For a lower production resource I would assign a productivity of .80x.625 = .500 %/resource-h, if a rookie then perhaps even a lower production rate shall be considered.
The following example can give you an idea of what I would do.
Of course this is a very simple scenario, more interesting is when you want some resources to produce a fixed amount of the volume of work, say in Activity 3 Resources A instead of 45.45 let it be 70.00 and Resources B the remaining 30.00.
The calculations are easier and dynamic if integral within the CPM. Also much needed transparency is provided in this way. Insane doing this using manual methods if similar to the prior shifts example, but with thousands of activities shifting in time as soon as there is some progress.
Whenever you want to change any parameter just change it and click the mouse, so easy.
Duration type activities do not have volume of work associated so % done is a % of elapsed time, an example of such activity in my industry is concrete curing.
For activities where there is some work related to it but cannot be easily measured in pure deterministic way maybe there is no better option than to assign an arbitrary volume of 100 and make an educated guess of % done. Even for these type of activities different resources have different production rates and somehow it shall be defined. Perhaps most Engineering activities fall in this category.
In my case perhaps 98% of Construction activities have a clear volume of work associated, while a 1% are pure duration type and a 1% are very difficult to measure. For such activities I use volume of work activity type, with an arbitrary value of 100 and volume of work unit %. This allows me to define resource/team/shifts production rates for such activities.
I am aware of how difficult it can be to measure activity progress on some jobs, Engineering, IT and Development jobs in particular. But still you have to deal with the issue on having different resources/teams/shifts with different productivity.
Thanks Rafael again.
Ya I do know about Construction but I was looking for Engineering. For one of the Project we are doing the engineering so inorder to forecast the engineering manhours should we use the Productivity ( the Multiplying Formula which I had put down) or check with each dicipline engineers of how much would they take to complete the remaining work.
So it is related to Engineering so there is no Volume or Work.
Thanks
Jithin
For Productivity type activities we use Volumes of Work, their duration is calculated during scheduling.
> Budgeted Cost of Work Performed (BCWP), or Earned Value is budgeted cost of actually performed activity works. BCWP is also the value of work performed expressed in terms of the approved budget assigned to that work for a schedule activity or work breakdown structure component. EV = Budget x %work done.
> Productivity or Production Rate = [volume of work] / [effort hours]; productivity or production rate is a parameter that can change as things happen different to as planned, predicted production rate can be different to current at different periods, can be different for different shifts and different teams working on the same activity. This can complicate the calculations for activity durations if your software does not relate production rate and volume of work to activity duration.
> For volume of work we use units everyone at the job-site understand and uses such as CM [cubic meters] of rock excavation, EA [each] bricks, SF [square foot] of tile installation. Earned Value is calclulated for similar units.
> Forecasted Man - hours = [actual man-hours] + [remaining volume of work] / [adjusted productivity]; in case of different shifts the calculations for activity duration can be very tricky.
I use Best of Breed approach, we collect data using our financial system, we use the CPM for forecasting purposes.
Hi Rafael,
Thanks I got your point but I was thinking of making something by doing a productivity analysis and putting it in excel to Forecast like by following up these values,
Wouldn't this give us a Forecast Man - hours.
Regards
Jithin
Hello Everyone Can Earned Value be calculated for Manhours.
and Then can we forecast the expected manhours to complete.