Guild of Project Controls: Compendium | Roles | Assessment | Certifications | Membership

Tips on using this forum..

(1) Explain your problem, don't simply post "This isn't working". What were you doing when you faced the problem? What have you tried to resolve - did you look for a solution using "Search" ? Has it happened just once or several times?

(2) It's also good to get feedback when a solution is found, return to the original post to explain how it was resolved so that more people can also use the results.

Graphical Representations of Gantt Charts and Linear Diagrams

6 replies [Last post]
Bogdan Leonte
User offline. Last seen 5 weeks 3 days ago. Offline
Joined: 18 Aug 2012
Posts: 284

My appologies for posting off topic.

I pasted the conversation regarding colors and paterns in this post in order to bring the subject "up to speed".

Bogdan's Initial post:

I saw in one of the Spider Team publications ("Tools and Techniques of Project and Portfolio Management with Resource Constraints") project phases using two colors, I was wondering if you know if this is possible in the program and how. I belive the "Use subphases colors to draw phases" option under "Gantt Options" may be the way to do it, but I haven't figured how to use it. Any suggestions?

Rafael:

I am not much into tweaking colors other than manually. If in addition to colors there were patterns I would get more interested as photocopies and print out from my B&W laser printer would make sense.

When I was a SureTrak user my favorite tweaking, and perhaps the only was to setup hammock bars to be light grey with diagonal lines. Something simple and always the same, more on the practical side.

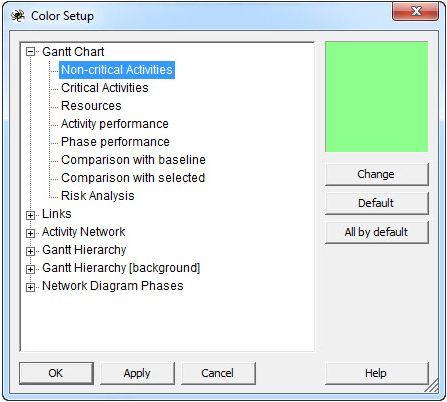
I would like the following option box to provide for tweaking color of activities by Type DPH and to provide pattern options in addition to color and would avoid use the other complicated methods, only manual color for a few activities I want to highlight.

1920
rafaels_color_snip.jpg

Bogdan:

Perhaps partterns could also be added to signals. This way the users could have even more flexibility.

Rafael:

You are right, even when for signals alone it does not makes much sense it does when used as to dynamically change bar colors, the tweaking I rarely use.

I miss being able to define colors/patterns by activity type, the most relevant for me would still be the Hammock.

Maybe with formulas and signals hammock color can be tweaked, but it is too complicated to even search for it.

Vladimir:

With formulas that set different numbers in user field that is made signal you may create different colors for different activity types but no patterns. Colors on the phase may reflect user defined colors of its sub-phases. But it makes sense to discuss this in the separate topic, it is not connected with MC analysis.
Replies

Bogdan Leonte
User offline. Last seen 5 weeks 3 days ago. Offline
Joined: 18 Aug 2012
Posts: 284

It didn't cross my mind to try directly with custom color option. It's exactly what I wanted. 

Thank you.

Bogdan,

in your example each portfolio project consists of investment phase and operating phase. For investment phases blue color was selected at the Gantt Chart as user defined color. Now when collapsed the phase of previous level (project) inherits colors of its subphases. So Gantt Chart shows when investment phases were finished at all projects of the portfolio.

For this you shall select "Use subphases colors to draw phases" in the Gantt Chart options. 

Regards,

Vladimir

Rafael Davila
User offline. Last seen 1 day 9 hours ago. Offline
Joined: 1 Mar 2004
Posts: 5229

It seems to work when you have sub-phases collapsed and have defined a user defined color for the sub-phases. Also looks like it will not inherit color of sub-phase if not a custom color. 

Suggest select each sub-phase and define different color for each sub-phase on a small sample job of your choosing.

 photo 1-13-201411-44-44AM_zps77b4bfdd.jpg

Bogdan Leonte
User offline. Last seen 5 weeks 3 days ago. Offline
Joined: 18 Aug 2012
Posts: 284

All I have written is not a request for new functionality. It all started when I was looking thorugh a publication regarding Portfolio Management with Spider, when I saw the following printscreen:

1922
portfolio_snapshot_from_publications.jpg

As you can see for the same phase there are two colors. I don't know if this is an edited picture or it is done directly in the program. All I want to know if this can be done within the program and what are the steps/setting to do it. I assumed it can be done since there is the option "Use subphase colors to draw phases".

I hope I was more clear this time.

Best Regards,

Bogdan

Rafael Davila
User offline. Last seen 1 day 9 hours ago. Offline
Joined: 1 Mar 2004
Posts: 5229

Bodgan, I suppose you want to see the overlaps and all descriptions/[selected label, preferably a short label], otherwise it does not makes sense to me. 

 photo 1-13-201410-07-48AM_zpsdb06a3a2.jpg

Convenient for housing projects and similar job types, in combination with multiple WBS and labels it would be great. As you can see row height auto-adjust depending on maximum number of bars that intersect, very clever.

Bogdan Leonte
User offline. Last seen 5 weeks 3 days ago. Offline
Joined: 18 Aug 2012
Posts: 284

Vladimir,

With formulas that set different numbers in user field that is made signal you may create different colors for different activity types but no patterns.

I am familiar with signals in user defined fields, what I don't know is if you can set up a phase to have two ore more colors depending on the number and color of it's subphases, and if so how do you set it up?

1921
phase_color__subphase_color_1.jpg