Guild of Project Controls: Compendium | Roles | Assessment | Certifications | Membership

Tips on using this forum..

(1) Explain your problem, don't simply post "This isn't working". What were you doing when you faced the problem? What have you tried to resolve - did you look for a solution using "Search" ? Has it happened just once or several times?

(2) It's also good to get feedback when a solution is found, return to the original post to explain how it was resolved so that more people can also use the results.

Resource lookahead

6 replies [Last post]
Codge 1992
User offline. Last seen 5 years 32 weeks ago. Offline
Joined: 9 Aug 2018
Posts: 3
Groups: None

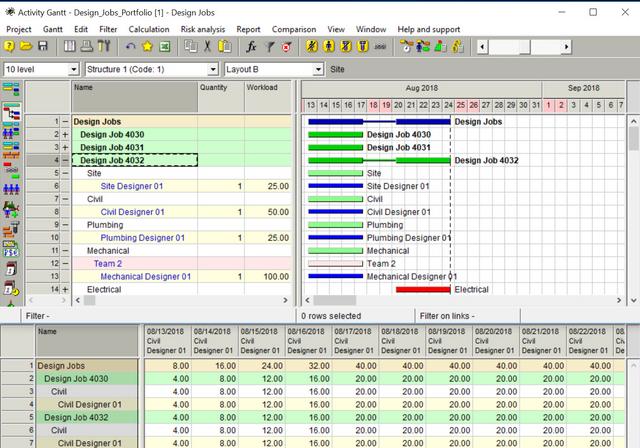
Hello.  I am a project manager for a design consultancy and we currently use P6 to manage out programmes, and then an excel sheet as a visual representation for lookahed purposes. My manager has requested that i investigate whether there is a better way of doing things rathetr than doubling ip on work and populating a s/s from multiple P6 printouts. 

Do you have any specific filters that you use / excel sheets that you populate that make P6 a bit more visual to look at for a lookahead point of view?

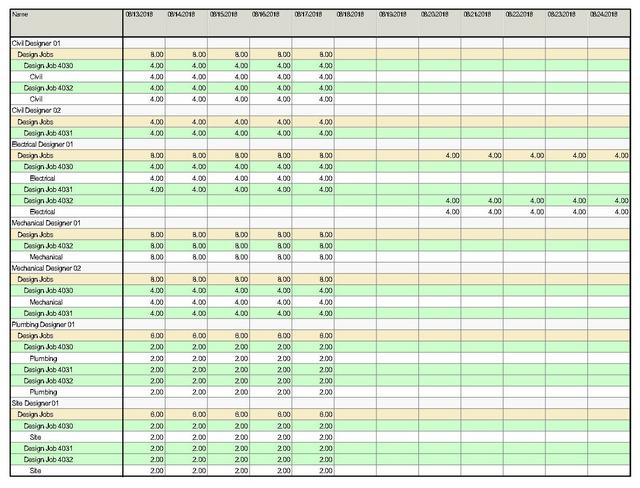
I currently have an excel ‘workload planner’ (below example) that has everyone on one excel sheet and their daily tasks (green for work, light green for checking, yellow for out of office work, red for annual leave).  I find that P6 is a little too much information overload and doesn’t often go into the nooks and cranny’s of daily tasks as it simply has a timescale that you know an activity is happening over.

I have made myself a lookahead filter but seems I can only do this by project and again I feel that I need more control over resources.

Replies

Zoltan Palffy
User offline. Last seen 4 weeks 1 day ago. Offline
Joined: 13 Jul 2009
Posts: 3089
Groups: None

view show on bottom activity usage spreadsheet or resouce usage spreadsheet

Raymund de Laza
User offline. Last seen 31 weeks 4 days ago. Offline
Joined: 23 Nov 2009
Posts: 762

"Essentially my manager does not want to read any programmes and just wants a brief excel version of what each engineer is doing on a daily basis.  I have allocated the correct number of hours per activity in my plan and update them on a scheduled timeframe, however I am siply looking for a simple visual way of showing the day and what activity is carried out that day."


Using the REsource usage pane, Organize the layout as follows:

1. Start .. Group Interval by Day

2. Task

3. Responsibility


Rafael Davila
User offline. Last seen 4 hours 39 min ago. Offline
Joined: 1 Mar 2004
Posts: 5229

In my prior posting I was showing cummulative hours for a single resource. But reports can be as per other requirements.  In the following image I show for all resources hours/day/job. Just save your reports definitions and get them at a single click of the mouse, cannot be any easier.

Resource_Assignments_Sample_Reportjpg_Page1

Rafael Davila
User offline. Last seen 4 hours 39 min ago. Offline
Joined: 1 Mar 2004
Posts: 5229
  • If you run multiple design jobs at the same time and they share designers you shall be using Enterprise Portfolio Management Software capable of resource leveling common resources among different jobs.
  • If your designers work on several jobs at the same time a few hours per day on each job you shall be using partial workloads assignments.
  • If you use several designers that must work together as a team and others that can work as a separate team you need to use team assignments.
  • The table reports shall give you the information you need.  If you do not know at any time at a click of the mouse where your resources are assigned you are lost.

Design_Jobs_Portfolio

Resource_Workloads

Teams_and_Shifts

Codge 1992
User offline. Last seen 5 years 32 weeks ago. Offline
Joined: 9 Aug 2018
Posts: 3
Groups: None

Zoltan,

Apologies I'm maybe finding it difficult to explain as I am relatively new to the world of P6 and planning.

Essentially my manager does not want to read any programmes and just wants a brief excel version of what each engineer is doing on a daily basis.  I have allocated the correct number of hours per activity in my plan and update them on a scheduled timeframe, however I am siply looking for a simple visual way of showing the day and what activity is carried out that day.

I currently use filters for 2-weeks, 4-weeks and 6-months but was just wondering if there was a better visualisation tool to show this.

Thanks for any help

Zoltan Palffy
User offline. Last seen 4 weeks 1 day ago. Offline
Joined: 13 Jul 2009
Posts: 3089
Groups: None

thsi statement contraticts itself

"I find that P6 is a little too much information overload and doesn’t often go into the nooks and cranny’s of daily tasks as it simply has a timescale that you know an activity is happening over."

"you could nto be more wrong to say that  it simply has a timescale that you know an activity is happening over"

you excel worksheet is NOT time sensitive noting in the world is except a cpm schedule. When you change 1 litle thing in excel you NEVER see how it effects other things.

I would like to point out that you can use chaneg the palnning units to hours and you can sechedule down to minute if you wish to. you can create as many nook and crannies that you like.

P6 is used for outage work that cost millions of dollars per day whee there is an outage. They schedule down to the hour or minute so I dobnt that your engineering schedule would need more nooks and crannies than an outage schedule.

I suggest creating the enginerring activites and assign resource to them with the appropriate manhopurs per activity and tack it that way.