Guild of Project Controls: Compendium | Roles | Assessment | Certifications | Membership

Tips on using this forum..

(1) Explain your problem, don't simply post "This isn't working". What were you doing when you faced the problem? What have you tried to resolve - did you look for a solution using "Search" ? Has it happened just once or several times?

(2) It's also good to get feedback when a solution is found, return to the original post to explain how it was resolved so that more people can also use the results.
Covid-19 Production assessments

7 replies [Last post]
Dougal Watson
User offline. Last seen 3 years 47 weeks ago. Offline
Joined: 5 May 2020
Posts: 4
Groups: None
Is there a quick process of applying a reduced productivity to remaining activities on a programme to assess the impact of Covid-19? This is as a result of a reduced permitted workforce on site e.g. 66% efficiency v planned. Can this be done in a new calendar for example? I have been manually calculating and adjusting bars but is there an easier way. Thanks.

Replies

Dougal Watson
User offline. Last seen 3 years 47 weeks ago. Offline
Joined: 5 May 2020
Posts: 4
Groups: None
Thanks very much everyone for your assistance.
Rafael Davila
User offline. Last seen 17 hours 20 min ago. Offline
Joined: 1 Mar 2004
Posts: 5229

Please click the following link to download presentation pdf.

Link to Quantities_Workloads_and_Production_Rates.pdf/file

Best Regard,

Rafael Davila

Mojahid Kilani
User offline. Last seen 3 years 18 weeks ago. Offline
Joined: 25 Jul 2018
Posts: 7

Hi Dougal, 


There is a simple method you can use it if the program is robust along with resources and cost have uploaded.


If your program has been built on P6 software, you can select the in progress activities and put the required dates on the suspended dates and resume dates, having this done to all the required activities; this will not only shows it on the bar chart but it will be reflected on the resources and cost numbers. 


Hope this will help you


Kind Regards, 

Mojahid


Ben Taunt
User offline. Last seen 20 weeks 5 days ago. Offline
Joined: 16 Jan 2012
Posts: 113
Groups: None

Hi Dougal,

My colleague Richard Ormerod, founder of Powerproject, has developed a series of webinars on these topics.  You can watch back the first in the series here: https://www.elecosoft.com/demonstrating-productivity-reduction-and-pauses-in-construction-planning/

He's running another session on Friday on issues and techniques within Powerproject regarding re-starting construction projects after lock-down.  Sign up is here: https://www.elecosoft.com/webinars/

Hope these help,

Ben @ Powerproject

Rafael Davila
User offline. Last seen 17 hours 20 min ago. Offline
Joined: 1 Mar 2004
Posts: 5229

I suggest modeling activities affected by covid-19 using different shifts/month each with their adjusted productivity and resource quantity.

  • You will get adjusted activity durations as per shifts/month production rates as activities are delayed.
  • Resource quantity and productivity assumptions will be transparent and easy to adjust. As activities start to open-up more resources can be added.
  • You will get true resource reports.

Otherwise adjust manually activities duration a time consuming and error prone procedure.  As production type activities durations are increased according to productivities other activities will be further delayed into different months with different productivities.

I see no shortcuts.

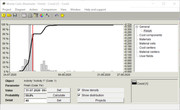
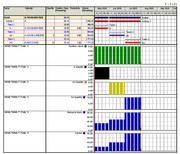
Activity-Gantt-Covid-1-Covid

click image above and zoom.

You shall also be able to perform Monte Carlo that will adjust all iterations based on probabilistic values of productivity.  Covid brings much uncertainty.

MCP01

MCP02

Good Luck
 

Playing with the calendars we may get wrong reports on resource requiremenrs in our project.