Guild of Project Controls: Compendium | Roles | Assessment | Certifications | Membership

Tips on using this forum..

(1) Explain your problem, don't simply post "This isn't working". What were you doing when you faced the problem? What have you tried to resolve - did you look for a solution using "Search" ? Has it happened just once or several times?

(2) It's also good to get feedback when a solution is found, return to the original post to explain how it was resolved so that more people can also use the results.
Resource overload report

8 replies [Last post]
Evgeny Z.
User offline. Last seen 39 weeks 6 days ago. Offline
Joined: 13 Jan 2008
Posts: 442
Groups: None

Dear all,

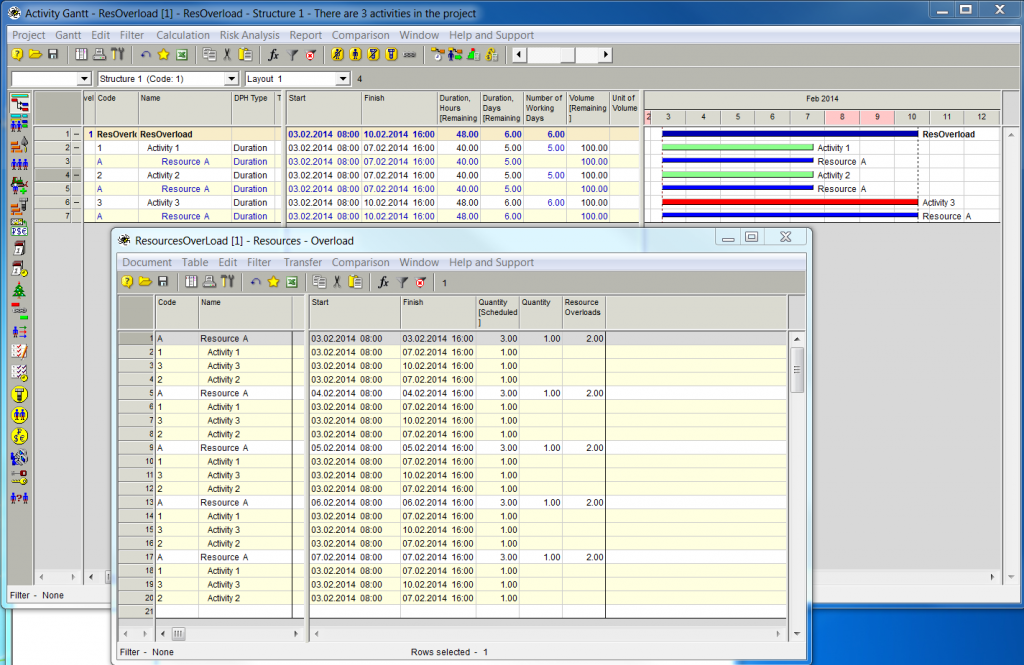
if I look at the resource overload report, then it produces new set of entries for every working day of a resource.

Is there any way to tweak Spider to create only one entry for a the whole period, when resource overload is caused by the same factors?

In my case I would like to receive only one entry from 03.02.14 - 07.02.14


 photo ResourceOverloads_zpsf8e29a8c.png

Replies

Evgeny Z.
User offline. Last seen 39 weeks 6 days ago. Offline
Joined: 13 Jan 2008
Posts: 442
Groups: None

Rafael,

Thanks, I have downloaded the file and looked at it.

But agree, that searching at the negative value of quantity of all of the available resources is not the same as getting report about just overloaded resources.  These are slightly different reports.

So, may be we can ask Vladimir to consider to have an option to consolidate records in the resource overloads report in such a way, that if a group of resource overloads are caused by the same reason (same rresource, same resource availability, same activities, then these records would  be shown as one record, rather than many).

Regards.

Evgeny

Rafael Davila
User offline. Last seen 2 hours 25 min ago. Offline
Joined: 1 Mar 2004
Posts: 5229

the media fire link, which you have posted does not work, can you re-post it please?

  • please try and let me know: http://www.mediafire.com/download/0izs5v17sltr3d1/RD008.002.sprj
  • If it does not work I can send it directly to you, just contact me via PP e-mail. I always like to make my files available to anyone for their convenience and constructive comments.

Totally separate question: how do you use spider in the environment, when everybody around doesn't? You must be doing a lot of explanation in order to make sure, that your stakeholders agree to use Spider?

  • I do not do any explanation it is either they use Spider or find another scheduler, very frequently they come back for help. I still provide other services such as quantity take off for their bids, something a contractor does not outsource unless they know you well, they can accept a Fly-by-night scheduler to meet the specs and use either MSP or SureTrak by their own if they do not want to spend more money into something I believe should be done in-house, none use P6 in house. Of course I do not have any objection to the use of a full time in-house scheduler provided by reputable firms in such case I favor they use whatever they choose. 
  • To me Spider represents intellectual excellence for resource planning, it is a matter of professional choice to use best of breed. 
Evgeny Z.
User offline. Last seen 39 weeks 6 days ago. Offline
Joined: 13 Jan 2008
Posts: 442
Groups: None

Rafael,

the medialfire link, which you have posted does not work, can you reposte it please?

Totally separate question: how do you use spider in the environment, when everybody around doesn't? You must be doing a lot of explaination in order to make sure, that your stakeholders agree to use Spider?

P.S.

By the way, I have submitted a Spider Project wikipedia article for approval. Once it is approved, I am planning to invite everybody, and definitely yourself to contribute to it.

https://en.wikipedia.org/wiki/Wikipedia_talk:Articles_for_creation/Spider_Project_(software) 

Rafael Davila
User offline. Last seen 2 hours 25 min ago. Offline
Joined: 1 Mar 2004
Posts: 5229
  • Which over allocation-related reports do you personally look at, when working with Spider?
    • I frequently use standard reports and templates. At times create my own reports.
    • The following figure shows how you can see overloads summarized per week.
    •  photo 1-31-20142-03-50PM_zpsa704ad75.jpg
    • A negative free value means an overload happened.
    • There are ways to create tabular templates from diagrams but frequently must be modified. At times I do it by trial and error.
    • I posted the file so you can download it, do not pay attention to the title it was an existing file I modified and no longer uses variable assignments. Try changing resource quantities and look how free quantity changes. I suppose the free quantity displayed amount is the minimum experienced within the week period under this specific diagram report. In case of overload the minimum available is the negative value with maximum absolute value.
  • Does it make sense to ask Vladimir to implement option for resource over loads report to show only one entry for the whole period, when over allocation is caused by the same conditions (the same activities, the same resource availability?)  
    • I do not see the need, maybe it is a complicated issue as continuity of overload can be dependent on shifts, calendars and the user must define it somehow... Here it is Vladimir who can give us some light.
    • About the report generator I do not need any more, it is way too much over what I could ever do within other software.
Evgeny Z.
User offline. Last seen 39 weeks 6 days ago. Offline
Joined: 13 Jan 2008
Posts: 442
Groups: None

 Rafael,

thanks. But the question is still:

  • Which over allocation-related reports do you personally look at, when working with Spider?
  • Does it make sense to ask Vladimir to implement option for resource over loads report to show only one entry for the whole period, when over allocation is caused by the same conditions (the same activities, the same resource availability?)   

So in my case I think it would be much more informative to receive the following table

Resource A03.02.14 08:0007.02.14 16:00
Activity 103.02.14 08:0007.02.14 16:00
Activity 303.02.14 08:0010.02.14 08:00
Activity 203.02.14 08:0007.02.14 16:00


Regards.

Evgeny

Rafael Davila
User offline. Last seen 2 hours 25 min ago. Offline
Joined: 1 Mar 2004
Posts: 5229

Evgeny,

Managing resources is not always as simple as clicking the mouse or as if a cooking recipe, you might still have to execute some control as to improve what the resource leveling algorithm determined, it is limited by constraints you might release, it is of much value but some decisions must be made by the manager not the computer. Therefore at times I compare unleveled schedule to leveled schedule and look for over-allocations, here another field of much help is delay reason.

Managing of resources is better done by an in-house planner and his team, those that know better the schedule and to whom activities have real meaning rather than abstracts. Using optimization algorithm on every update can change activities sequence more than needed, stability of the activities sequencing is something you got to manage. 

By the way, this is how I would like all my jobs be managed but local practice is poor, perhaps due to prevalence of poor resource planning software. Many do not realize how big a difference the tool can make; like running on foot against a Lamborghini, but they do not know the existence of the modern car, they still move on bare foot. 

Best regards,

Rafael

Evgeny Z.
User offline. Last seen 39 weeks 6 days ago. Offline
Joined: 13 Jan 2008
Posts: 442
Groups: None

Rafael,

thanks.

  • How do you deal in practice with over-allocations? 
  • Do you look at these reports?

One can say, that there is not much use in them, since Spider would take care to make sure, that there are no overallocations.

In Microsoft project one can look at resource usage report and there it provides quite a good view on which resources are overallocated (but MSP is not good in automatically resolving these overallocations)


Regards.

Evgeny

Rafael Davila
User offline. Last seen 2 hours 25 min ago. Offline
Joined: 1 Mar 2004
Posts: 5229

It looks like the report is designed to identify continuous ranges, can be hours, minutes or days. Therefore if you define the resource to work non continuous hours instead of 24/7 the interruption will be shown at least once every day.

The following figure shows what happens when using 24/7 calendars and true continuous over-allocations, but I do not think you want to do that.

 photo 1-30-20144-33-01PM_zpsfdae02fd.jpg

The report is great for finding over-allocations that are less than one day but for larger it might be easier at looking at the diagrams rather than at the table. To find over-allocations as small as 1 hr on the diagrams require expanding the timescale to hours and scrolling a long way, not a good idea. Over-allocations do matter, no matter how small, as it means the schedule is not feasible as long as there is a single over-allocation.

Imagine expanding following figure to display hours and then scrolling to visually find small over-allocations.  For each resource doing the same hundreds of times.

 photo 1-31-20146-02-58AM_zpse21f5dbd.jpg