Guild of Project Controls: Compendium | Roles | Assessment | Certifications | Membership

Tips on using this forum..

(1) Explain your problem, don't simply post "This isn't working". What were you doing when you faced the problem? What have you tried to resolve - did you look for a solution using "Search" ? Has it happened just once or several times?

(2) It's also good to get feedback when a solution is found, return to the original post to explain how it was resolved so that more people can also use the results.

Float not reflecting progress updates accurately.

10 replies [Last post]
Jacoby Kellogg
User offline. Last seen 4 years 45 weeks ago. Offline
Joined: 13 May 2019
Posts: 6
Groups: None

I've recently been charged with revising and maintaining a relatively substantial schedule (700+ tasks) for a client of the company I work for. This is the first time I've delved into scheduling, and it's definitiely trial by fire here, so please bare with me.

Exposition now complete, I'll get to the point: I've got the project baselined and approved by the GC and all of the progress inputed and up to date; now when comparing the baseline dates for upcoming tasks with the current projected dates, it is readily apparent that we are about a week and a half ahead of schedule (knock on wood). However, this is not depicted in my total float column as a gain, which provides some difficulty when trying to visually communicate this to the GC.

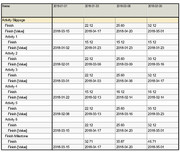
Using "Task A" as an example, it had a 2d duration, to be completed on 5/23 w/ 0 days of float. "Task A" is now scheduled to begin on 5/14 and is showing 1d of float. It may just be inexperience speaking, but when I edit the column properties to reference my baseline data, should the float not represent the difference in the scheduled end dates? If not, is there a different way that I can track these changes?


Would greatly appreciate any help/advice from any of the scheduling studs I've come across on this site. Thanks!

- J


P.S. Using latest version of Asta PP.

Replies

Rafael Davila
User offline. Last seen 22 hours 11 min ago. Offline
Joined: 1 Mar 2004
Posts: 5228

This value (Finish Variance + Float) masks Float values of Baseline tasks as well as Float values of Current Schedule tasks as the sum of two different parameters.  Take a look at the following table for a sample of several scenarios that will yield same value of 4 days. For the same value of 4 days there are 7 different Ahead/Behind values.  

You can populate the schedule with hundreds/thousands of such values, but what is means, how it is to be used? How this value is to be interpreted with regard of being ahead/behind schedule, or as a gain?

FINISH-VARIANCE-FLOAT-2

Now that we know Asta can display negative float, why not make use of this functionality? 

This is a common approach that is specified in many CPM specifications to make float an indicator of being ahead or behind schedule?  If there is positive float the schedule is on time, if there is negative float the schedule is not on time.  There is ample literature on this well established approach, the concept is "understood" by most schedulers, no need to re-invent the wheel. 

When reporting variance instead of reporting the variance of current vs baseline we find it convenient to report variance trends for contract milestones.  They are interested in looking at how fast schedule is being delayed or shortened.  This we report on Charts top management like as they do not have time to scroll hundreds or thousands of activities.

Variance-Trends-234r

Tabular reports with thousands of lines for large schedules showing trend variance for each activity can be issued.  This I find too much and unnecessary.

Variance-Trends-Tabular-Report-234rjpg-Page1

These are among some of the most common reports used to disclose how the schedule is performing. 

To compare schedule performance against some baseline values:

  • I avoid making use of Negative Float. Among other issues Negative Float by most software can distort Late S-Curve, an issue not addressed by many who insist on such implementation of negative float as if not mentioning the issue will make it disappear. When your software allows date constraints to make late dates earlier than early dates weird things might happen such as portions of late curve under early curve and other portions of late curves above early curve. 
  • SCurve-and-Negative-Float Twisted-Banana-Curve
  • I avoid making use of variance reports on float, I find it more of a distraction.  I pay attention to current schedule float.
  • I prefer to make use of values history as well as variance trends on contractual milestones finish date.
  • As things happen the probabilities of meeting schedule targets change, therefore for some schedules we report success probability trends for milestones finish and target costs.               
  •  SPT001
Jacoby Kellogg
User offline. Last seen 4 years 45 weeks ago. Offline
Joined: 13 May 2019
Posts: 6
Groups: None

Update: followed Ben's instructions and we got the numbers we were looking for, definitely jotting down notes on this for future reference.

Thanks again Ben and Rafael for the feedback.

Jacoby Kellogg
User offline. Last seen 4 years 45 weeks ago. Offline
Joined: 13 May 2019
Posts: 6
Groups: None

Ben,

That is EXACTLY what I was looking for, as I mentioned in the post, this is my first go around with scheduling so I apologize for misuse of terminology and lack of familiarity with the software. But kudos to you for being able to decipher what in actuality I was asking for and providing me with the answer to my problem.

As for the elecosoft support team, I did send out an email yesterday, though you beat them to a reply.

Thanks again for the knowledge and solution, I greatly appreciate it.

- J

Ben Taunt
User offline. Last seen 16 weeks 6 days ago. Offline
Joined: 16 Jan 2012
Posts: 113
Groups: None

Hi Jacoby,

Let me cycle back around to your original question...

Sounds to me like you want to show in a column the time that you are ahead of schedule (compared against baseline) PLUS the value of the float on the tasks in question.  If I'm right, this is the sum of two different factors:

- Variance against baseline

- Total float on the task.

We define float as "the period by which a task can be delayed without affecting other tasks or the project finish date."  For reference, we also do handle and display negative float ("the amount of time that must be saved to prevent other tasks from being delayed").  The float we display is against the current programmed dates, based on the current critical path.  It does not take into account any additional gains made eariler in the programme that has now pushed you ahead of schedule.

Instead, the fields of data that relate to the difference between live and baseline information are our "variance" tokens.  In your case, the time gained is likely best represented through your finish variance, which will show you how many days early you are now forecasting to finish the task, compared to the baseline.

You can display both finish variance and float as two seperate columns, but to display the combined answer, you will need to use the formula engine in Asta Powerproject to combine the values.  The resultant formula is probably something like: 

"Task.FinishVariance(CB)+Task.TotalFloat"

Is that closer to what you want to display?

By the way, if you have a support contract on your license, do put questions like this straight into our support teams; either your local Elecosoft partner or directly to us via support@elecosoft.com, depending on where you are based.

Thanks,

Ben


Ben @ Powerproject

Rafael Davila
User offline. Last seen 22 hours 11 min ago. Offline
Joined: 1 Mar 2004
Posts: 5228

As I said before I do not like to display negative float but instead we pay attention to the FNL Constraint Markers, in my software a yellow triangle.  This gives us a visual warning.  If you want to quantify the date difference between current schedule finish date and FNL Constraint a simple formula should do it.

FNL-Days-ahead-behind

I do not like to add unnecessary milestones as milestones require updating a common source of errors as these tend to be forgotten, not updated or updated wrong.

So simple, no need to complicate things and divert attention to hundreds/thousands values, one per activity instead of one per activity with FNL Constraint.

By the way, it is possible Asta does not display negative float. 

Jacoby Kellogg
User offline. Last seen 4 years 45 weeks ago. Offline
Joined: 13 May 2019
Posts: 6
Groups: None

Thanks again Rafael, that's a lot of useful information. I'll definitely be reading through that link you sent me tonight, if only just for my own edification.

Luckily in this instance I'm not concerned with negative float as we're ahead of schedule. More concerned with why the software isn't referencing the baseline and displaying the cumulative float from the current progress and total time gained. I'm definitely going to work with milestones as you suggested to see if that is a viable fix within Asta. I'll post if I find my solution.

Thanks again.

Rafael Davila
User offline. Last seen 22 hours 11 min ago. Offline
Joined: 1 Mar 2004
Posts: 5228

AACE® International Recommended Practice No. 29R-03

AACE® International Recommended Practice 29R-03 Forensic Schedule Analysis

Page 107/135

2. Least Float vs. Negative Float

The use of Negative Float or Longest Path Theory (Subsection 4.3.A.2.) for identification of critical activities can have a profound effect on the calculation of concurrent delay. The disparity stems from divergent approaches to criticality. Virtually all forensic delay methodologies provide for extensions of contract time on the critical path only. Therefore, the definition of the critical path is of utmost importance.

The Negative Float Theory assumes criticality on any activity that has negative total float relative to a contractual milestone. There is a certain practicality to this approach since most parties working from a CPM schedule will generally move to advance any activities that have negative total float because they are all essential to the maintenance or recovery of project delay. The Longest Path Theory provides for criticality on the longest path only, even if other secondary paths are late with regard to a contractual milestone. Under the Longest Path Theory, all paths shorter than the longest path (even those with negative total float) have positive total float with respect to the longest path and are therefore not critical. In contrast, under the Negative Float Theory, any delays, occasioned by negative total float, occurring during the same measurement period are
potential candidates for concurrency.

Concurrency analyses should always be consistent with the contract‟s definition of criticality. While it is beyond the scope of this document to catalogue the variations in contractual specifications, one relatively common definition is worth mentioning. Namely, some contracts include in the definition of concurrent delay that it cause a critical path delay. The requirement that the concurrent delay be critical, in effect, excludes other delay events with float values greater than the critical path from being evaluated for offsets against compensable delays. This view comports with the Literal Theory. It can be argued that absent such contract definition, non-critical delays can be used to offset compensable delay on a day-for-day basis after the expenditure of relative float against the critical path. This view comports with the Functional Theory.

...

Rafael Davila
User offline. Last seen 22 hours 11 min ago. Offline
Joined: 1 Mar 2004
Posts: 5228

By setting contractual milestone(s) you can get a view of float as it relates to a baseline milestone fixed if using date constraints.

Negative Float is the result of a backward calculation algorithm; it cannot be calculated if using simple comparison with the baseline.

Ahead of schedule - no negative float shown:

Negative-Float

Behind schedule - some negative float shown:

Negative-Float-02

The software I use keep separate values of total float for float calculated without enforcing unfeasible constraint dates and for float they call "Negative Float" for float calculated if enforcing date constraints no matter if unfeasible.   

How will depend on your software, Asta users should be able to provide the help if necessary. 

I do not use Negative Float as it can be misunderstood; some contracts define all activities with negative float as critical while in other contracts only activities with the lowest value are considered critical, others do not mention what negative float means. Asking to display negative float without defining what it means can backfire as contractor will addopt the definition that will favor his claims if not defined. 

Anyway if need be using my software of choice I can display negative float. 

Try searching the web for information on negative float.

Jacoby Kellogg
User offline. Last seen 4 years 45 weeks ago. Offline
Joined: 13 May 2019
Posts: 6
Groups: None

Thank you for the reply Rafael, I'll definitely consider the early/late comparison as a potential solution.

Also, I do understand that as progress is entered, the critical path, and therefore the float as it pertains to the current schedule, are likely to change; my issue is that the GC & Owner are requesting the float as it relates to the baseline, which is essentially the float in the updated schedule + the overall amount of time we're ahead of schedule. I haven't found a way to display this in Asta so far, though it seems like it should be a pretty simple fix.

Rafael Davila
User offline. Last seen 22 hours 11 min ago. Offline
Joined: 1 Mar 2004
Posts: 5228

Activity Float and Critical path is not static and subject to change.  The group of critical activities in revised schedule can be different, even if the critical activities remain the same the revised schedule can be ahead or behind schedule.  Of most concern are those activities in current critical path.

The classical way to compare current schedule to baseline is to display Baseline Early and Late Bars along with Current Update Early and Late Bars.  In addition to the bars you can show Baseline and Current Schedule Finish dates side to side plus the difference in finish dates.

Show-Ahead-of-Schedule-10