Predicting project completion
Working out the probable completion date for a project and understanding the risks associated with achieving a target date have always been difficult. This article will take a quick look at the evolution of the techniques through to the current state of research reported at the Project Governance and Controls Symposium earlier this month.
Bar charts have been around for some 200 years and are still the most popular form of time management tool (see more on the ‘Origins of Bar Charting’ http://www.mosaicprojects.com.au/PDF_Papers/P182_The_origins_of_bar_charting.pdf). Whilst easy to use and pictorial all a standard bar chart can show is how far ahead or behind time work is on each individual activity. The aggregate effect on the overall completion of the project cannot be inferred or calculated. Dynamic scheduling requires a network.
CPM (Critical Path Method) networks were developed in the late 1950s and popularised in the 1960s initially as ‘Activity-on-Arrow’ networks then Precedence Diagramming (PDM) networks became standard. The fact missed by most people is a CPM schedule is not designed to predict the expected project completion. CPM was designed to optimise the sequence of work and the utilisation of resources, whilst the effect of progress to date can be cascaded through to affect the projected completion there is no attempt to assess the effect of current productivity and estimating variability on future work (for more on this see ‘Why CPM is Wildly Optimistic’ http://www.mosaicprojects.com.au/PDF_Papers/P117_Why_Critical_Path_Scheduling_is_Wildly_Optimistic.pdf).
PERT was developed contemporaneously with CPM and was the first technique focused on predicting the probability of achieving project milestone dates and the overall project completion date. PERT uses a range estimate for each duration and typically produces projected completion dates 10% to 15% later than the equivalent CPM schedule. However, as with CPM, PERT does not adjust future durations based on performance to date and has several significant computational errors (see more on PERT Merge Bias http://www.mosaicprojects.com.au/WhitePapers/WP1087_PERT.pdf).
The best predictive tool based on a static representation of the project is Monte Carlo simulation. Monte Carlo eliminates the consequences of PERT Merge Bias and calculates a realistic probability of completion based on the data entered into the model. Monte Carlo adds another 10% to 15% to the duration calculated by a PERT analysis and generates a realistic range of outcomes for a project. However, whilst the predicted completion date from Monte Carlo is likely to be the most accurate assessment, it still suffers from the limitation in all of the other options discussed thus far, the estimates used in the calculation do not automatically change based on actual performance – certainly another ‘snap-shot’ can be calculated at a future date but the basis of the calculation is still empirical data created by the planner at that point in time.
Critical Chain suffers the same limitations – it can plot the burn down of the buffers in a schedule and predict an emerging problem but cannot calculate the likely effect on project completion.
The challenge of predicting cost outcomes was solved with the introduction of Earned Value (EV). The EV system offers a range of options for calculating an Independent Estimate At Completion (IEAC) that increase in reliability from around the 10% to 20% stage of a project through to completion. Most practitioners look at two or three options for calculating the IEAC and use the most pessimistic. In recent time the ‘90% stability rule’ has been shown to be unreliable (particularly on smaller projects) but the IEAC is still the most accurate projection of final cost, responding to changes in project management actions and strategy.
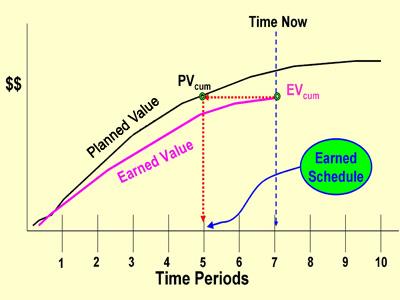
Traditional EV could not predict the completion date for the project in the same way as it predicts the cost EAC for two reasons, firstly the amount of money scheduled to be spent varies in each time period and secondly the SPI always reverts to 1 at the completion of the project. These limitations are well recognised and no attempt is made to predict completion dates based on traditional EV cost data. SV and SPI are calculated but not used in time based calculations.
A decade ago, this limitation in EV was resolved by Walt Lipke through the introduction of Earned Schedule (ES). ES has been shown to predict the completion date for schedules with the same level of accuracy EV predicts cost outcomes and has the advantage of requiring no additional data to be collected (see more on Earned Schedule http://www.earnedschedule.com/).

The work of the last few years, and the focus of this article, has been on improving these ES predictions!
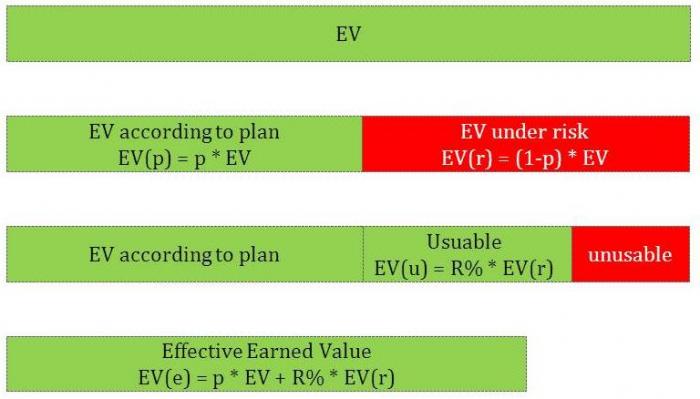
The key to accuracy lays in the understanding the degree of ‘schedule adherence’, called the ‘P-Value’. When P =1 there is perfect schedule adherence, less than 1 there is work being done out of sequence.

The initial use of the ‘P-Value’ was to discount the ES by the full amount of the out of sequence work. This appears to be too pessimistic and the current practice is to use the ‘Effective Earned Value’ (EVe) as the baseline for the ES calculations.

Ongoing research at Ghent University (Belgium) is focused on confirming the value of EVe as a definitive predictor of project completion (see more on the Ghent research http://mosaicprojects.wordpress.com/2014/05/07/pgcs-2014-update-ive-been-proved-wrong/).
A valuable adjunct to this research that is likely to be supported by DMO is in the use of the P-Value as an effective lead indicator of emerging problems in a project. The cause of the lack of schedule adherence may be a badly prepared schedule forcing the team to work out of sequence, or the team simply ignoring the schedule but either way, as the ‘P-Value’ declines and more work is done out of sequence the probability of achieving the planned completion date diminishes.
Conclusion
As I suggested several years ago – your CPM schedule is wildly optimistic. This is not a bad thing if you are focused on optimising the productivity of the current project workforce (the original design intent of CPM). However, predicting a realistic project completion date requires altogether different approaches.
Before the project commences, Monte Carlo is the best option for assessing a realistic completion date and the probability of it being achieved (most practitioners accept P80, occasionally P90).
Once the project is operational, the best prediction seems to come from the Earned Schedule calculations, adjusted for the ‘P-Value’ (probable EVe). And emerging data suggests changes in the ‘P-Value’ act as effective early warning indicators of impending problems.
The challenge is of course we still need effective, realistic and reliable schedules to underpin EV, ES and Monte Carlo and every indication is the quality of scheduling has been diminishing over the last several years – for more on this see: http://www.mosaicprojects.com.au/Planning.html.


