How is the Y-Axis scale determined in the Resource/Activity Usage Profile
In Primavera when we show Resource Usage Profile or Activity Usage Profile, the max value in Y-Axis is determined by software. And we may wonder how is it determined.

I will explain in this article.
First, it depend on what is your Timescale. It is by week, month, or year. Base on that, P6 know the max value (highest bar) of your diagram.
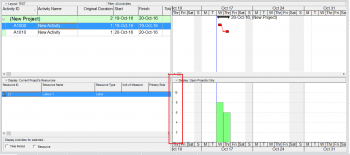
We have a simple project.

You can see the max value is 8 hours.
Then the calculation of Y-axis is like this:
- MaxY = Max * 1.2 = 8 * 1.2 = 9.6 hrs
- The number of intervals on the Y axis is always 6. There are always 5 labels on Y axis. The uppermost interval is not labeled.
Interval size = MaxY / number of intervals. (9.6 / 6 = 1.6) - Round the interval size. The leftmost digit is rounded up. (1.6 -> 2)
- Multiply rounded interval size by 6 to get new MaxY axis value (2 * 6 = 12)
In this example the y-axis will be labeled in intervals of 2 with a max value of 12.
Note:
- All calculations are done in hours, the display is then converted to days or other specified time unit.
- Remember "the leftmost digit" idea. For example, if you have the value 1200, P6 will round up to 2000.
So now we know How Primavera determine Y-Axis scale in the Resource/Activity Usage Profile
Thank you for your time to read this article.
You can also find other post at my personal blog : https://doduykhuong.com
 Printer-friendly version
- Login or register to post comments
 Send to friend