The Easiest And Fastest Way To Create Time Location Charts For Linear Projects - Turbo Chart
| ||
 | ||
THE EASIEST AND FASTEST WAY TO CREATE TIME LOCATION CHARTS FOR LINEAR PROJECTS Visit http://www.turbo-chart.com to download a full featured 14-day trial | ||
For Planners and Schedulers, improved analysis and communication of project schedules across wider project audiences leads to greater schedule support and acceptance, leading to successful project outcomes. Time Location charts (also known as Time Chainage charts) applied to Linear Infrastructure projects such as railways, tunnels or even vertical high-rise projects, offer these benefits by being able to visualise entire project schedules on a single page chart. 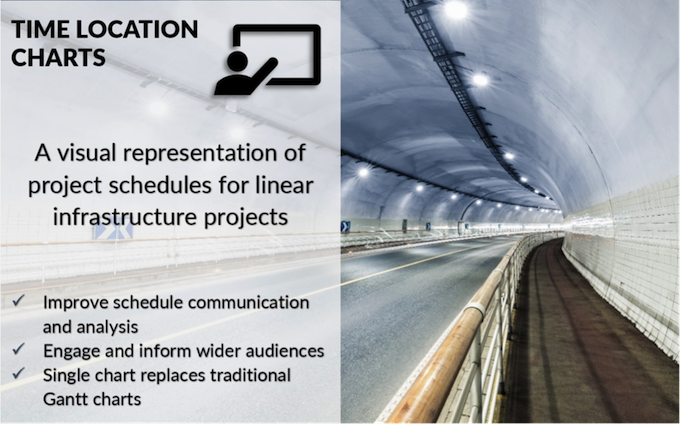 But up to now, the use of Time location charts has been limited by difficult, complex tools or error prone and time-consuming processes to create or update such charts.
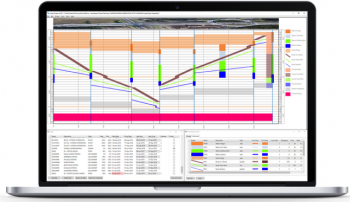
 Turbo-Chart can connect directly to schedule data sources, allowing Time Location charts to be updated in seconds as the project schedule is updated. Turbo-Chart's dataset feature can display multiple sources of data together on a single chart, to show performance comparisons such as actual vs planned. Or Perhaps to display summary schedules overlayed against detailed schedules. Turbo-Chart can also be used to display consolidated schedule data from various sources, for example from multiple contractors using different scheduling tools. 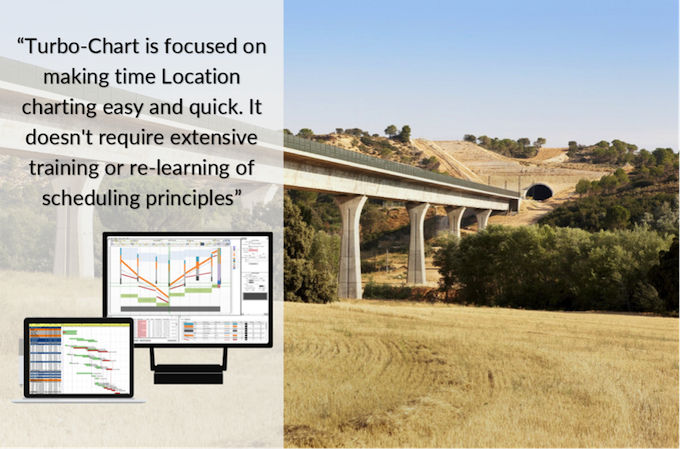 By simply clicking on any task on the chart, shape codes can define the display options for matching tasks, such as the task shape to display, the line type and fill colour. The Shape libraries can then be saved and imported between Turbo-Chart files or exchanged with other Turbo-Chart users to have common presentation of charts across your organisations projects. Turbo-Chart can create multiple charts, so any chart can display a filtered set of shapes for a specified date and location range, from any selected datasets. 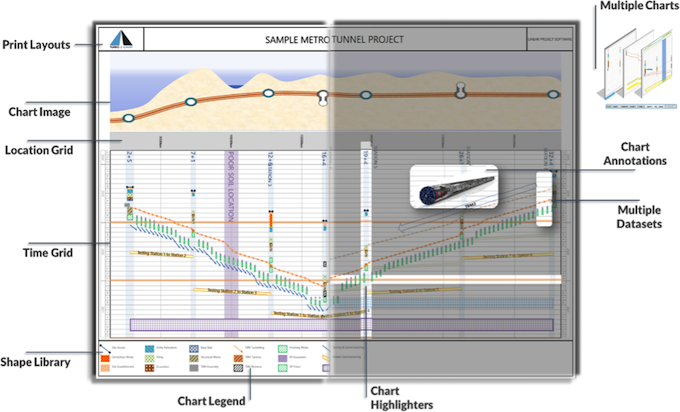 Turbo-Chart Features (download Reference Card) Turbo-Chart's highlighters lets charts use custom time and location grids to highlight key project features and dates, these can also be generated in a spreadsheet or exchanged between Turbo-Chart files and users. Charts can even include text and images by simply copying and pasting into Turbo-Chart, these annotations can be fixed to their position on the chart, fixed by date and time, or fixed relative to the position of a task.  Turbo-Chart can be downloaded and trialled for free from http://www.turbo-chart.com/download and our website features videos, user guides and articles that demonstrate why we believe by visualising your Linear Project schedules using Turbo-Chart, you can improve project scheduling outcomes. |
That's all folks... If you want to get involved and provide content for the next newsletter then please get in touch. |
Legal Bit - to unsubscribe and be removed email ppadmin@planningplanet.com