To my understanding P6 is very poor at disclosing manpower quantity (ea), in any case effort (hours), different parameters with different unit of measure.
usually manpower: the total supply of persons available and fitted for service
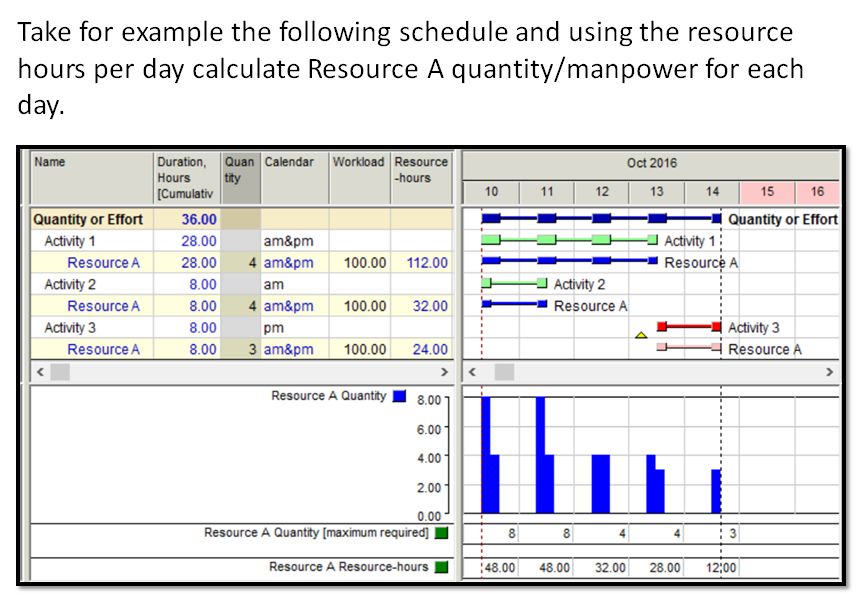
Calculating the required quantity from effort units is not always easy, a simple conversion factor will not make it. An average makes sense only when all resources are busy all the time, otherwise you might under/over estimate the required quantity. Communicating a resource plan by only using effort is not good enough.
Member for
21 years 8 months
Member for21 years8 months
Submitted by Rafael Davila on Sat, 2021-09-25 14:49
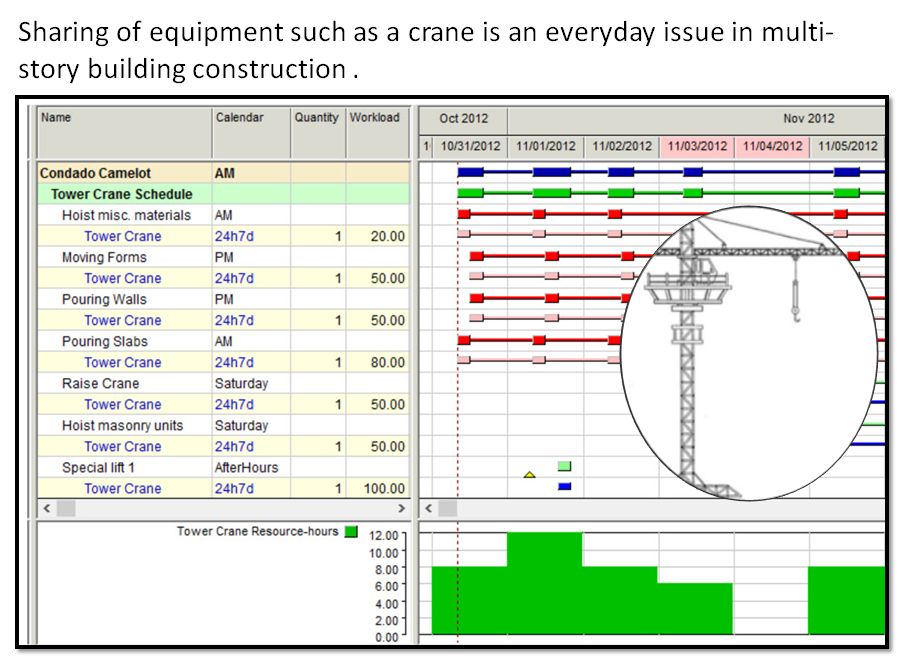
The same goes for equipment such as a single Tower Crane. To avoid chaos make sure you do not over-load this resource; easy, resource level part-time assignments.
Member for
19 years
Member for19 years
Submitted by Rodel Marasigan on Fri, 2021-09-24 15:28
Yes you can. If your schedule is resource loaded with labor (manpower) & nonlabor (machineries) then you can produce the histogram report. See step below:
Step 1: On Activity window click the activity profile icon. At the right side bottom layout of the screen, it wil show the activity usage profile graph.
Step 2. Right click on the graph and select activity usage profile options. Select Unit for Display and Select Labor for Bar/Curves. Select Budgeted by date for Bars and select Plan Value Labor Unit for Cummulative as shown below.
Step 3. Click Graph Tab. Click Calculate Average and enter the total number of hour per time period per selected timescale Ex: timescale = month = 10hr/day Mon->Fri and 5hr Sat = 55hr/week * 52 weeks (in a year)/ 12 months = 238.33 say 238. If your admin preference time period is setup as use assign calendar time period is tick you can tick Base on Hours per Time Period and it will calculate automatically. If you don't have admin right and you are using multiple calendar then I recommended to type manually to make sure as shown below.
Step 4. Click Ok and it should gave you the histogram.
Step 5. If you want to see the number table against histogram click View--> Show On Top--> Activity Usage Spreadsheet. Then colapse the to project summary then righ click and select spreadsheet options and enter same number enter on usage profile and it show you the histogram as per sample below.
You can also use Resource Usage Profile if you wanted to select only the resouces you want to show on the histogram or you can select all resources assign to project per resource type. Using resource usage profile is more flexible and you can also Show a Stacked Histogram as shown below:
Steps in showing Stacked Histogram
Step 1. Select Resource Usage Icon.
Step 2. Right Click on the Graph and select Stacked Histogram
Step 3. Right Click again and select Resource Usage Profile Options
Step 4. Select Graph Tab and select show value, click Calculate Average and enter the number of hours per time period per timescale then click apply.
Step 5. Select Data Tab and click Add. You have to create a filter per group category on your resources. On below sample I have a resource group by discipline.
Member for
16 years 3 monthsuse 2 different types of
use 2 different types of resources one for labor and the other for non-labor aka equipment
then for each activity that labor element assign a labor resource and then assign the budgeted manhours to perform that activity
then for each activity that has an equipment element assoicated with it assign the particular piece of equipment to it
Member for
21 years 8 monthsTo my understanding P6 is
To my understanding P6 is very poor at disclosing manpower quantity (ea), in any case effort (hours), different parameters with different unit of measure.
Man Power | Definition of Man Power by Merriam-Webster
Calculating the required quantity from effort units is not always easy, a simple conversion factor will not make it. An average makes sense only when all resources are busy all the time, otherwise you might under/over estimate the required quantity. Communicating a resource plan by only using effort is not good enough.
Member for
21 years 8 monthsThe same goes for equipment
The same goes for equipment such as a single Tower Crane. To avoid chaos make sure you do not over-load this resource; easy, resource level part-time assignments.
Member for
19 yearsHi Suhaila,Yes you can. If
Hi Suhaila,
Yes you can. If your schedule is resource loaded with labor (manpower) & nonlabor (machineries) then you can produce the histogram report. See step below:
Step 1: On Activity window click the activity profile icon. At the right side bottom layout of the screen, it wil show the activity usage profile graph.
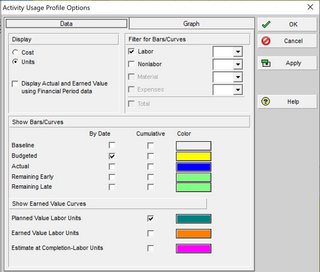
Step 2. Right click on the graph and select activity usage profile options. Select Unit for Display and Select Labor for Bar/Curves. Select Budgeted by date for Bars and select Plan Value Labor Unit for Cummulative as shown below.
Step 3. Click Graph Tab. Click Calculate Average and enter the total number of hour per time period per selected timescale Ex: timescale = month = 10hr/day Mon->Fri and 5hr Sat = 55hr/week * 52 weeks (in a year)/ 12 months = 238.33 say 238. If your admin preference time period is setup as use assign calendar time period is tick you can tick Base on Hours per Time Period and it will calculate automatically. If you don't have admin right and you are using multiple calendar then I recommended to type manually to make sure as shown below.
Step 4. Click Ok and it should gave you the histogram.
Step 5. If you want to see the number table against histogram click View--> Show On Top--> Activity Usage Spreadsheet. Then colapse the to project summary then righ click and select spreadsheet options and enter same number enter on usage profile and it show you the histogram as per sample below.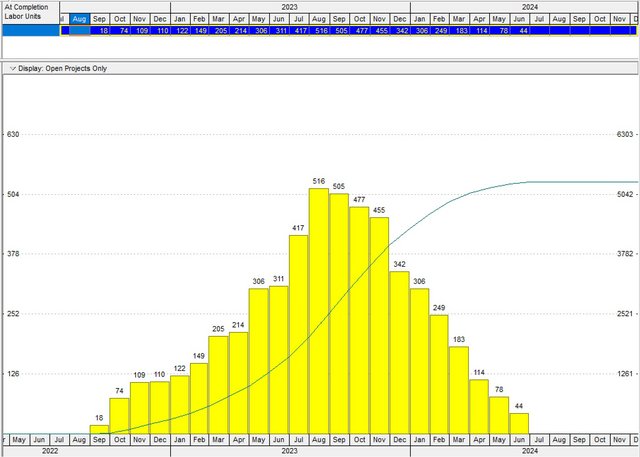
You can also use Resource Usage Profile if you wanted to select only the resouces you want to show on the histogram or you can select all resources assign to project per resource type. Using resource usage profile is more flexible and you can also Show a Stacked Histogram as shown below:

Steps in showing Stacked Histogram
Step 1. Select Resource Usage Icon.
Step 2. Right Click on the Graph and select Stacked Histogram
Step 3. Right Click again and select Resource Usage Profile Options
Step 4. Select Graph Tab and select show value, click Calculate Average and enter the number of hours per time period per timescale then click apply.
Step 5. Select Data Tab and click Add. You have to create a filter per group category on your resources. On below sample I have a resource group by discipline.