How can I set a model with 75% probability of no LDs and only 25% with LDs. This because there is ample time to finish the job on time that only a small percentage can fall in LDs? In my sample job optimistic was 0 LDs and most probable also 0 LDs. See duration of Activity 3, the one I am using to model/determine LDs.
I was expecting for the probability function to be similar to the one shown in my posting no5. If most probable 50% then perhaps the curve shown in my posting no 10 should start with the 50% at 0 and the portion to the left disregarded, this can be a compromise when values for optimistic and most probable are equal. Perhaps when spread to left differs too much to spread to right some adjustment to the curve fitting should be done and a ratio/warning should be displayed.
Optimistic:
Most Probable
Pessimistic:
I still do not get it.
For our typical job duration and low inflation rate our major concern are the LDs. A scientific estimation for the Expected Value of LDs (Mean) makes sense, perhaps the most important benefit of taking the time for using either Monte Carlo or an approximation to it. This being a statistical measure to be used for a single job occurrence and not for hundreds of thousands of jobs and where statistical distribution of individual activities can be questioned on real life applications I can live with an approximation that makes it practical for hundreds or thousands of activities portfolios, but it got to be reasonable. What I am getting does not seem reasonable. What Gary asked, to me is among the most important questions from the point of view of a contractor.
Best Regards
Rafael
Member for
24 years 9 months
Member for24 years9 months
Submitted by Vladimir Liberzon on Tue, 2010-06-08 23:15
If No LD is just your optimistic estimate and most probable is positive then it has 0% probability.
Spider supposes that most probable estimate has maximum value at the probability distribution. You can eaily find the value with 50% probability. Usually it is necessary to set targets that have 70-80% probabilities to be achieved.
Best Regards,
Vladimir
Member for
21 years 8 months
Member for21 years8 months
Submitted by Rafael Davila on Tue, 2010-06-08 13:25
I am modeling a very simple job with no expected LDs for Optimistic and Most Probable while some for Pessimistic. LDs are set to 1.00/calendar day. What I do not understand is why the Cumulative Distribution Curve for LDs shows 0% probability for no LDs, why?
A few metrics such as Mean (Expected Value) and Median as shown in Pertmaster would do no harm.
Best Regards,
Rafael
Member for
24 years 9 months
Member for24 years9 months
Submitted by Vladimir Liberzon on Tue, 2010-06-08 12:27
if you will move the date (or cost) on the cumulative probability curve in Spider Project the window below will show you the probability of any value. For most cases it is sufficient. Do you need anything else?
Gary,
in Spider Project the hammock activity will have zero duration if start is later than finish.
To simulate both savings and losts when project finishes ahead or after target date we usually create two hammocks (LOE): one starts on the project finish and finishes on the target date, another starts on the target date and finishes on the project finish.
In any case one of them will have zero duration and cost and another will show savings (negative cost) if project will finish earlier or additional expenses (positive) if project will be late.
I expect that something like this happens in P6 but did not try.
Best Regards,
Vladimir
Member for
16 years 7 months
Member for16 years7 months
Submitted by Gary Whitehead on Tue, 2010-06-08 12:06
Thats the situation Im having trouble modelling -using a hammock between contractual & forecast completion with a cost per time period works well for LDs when the project is late, but Im not sure what will happen to your hammock if the project is not late -i.e. the start link is later than the finish link. Ill give it a go when I get time and report back.
The only way Ive found to do it so far is to manually take the probability of completing each week, and multiply it by the LDs asoicated with completing that week. In that case then I agree, youd get a graph similar to yours. But Im a lazy man and I dont want to have to do it manually!
Member for
21 years 8 months
Member for21 years8 months
Submitted by Rafael Davila on Tue, 2010-06-08 10:13
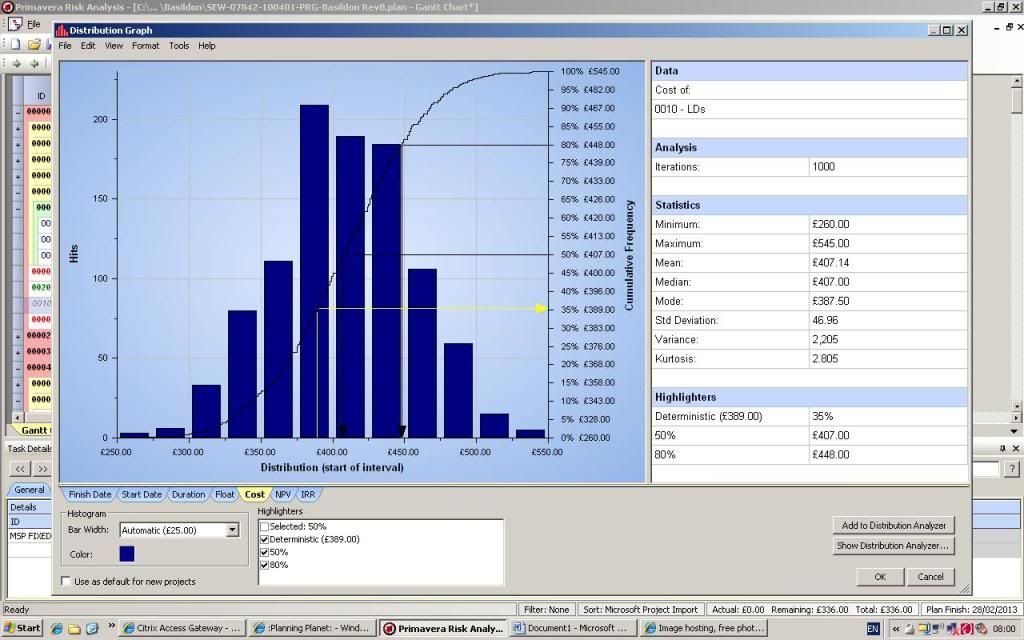
Your Graphs tell a lot, not only shows on the same screen the cumulative distribution but also a histogram of hits, very intuitive. It also shows the Mean and Median. Because Mean represents Expected Value this is a measure I find relevant.
I am still having issues on the results in case you expect your project to be on time then the histogram should show a lot of occurrences with 0 LDs as the shown above. These are not Spider Project graphs but using other software for comparison purposes. I entered on a table many 0 values and then decreasing occurrences of LDs to simulate my expectations for hits on such a job.
Best Regards,
Rafael
Member for
16 years 7 months
Member for16 years7 months
Submitted by Gary Whitehead on Tue, 2010-06-08 04:10
I would appreciate if you can post the Cumulative Distribution Curve for LDs, just to see general form. I tried with Spider Project and was expecting something as follows, but instead got something like an S Curve.
Best Regards
Rafael
Member for
21 years 8 months
Member for21 years8 months
Submitted by Rafael Davila on Sat, 2010-06-05 19:29
Usually most software gives you the cumulative distribution but not the expected value. This would be good to know in the case of liquidated damages as there is always some probability of falling into liquidated damages, this value can be used as a possible adjustment for your bid.
As an example, if there is an 80% probability you will not get LD’s while 10% for 1000 in LD’s and 10% for 2000. The expected value would be (0x0.80+0.10x1000+0.10x2000)/1.00 = 300. Or you can look at it as in 8 jobs out of 10 you will get no Ld’s, on one job you will get 1000 and on the other one you will get 2000 a total of 3000 that yields an average of 3000/10 = 300.
From Wikipedia: In probability theory and statistics, the expected value (or expectation value, or mathematical expectation, or mean, or first moment) of a random variable is the integral of the random variable with respect to its probability measure. For discrete random variables this is equivalent to the probability-weighted sum of the possible values. In other words the expected value of an uncertain event is the sum of the possible payoffs multiplied by each payoff’s chance of occurring. For continuous random variables with a density function it is the probability density-weighted integral of the possible values. The term "expected value" can be misleading. It must not be confused with the "most probable value." The expected value is in general not a typical value that the random variable can take on. It is often helpful to interpret the expected value of a random variable as the long-run average value of the variable over many independent repetitions of an experiment.
Best Regards,
Rafael
Member for
16 years 7 months
Member for16 years7 months
Submitted by Gary Whitehead on Sat, 2010-06-05 06:03
If you cannot create hammock usinf FS link then a way around can be using a milestone after contract duration activity. For the finish link on the hammock you can use a substantial completion milestone, just let it move and do not apply date constraints to it.
Member for
21 years 8 monthsRE: How do you model LDs with Pertmaster?
Vladimir,


How can I set a model with 75% probability of no LDs and only 25% with LDs. This because there is ample time to finish the job on time that only a small percentage can fall in LDs? In my sample job optimistic was 0 LDs and most probable also 0 LDs. See duration of Activity 3, the one I am using to model/determine LDs.
I was expecting for the probability function to be similar to the one shown in my posting no5. If most probable 50% then perhaps the curve shown in my posting no 10 should start with the 50% at 0 and the portion to the left disregarded, this can be a compromise when values for optimistic and most probable are equal. Perhaps when spread to left differs too much to spread to right some adjustment to the curve fitting should be done and a ratio/warning should be displayed.
Optimistic:
Most Probable
Pessimistic:
I still do not get it.
For our typical job duration and low inflation rate our major concern are the LDs. A scientific estimation for the Expected Value of LDs (Mean) makes sense, perhaps the most important benefit of taking the time for using either Monte Carlo or an approximation to it. This being a statistical measure to be used for a single job occurrence and not for hundreds of thousands of jobs and where statistical distribution of individual activities can be questioned on real life applications I can live with an approximation that makes it practical for hundreds or thousands of activities portfolios, but it got to be reasonable. What I am getting does not seem reasonable. What Gary asked, to me is among the most important questions from the point of view of a contractor.
Best Regards
Rafael
Member for
24 years 9 monthsRE: How do you model LDs with Pertmaster?
If No LD is just your optimistic estimate and most probable is positive then it has 0% probability.
Spider supposes that most probable estimate has maximum value at the probability distribution. You can eaily find the value with 50% probability. Usually it is necessary to set targets that have 70-80% probabilities to be achieved.
Best Regards,
Vladimir
Member for
21 years 8 monthsRE: How do you model LDs with Pertmaster?
Vladimir,

I am modeling a very simple job with no expected LDs for Optimistic and Most Probable while some for Pessimistic. LDs are set to 1.00/calendar day. What I do not understand is why the Cumulative Distribution Curve for LDs shows 0% probability for no LDs, why?
A few metrics such as Mean (Expected Value) and Median as shown in Pertmaster would do no harm.
Best Regards,
Rafael
Member for
24 years 9 monthsRE: How do you model LDs with Pertmaster?
Hi Rafael,
if you will move the date (or cost) on the cumulative probability curve in Spider Project the window below will show you the probability of any value. For most cases it is sufficient. Do you need anything else?
Gary,
in Spider Project the hammock activity will have zero duration if start is later than finish.
To simulate both savings and losts when project finishes ahead or after target date we usually create two hammocks (LOE): one starts on the project finish and finishes on the target date, another starts on the target date and finishes on the project finish.
In any case one of them will have zero duration and cost and another will show savings (negative cost) if project will finish earlier or additional expenses (positive) if project will be late.
I expect that something like this happens in P6 but did not try.
Best Regards,
Vladimir
Member for
16 years 7 monthsRE: How do you model LDs with Pertmaster?
Thats the situation Im having trouble modelling -using a hammock between contractual & forecast completion with a cost per time period works well for LDs when the project is late, but Im not sure what will happen to your hammock if the project is not late -i.e. the start link is later than the finish link. Ill give it a go when I get time and report back.
The only way Ive found to do it so far is to manually take the probability of completing each week, and multiply it by the LDs asoicated with completing that week. In that case then I agree, youd get a graph similar to yours. But Im a lazy man and I dont want to have to do it manually!
Member for
21 years 8 monthsRE: How do you model LDs with Pertmaster?
Your Graphs tell a lot, not only shows on the same screen the cumulative distribution but also a histogram of hits, very intuitive. It also shows the Mean and Median. Because Mean represents Expected Value this is a measure I find relevant.
I am still having issues on the results in case you expect your project to be on time then the histogram should show a lot of occurrences with 0 LDs as the shown above. These are not Spider Project graphs but using other software for comparison purposes. I entered on a table many 0 values and then decreasing occurrences of LDs to simulate my expectations for hits on such a job.
Best Regards,
Rafael
Member for
16 years 7 monthsRE: How do you model LDs with Pertmaster?
My first time trying to do a picture, so here goes:
Incase it hasnt worked, yes its an s-curve.
NB: I tried it on a project which is forecasting delay. i think it gets a bit more complex to model the cost if the project may or may not be delayed
Member for
21 years 8 monthsRE: How do you model LDs with Pertmaster?
Gary,

I would appreciate if you can post the Cumulative Distribution Curve for LDs, just to see general form. I tried with Spider Project and was expecting something as follows, but instead got something like an S Curve.
Best Regards
Rafael
Member for
21 years 8 monthsRE: How do you model LDs with Pertmaster?
Gary,
Usually most software gives you the cumulative distribution but not the expected value. This would be good to know in the case of liquidated damages as there is always some probability of falling into liquidated damages, this value can be used as a possible adjustment for your bid.
As an example, if there is an 80% probability you will not get LD’s while 10% for 1000 in LD’s and 10% for 2000. The expected value would be (0x0.80+0.10x1000+0.10x2000)/1.00 = 300. Or you can look at it as in 8 jobs out of 10 you will get no Ld’s, on one job you will get 1000 and on the other one you will get 2000 a total of 3000 that yields an average of 3000/10 = 300.
From Wikipedia: In probability theory and statistics, the expected value (or expectation value, or mathematical expectation, or mean, or first moment) of a random variable is the integral of the random variable with respect to its probability measure. For discrete random variables this is equivalent to the probability-weighted sum of the possible values. In other words the expected value of an uncertain event is the sum of the possible payoffs multiplied by each payoff’s chance of occurring. For continuous random variables with a density function it is the probability density-weighted integral of the possible values. The term "expected value" can be misleading. It must not be confused with the "most probable value." The expected value is in general not a typical value that the random variable can take on. It is often helpful to interpret the expected value of a random variable as the long-run average value of the variable over many independent repetitions of an experiment.
Best Regards,
Rafael
Member for
16 years 7 monthsRE: How do you model LDs with Pertmaster?
Of course! So simple.
-Thanks!
Member for
21 years 8 monthsRE: How do you model LDs with Pertmaster?
If you cannot create hammock usinf FS link then a way around can be using a milestone after contract duration activity. For the finish link on the hammock you can use a substantial completion milestone, just let it move and do not apply date constraints to it.