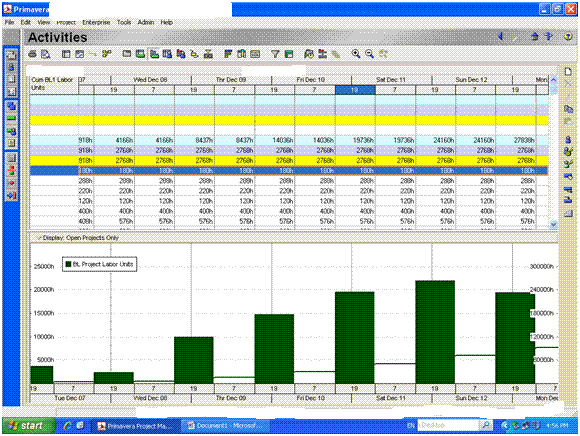
I prepared the schedule for a shutdown & loaded with resources.Unit of time used is Hrs. & the calender used is 24/7.
I wanted to view the activity distribution over the project time in 2 shifts,I selected the spread sheet on the top screen and the graph at bottom screen.
I selected the timescale>>Date Interval as Day/Shift>>Shift Calender as 2shift shutdown).
Now, I can see distribution of Manhours in Spread sheet in 2 shifts (in p6) BUT I cannot see the same distrubution in graph.In graph, I can only see the bar on only one shift and the other shift is shown blank ( there is no bar on the other shift).
In the picture you can see the bar on 19 (shift) & no bar on 7 (shift)
Waiting for your usual support.Thanks a lot in advance.